No free lunch. Introduction to participation in data analysis competitions on the Kaggle platform
The purpose of the article is to acquaint a wide audience with data analysis competitions on Kaggle . I will talk about my approach to participation on the example of Outbrain click prediction of the competition, in which I took part and took the 4th place out of 979 teams, having finished the first of the speakers alone.
To understand the material knowledge of machine learning is desirable, but not necessary.
About myself - I work as a Data Scientist / Software Engineer in captify.co.uk . This is Kaggle's second serious competition, the previous result 24/2125, also solo. I am engaged in machine learning for about 5 years, programming - 12. Linkedin profile .
The main task of machine learning is to build models that can predict results based on input data that differs from those previously reviewed. For example, we want to predict the value of shares of a particular company after a specified time, taking into account the current value, market dynamics and financial news.
')
Here, the future value of the shares will be a prediction, and the current value, dynamics and news will be input data.
Kaggle is primarily a platform for data analysis and machine learning competitions. The range of tasks is completely different - the classification of whales into species, the identification of cancerous tumors, the assessment of property values, and so on. The company organizer forms the problem, provides data and sponsors the prize fund. At the time of writing, 3 competitions are active, the total prize fund of 1.25M $ is a list of active competitions .
My last competition is Outbrain click prediction , the task is to predict what kind of advertising the user will hit from the ones shown to him. The competition is sponsored by Outbrain promoting various content, such as blogs or news. They place their ad units on a variety of different resources, including cnn.com, washingtonpost.com and others. Since the company that receives money for user clicks, they are interested in showing users content that is potentially interesting to them.
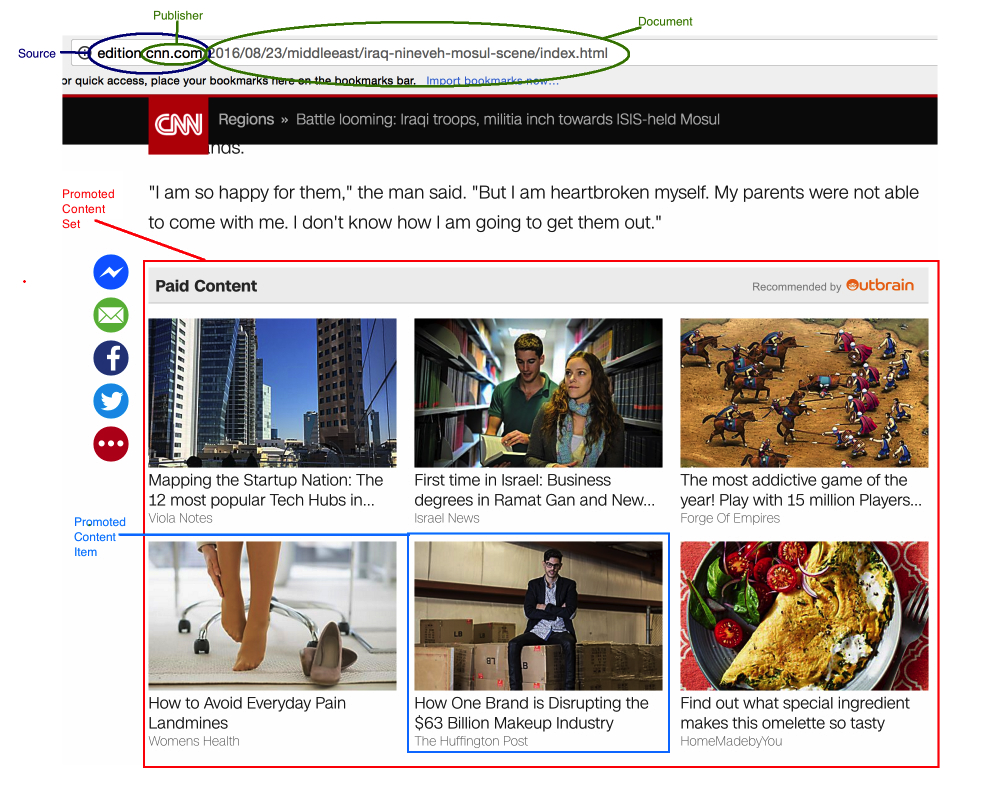
The formal description of the task - it is necessary to arrange the advertisement shown to the user in this block in a descending order according to the probability of clicking on the advertisement.
The amount of data provided is quite large, for example, a clicklog file in the 80GB area. An exact description of the input data can be obtained on the competition page .
The data provided are divided into 2 parts - those for which the participants know which banner the user will click on (training data), and data for which the result must be predicted - test ones. At the same time, Kaggle knows the actual results for the test data.
Competitors use training data to build models that predict results for test data. In the end, these predictions are loaded back, where the platform, knowing the real results, shows the accuracy of the predictions.
First of all, it is necessary to understand the data that are available to participants of the competition. On the Data page, as a rule, there is a description of the structure and semantics, and on the Competition Rules page, a description of whether it is possible to use external data sources, and if so, whether it is worth sharing them with the others.
The first thing I usually do is pump out all the data and understand the structure, the dependencies, so that they answer the formulation of the problem. For these purposes it is convenient to use Jupyter + Python. We build different graphs, statistical metrics, look at the distribution of data - we do everything that helps to understand the data.
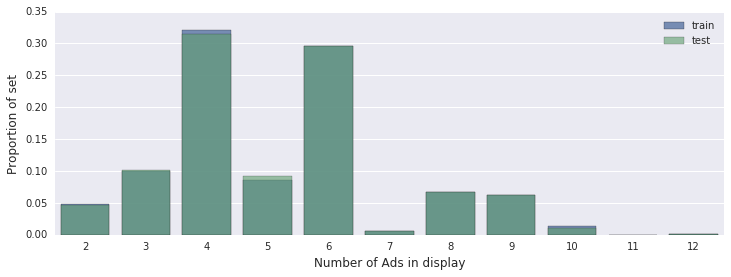
For example, let's build the distribution of the number of advertisements in one ad unit:
Also, on Kaggle there is a Kernels section, where the code can be executed directly in their laptops and usually there are guys who make various visualizations of the available dataset - this is how we start using other people's ideas.
If you have questions about the structure, dependencies or data values, you can search for the answer on the forum, or you can try to guess yourself and get an advantage over those who have (yet) not guessed.
Also, there are often Leaks in the data - dependencies, for example, temporary, which allow us to understand the value of the target variable (prediction) for a subset of the tasks.
For example, in Outbrain click prediction, from the data in the click-log it was possible to understand that the user clicked on a certain advertisement. Information about such leaks can be published on the forum, and can be used by participants without publicity.
When everything is clear with the formulation of the task and the input data in general, I start collecting information - reading books, studying similar competitions, scientific publications. This is a wonderful period of competition, when it is possible in a very tight time frame, to significantly expand their knowledge in solving problems like this.
Studying such competitions, I review its forum, where the winners as a rule describe their approaches + I study the source code of the solutions that is available.
Reading publications introduces the best at the present results and approaches. It is also great when you can find the original or re-created source code.
For example, the last two Click-Prediction competitions were won by the same team. A description of their decisions + source codes + reading the forums of these competitions gave an idea about the direction from which to begin work.
I always start by initializing the version control repository. You can lose important pieces of code even at the very beginning, it is very unpleasant to restore it later. I usually use Git + Bitbucket (free private repositories)
Validation, or testing of predictions, is an assessment of their accuracy based on the selected metric.
For example, in Outbrain click prediction, you need to predict which of the ads shown will click on the user. The data provided are divided into two parts:
The training of models takes place on the training data, in the hope that the accuracy on the test data will also improve, and it is assumed that the test and training data are taken from one sample.
In the process of learning, there is often a moment when the accuracy with respect to the training data increases, but with respect to the test data, it begins to fall. This happens because the power (Capacity) of the model allows you to remember or adjust to the test set.
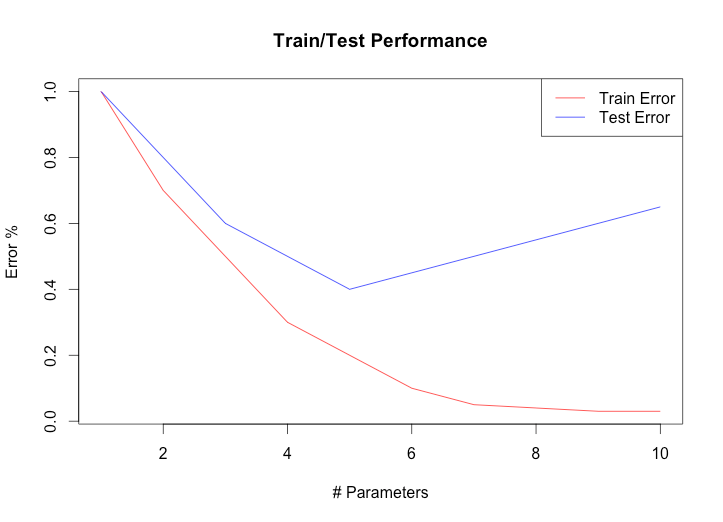
This phenomenon is called re-training (overfit), how to deal with it, we will talk below, until it is enough to understand that it is necessary to check the accuracy on data that the model did not see .
Although Kaggle makes it possible to assess the accuracy of the solution (relative to test data) by uploading it to the site, this evaluation approach has several disadvantages:
It would be nice to have a local accuracy assessment system that will allow:
Local (cross) validation is perfect for this purpose. The idea is simple - we divide the training set into a training and validation set and we will use the validation set for assessing accuracy, comparing algorithms, but not for teaching.
There are many validation methods, as well as ways to separate data, it is important to follow a few simple rules:
You can check the adequacy of local validation by comparing the improvement shown locally with the actual improvement obtained after loading the solution on Kaggle. Well, when changes in local assessment give an idea of the real improvement.
A model can be represented as a black box or a function that receives data at the input and returns the result. Results may be of a different type, most commonly used:
In Outbrain competition, it was necessary to rank an advertisement according to the probability that a user would click on it. A simple and effective way to achieve this is to use the task of classification, predict the likelihood of clicking, and sort the advertisements in a block according to the probabilities issued by the classifier:
Classifier predictions:
The format in which decisions of the problem are made:
Evaluation metric (evaluation metric) - a function that shows how accurately the prediction corresponds to real data. For each type of task, there are many metrics - for example, regression is often used based on the difference of squares of values. The competition used MEAP (Mean Average Precision) - a metric that takes into account not only the number of correct answers, but also the difference in sorting order.
Consider the simplest algorithm, when we believe that the user most likely will click on the most popular advertisement - the one that has the maximum click-through rate (CTR) ratio. In this case, the input parameters to the model are 2 values - the advertisement id and whether the advertisement was clicked. Special machine learning is not here, the usual statistical metric.
Suppose this is our training data, even under displayId, we group advertisements shown to one user in one block:
To form the first feature, we use the formula adClicked = max adId sum (adId, clicked == 1) / sum (adId)
Input values are conveniently represented as a vector for one case (often called a feature vector), and matrices for the entire data set are denoted by X. The target variable (Clicked in our case) is y
Now, when forming the answer, for each displayId, we sort the displayed advertisements by feature_1 and get the answer in the form:
display_id, ad_id
1.2 1
2.1 3
The first thing to do is to verify the accuracy of the model using the validation mechanism we have already developed. A model based on frequency with anti-aliasing returns the result significantly better than random predictions:
You can expand the model and calculate the CTR based on the user’s region as well, and consider statistics for all adId * country * state combinations encountered:
adClicked = max adId sum (adId, clicked == 1, country == displayCountry, state == displayState) / sum (adId)
It is important to build attributes for training only from the training data set, excluding the validation and test sets, otherwise we will not be able to adequately assess the accuracy of the model. If k-fold cross validation is used, such signs will have to be built k times.
Another approach is to generate features in such a way as to reduce the re-training of the model. For example, I added statistics on the frequency of clicks only for those ads where the number of views is N> 10 (the value is selected during validation). Motivation - if we add frequencies where the number of ad views == 1, an algorithm with sufficient complexity (for example, a decision tree) will determine the possibility of this feature unambiguously predict the answer and can only use it for prediction, while it is clear that this solution will be quite naive.
The whole process of generating features from the input data is often called Feature Engineering, and is often a decisive factor in successful competition, since the algorithms and meta-algorithms for teaching models are generally public.
I considered several common groups of features that define:
Consider each group in more detail:
Using a training set of data and a log of page views, you can choose a lot of interesting things about the user - which advertisements / advertising campaigns he clicked and which ones he always ignored. Since meta information about the pages led by the advertising (landing page) was given, it is possible to identify which categories of pages or topics \ entities are interesting to the user - if the landing page is sport.cnn, and the user reads sports news often at this time of the day or on this day of the week , it can be tried to use as a sign.
These and similar signs will help to later find users with similar preferences and through them to predict whether the user will click on an advertisement.
I did the selection of signs manually - based on the change in the accuracy of the estimate before / after the addition.
Here it is worth starting with a simple listing of advertising information / landing-page | of an advertising campaign + CTR similar signs based on geo-location, time of day, day of the week — for example, stateCTRCamp: the frequency of clicks on an advertising campaign (combines advertisements) in some state
By context, I mean both the page on which the ad is displayed and the time of display + user information: geo + device type Knowing the time, you can list all the advertisements and pages that the user visited / clicked yesterday \ the day before yesterday \ in the last hour. You can determine the content that is popular at the moment and so on.
country, state, platform, county, pageDocumentCategories, countryCTRAdv, campaignId, advertiserId, userDocsSeenFromLogYesterday, userClickedThisAdvertiserTimes, hourOfDay, userDocsClickedToday, lastAdvUserClicked
The total number of signs - about 120, the absolute majority - developed manually, for example userDocsSeenFromLogYesterday - documents from the click of the log viewed by the user yesterday (relative to the targeted advertising display). more extended (incomplete) list in the technical description of the solution on the competition forum.
Most of the features used are categorical — for example, country, and one-hot-encoding is used to turn it into a binary one. Some numerical features were also converted into binary characters by assigning them to a numerical interval, for smoothing some the formula log (x + 1) was used.
Coded features occurring less than 10 times are not counted. The total number of coded features> 5M, hash has not been applied to reduce the dimension.
Let us construct a logistic regression model that receives simple numerical features as input — the frequency of clicks in the country and state:
countryAdCTR = sum (adId, clicked == 1, country == displayCountry) / sum (adId)
stateAdCTR = sum (adId, clicked == 1, state == displayState) / sum (adId)
The formula for the probability of clicking on advertising will be:
y * = f (z), z = w1 * countryAdCTR + w2 * stateAdCTR, f (z) = 1 / (1 + e (-z))
f (z) is a logistic function , returns values in the interval [0: 1]. The learning algorithm selects the coefficients w1 and w2 in such a way as to reduce the difference between y * and y - i.e. maximizes the similarity of predictions and real values.
Add the categorization attributes of the advertiser and view_page_domain to the model, having previously converted them to binary using the one-hot-encoding method, for example:
Categorical:
One-hot-encoded:
The formula will be:
z = w1 * countryAdCTR + w2 * stateAdCTR + w3 * advertiser + w4 * view_page_domain
Since the advertiser and view_page is a vector, both w3 and w4 will also be vectors
In CTR prediction, it is very important to take into account the interaction of signs, for example, the page on which the advertisement and advertiser is shown - the probability of clicking on Gucci ads on the Vogue page is completely different than on Adidas ads. The model can be complemented by the interaction between the advertiser and view_page:
z = w1 * countryAdCTR + w2 * stateAdCTR + w3 * advertiser + w4 * view_page_domain + w5 * advertiser * view_page_domain
We already know that the advertiser and view_page are vectors, which means that the dimension of the vector w5 will be the length of the vector advertiser * the length of the vector view_page.
There are several problems with this - at first, it will be a very large vector - all possible domains on which advertisements are multiplied by the number of all possible advertisers. Secondly - it will be very sparse (sparse) and most of the values will never take the value 1 - we will never meet most of the combinations in real life.
FM is well suited for CTR prediction problems, since it explicitly takes into account the interaction of features, while solving the problem of sparseness of data. A wonderful description can be found in the original publication , here I will describe the main idea - each value of the attribute receives an integer vector of length k, and the result of the interaction of signs - the scalar product (dot-product) of vectors - see the formula in the publication in the Model Equation section.
During the analysis of the best models, I discovered that the last 2 competitions on CTR prediction were won by the guys with the model (ensemble) Field-aware Factorization Machines (FFM) . This is a continuation of FM, but now the signs are divided into n fields - a kind of group of signs, such as a group of signs consisting of documents viewed earlier, a group of other advertisements in this ad unit, and so on. Now each feature is represented as n vectors of dimension k - it has a different representation in each other group of features, which allows for more accurate consideration of the interaction between groups of features. Description and details are also in the publication .
FFMs are highly susceptible to retraining; an early stop is used to combat this — after each iteration of the model improvement, accuracy is assessed on the validation set. If the accuracy falls, the training stops. I made a few changes to the standard library code, the main of which was the added quality assessment based on the MEAP metric that was used to calculate the result on Kaggle, instead of the standard logloss.
One of the teams that ranked in the top 3 also added the possibility of pairwise optimization in FFM.
To be able to stop early when learning the whole model, I randomly divided the training set in the 95/5 distribution and used 5% as validation.
The final result is a simple average of the results of the work of 5 models on different random distributions with slightly different sets of features.
This method of mixing the results on subsamples of a training set is called bagging (bootstrap aggregation) and often allows to reduce the variance, which improves the result. Also, it usually works well for mixing the results of gradient boosting models (xgboost / lightGBM)
Models based on gradient booming, consistently gave worse results (comparable to FM), pairwise optimization slightly improved the picture. Also, the generation of features for FFM based on tree leaves from boosting did not work for me. The FFM → FFM or XGBOOST → FFM stack was consistently worse than the FFM on the entire data set.
Final results
The initial merging of files was done using Python, and I usually use Jupyter for data mining and analysis purposes. I also filtered out the click-log only for users found in the training \ test sets, which made it possible to reduce it from 80 to 10GB.
The original Feature engineering was also written in Python, however, given the huge amount of data, which means the time needed to process them, I quickly switched to Scala. The difference in speed at an approximate estimate was about 40 times.
To quickly iterate and estimate the improvement in accuracy, I used a subset of data, about 1/10 of the total.
This allowed to get the result about 5-10 minutes after the launch + the models were placed in the memory of the laptop.
Generating input files for the final model takes about 3 hours on a 6-core machine. Total recorded files> 500GB. The approximate learning and prediction time was 10-12 hours, memory usage was about 120GB.
The whole process is automated using scripts.
Most of the work was done on a Dell Alienware laptop (32GB RAM). For the past few weeks, I also used a workstation (i7-6800, 128GB RAM) and in the last week memory optimized x4large and x8large AWS machines, up to 2x in parallel.
The article is dedicated to my dear wife, who is very difficult to experience the time when her husband is at home, but at the same time he is not.
Thanks also to Artem Zaik for comments and reviews.
From my point of view, participation in competitions at Kaggle and the like is a great way to learn how to solve real problems using real data and evaluating your decisions against real competitors. Speaking at a high level also often requires the allocation of a large amount of time and effort, especially with full-time work and personal life has not been canceled, so such competitions can be viewed as competitions also with oneself - to win first and foremost yourself.
To understand the material knowledge of machine learning is desirable, but not necessary.
About myself - I work as a Data Scientist / Software Engineer in captify.co.uk . This is Kaggle's second serious competition, the previous result 24/2125, also solo. I am engaged in machine learning for about 5 years, programming - 12. Linkedin profile .
About machine learning and the Kaggle platform
The main task of machine learning is to build models that can predict results based on input data that differs from those previously reviewed. For example, we want to predict the value of shares of a particular company after a specified time, taking into account the current value, market dynamics and financial news.
')
Here, the future value of the shares will be a prediction, and the current value, dynamics and news will be input data.
Kaggle is primarily a platform for data analysis and machine learning competitions. The range of tasks is completely different - the classification of whales into species, the identification of cancerous tumors, the assessment of property values, and so on. The company organizer forms the problem, provides data and sponsors the prize fund. At the time of writing, 3 competitions are active, the total prize fund of 1.25M $ is a list of active competitions .
My last competition is Outbrain click prediction , the task is to predict what kind of advertising the user will hit from the ones shown to him. The competition is sponsored by Outbrain promoting various content, such as blogs or news. They place their ad units on a variety of different resources, including cnn.com, washingtonpost.com and others. Since the company that receives money for user clicks, they are interested in showing users content that is potentially interesting to them.
The formal description of the task - it is necessary to arrange the advertisement shown to the user in this block in a descending order according to the probability of clicking on the advertisement.
The amount of data provided is quite large, for example, a clicklog file in the 80GB area. An exact description of the input data can be obtained on the competition page .
The data provided are divided into 2 parts - those for which the participants know which banner the user will click on (training data), and data for which the result must be predicted - test ones. At the same time, Kaggle knows the actual results for the test data.
Competitors use training data to build models that predict results for test data. In the end, these predictions are loaded back, where the platform, knowing the real results, shows the accuracy of the predictions.
General plan for participation in competitions
- Analysis of the task and available data
- Search and study of possible solutions
- Development of a local accuracy assessment mechanism
- Generating features for the model
- Implementation (if there is no ready-made algorithm) + model building
- Accuracy Assessment
- Iterating points 4-6, adding new models (most of the time)
- Ensemble and stack of models (optional)
- Teaming (optional)
Beginning of work
Input data
First of all, it is necessary to understand the data that are available to participants of the competition. On the Data page, as a rule, there is a description of the structure and semantics, and on the Competition Rules page, a description of whether it is possible to use external data sources, and if so, whether it is worth sharing them with the others.
The first thing I usually do is pump out all the data and understand the structure, the dependencies, so that they answer the formulation of the problem. For these purposes it is convenient to use Jupyter + Python. We build different graphs, statistical metrics, look at the distribution of data - we do everything that helps to understand the data.
For example, let's build the distribution of the number of advertisements in one ad unit:
Also, on Kaggle there is a Kernels section, where the code can be executed directly in their laptops and usually there are guys who make various visualizations of the available dataset - this is how we start using other people's ideas.
If you have questions about the structure, dependencies or data values, you can search for the answer on the forum, or you can try to guess yourself and get an advantage over those who have (yet) not guessed.
Also, there are often Leaks in the data - dependencies, for example, temporary, which allow us to understand the value of the target variable (prediction) for a subset of the tasks.
For example, in Outbrain click prediction, from the data in the click-log it was possible to understand that the user clicked on a certain advertisement. Information about such leaks can be published on the forum, and can be used by participants without publicity.
Analysis of approaches to solving the problem
When everything is clear with the formulation of the task and the input data in general, I start collecting information - reading books, studying similar competitions, scientific publications. This is a wonderful period of competition, when it is possible in a very tight time frame, to significantly expand their knowledge in solving problems like this.
Studying such competitions, I review its forum, where the winners as a rule describe their approaches + I study the source code of the solutions that is available.
Reading publications introduces the best at the present results and approaches. It is also great when you can find the original or re-created source code.
For example, the last two Click-Prediction competitions were won by the same team. A description of their decisions + source codes + reading the forums of these competitions gave an idea about the direction from which to begin work.
First code
Version control
I always start by initializing the version control repository. You can lose important pieces of code even at the very beginning, it is very unpleasant to restore it later. I usually use Git + Bitbucket (free private repositories)
Local (cross) validation
Validation, or testing of predictions, is an assessment of their accuracy based on the selected metric.
For example, in Outbrain click prediction, you need to predict which of the ads shown will click on the user. The data provided are divided into two parts:
| Data type | Advertising ID for each impression |
| Training | Known to all |
| Test | It is known only to the organizers of the competition. |
The training of models takes place on the training data, in the hope that the accuracy on the test data will also improve, and it is assumed that the test and training data are taken from one sample.
In the process of learning, there is often a moment when the accuracy with respect to the training data increases, but with respect to the test data, it begins to fall. This happens because the power (Capacity) of the model allows you to remember or adjust to the test set.
This phenomenon is called re-training (overfit), how to deal with it, we will talk below, until it is enough to understand that it is necessary to check the accuracy on data that the model did not see .
Although Kaggle makes it possible to assess the accuracy of the solution (relative to test data) by uploading it to the site, this evaluation approach has several disadvantages:
- Limit on the number of weekly decisions per day. Often 2-5
- Latency of this approach - counting solutions for a test suite, writing to a file, loading a file
- Nontriviality of automation
- Probability of retraining relative to test data
It would be nice to have a local accuracy assessment system that will allow:
- Quickly evaluate accuracy based on selected metrics
- Automate brute force algorithms and / or hyperparameters
- Store assessment results along with other information for later analysis.
- Exclude retraining with respect to the test sample
Local (cross) validation is perfect for this purpose. The idea is simple - we divide the training set into a training and validation set and we will use the validation set for assessing accuracy, comparing algorithms, but not for teaching.
There are many validation methods, as well as ways to separate data, it is important to follow a few simple rules:
- The separation should not change over time to eliminate the effect on the result. For this example, you can save separate validation and training sets, save row indexes or use standard random.seed
- If you have features that are built on the entire data set — for example, the frequency of clicking on a specific advertisement depending on time, such signs should be counted only using the training set, but not validation, thus knowing the answer will not “flow” "In model
- If the data is arranged depending on time - for example, in the test set there will be data from the future, relative to the training set, you must observe the same distribution in the separation of the training / validation set
You can check the adequacy of local validation by comparing the improvement shown locally with the actual improvement obtained after loading the solution on Kaggle. Well, when changes in local assessment give an idea of the real improvement.
We build models
Introduction
A model can be represented as a black box or a function that receives data at the input and returns the result. Results may be of a different type, most commonly used:
| Model type | Return type | Example |
| Regression | Real number | Cost of N stock after 1 minute |
| Classification | Category | Payable / Insolvent Borrower |
In Outbrain competition, it was necessary to rank an advertisement according to the probability that a user would click on it. A simple and effective way to achieve this is to use the task of classification, predict the likelihood of clicking, and sort the advertisements in a block according to the probabilities issued by the classifier:
Classifier predictions:
| Displayid | Adid | Clickprob |
| five | 55 | 0.001 |
| five | 56 | 0.03 |
| five | 57 | 0.05 |
| five | 58 | 0.002 |
The format in which decisions of the problem are made:
| Displayid | Adids |
| five | 57 56 58 55 |
Evaluation metric (evaluation metric) - a function that shows how accurately the prediction corresponds to real data. For each type of task, there are many metrics - for example, regression is often used based on the difference of squares of values. The competition used MEAP (Mean Average Precision) - a metric that takes into account not only the number of correct answers, but also the difference in sorting order.
Input parameters
Consider the simplest algorithm, when we believe that the user most likely will click on the most popular advertisement - the one that has the maximum click-through rate (CTR) ratio. In this case, the input parameters to the model are 2 values - the advertisement id and whether the advertisement was clicked. Special machine learning is not here, the usual statistical metric.
Suppose this is our training data, even under displayId, we group advertisements shown to one user in one block:
| displayId | adId | clicked |
| one | one | 0 |
| one | 2 | one |
| 2 | one | one |
| 2 | 3 | 0 |
To form the first feature, we use the formula adClicked = max adId sum (adId, clicked == 1) / sum (adId)
Input values are conveniently represented as a vector for one case (often called a feature vector), and matrices for the entire data set are denoted by X. The target variable (Clicked in our case) is y
| displayId | adId | feature_1 |
| one | one | 0.5 |
| one | 2 | one |
| 2 | one | 0.5 |
| 2 | 3 | 0 |
Now, when forming the answer, for each displayId, we sort the displayed advertisements by feature_1 and get the answer in the form:
display_id, ad_id
1.2 1
2.1 3
The first thing to do is to verify the accuracy of the model using the validation mechanism we have already developed. A model based on frequency with anti-aliasing returns the result significantly better than random predictions:
| Model name | Result |
| Random guess | 0.47793 |
| Frequency with smoothing | 0.63380 |
You can expand the model and calculate the CTR based on the user’s region as well, and consider statistics for all adId * country * state combinations encountered:
| adId | Country | State | clicked |
| one | US | CA | 0 |
| 2 | US | Tx | one |
| one | UK | one | one |
adClicked = max adId sum (adId, clicked == 1, country == displayCountry, state == displayState) / sum (adId)
It is important to build attributes for training only from the training data set, excluding the validation and test sets, otherwise we will not be able to adequately assess the accuracy of the model. If k-fold cross validation is used, such signs will have to be built k times.
Another approach is to generate features in such a way as to reduce the re-training of the model. For example, I added statistics on the frequency of clicks only for those ads where the number of views is N> 10 (the value is selected during validation). Motivation - if we add frequencies where the number of ad views == 1, an algorithm with sufficient complexity (for example, a decision tree) will determine the possibility of this feature unambiguously predict the answer and can only use it for prediction, while it is clear that this solution will be quite naive.
The whole process of generating features from the input data is often called Feature Engineering, and is often a decisive factor in successful competition, since the algorithms and meta-algorithms for teaching models are generally public.
Outbrain competition features
I considered several common groups of features that define:
- User - the one who shows ads
- Advertiser
- Context + Time
Consider each group in more detail:
Custom tags
Using a training set of data and a log of page views, you can choose a lot of interesting things about the user - which advertisements / advertising campaigns he clicked and which ones he always ignored. Since meta information about the pages led by the advertising (landing page) was given, it is possible to identify which categories of pages or topics \ entities are interesting to the user - if the landing page is sport.cnn, and the user reads sports news often at this time of the day or on this day of the week , it can be tried to use as a sign.
These and similar signs will help to later find users with similar preferences and through them to predict whether the user will click on an advertisement.
I did the selection of signs manually - based on the change in the accuracy of the estimate before / after the addition.
Advertiser Signs
Here it is worth starting with a simple listing of advertising information / landing-page | of an advertising campaign + CTR similar signs based on geo-location, time of day, day of the week — for example, stateCTRCamp: the frequency of clicks on an advertising campaign (combines advertisements) in some state
Context
By context, I mean both the page on which the ad is displayed and the time of display + user information: geo + device type Knowing the time, you can list all the advertisements and pages that the user visited / clicked yesterday \ the day before yesterday \ in the last hour. You can determine the content that is popular at the moment and so on.
Used signs
country, state, platform, county, pageDocumentCategories, countryCTRAdv, campaignId, advertiserId, userDocsSeenFromLogYesterday, userClickedThisAdvertiserTimes, hourOfDay, userDocsClickedToday, lastAdvUserClicked
The total number of signs - about 120, the absolute majority - developed manually, for example userDocsSeenFromLogYesterday - documents from the click of the log viewed by the user yesterday (relative to the targeted advertising display). more extended (incomplete) list in the technical description of the solution on the competition forum.
Most of the features used are categorical — for example, country, and one-hot-encoding is used to turn it into a binary one. Some numerical features were also converted into binary characters by assigning them to a numerical interval, for smoothing some the formula log (x + 1) was used.
Coded features occurring less than 10 times are not counted. The total number of coded features> 5M, hash has not been applied to reduce the dimension.
An example of the simplest model is logistic regression
Let us construct a logistic regression model that receives simple numerical features as input — the frequency of clicks in the country and state:
countryAdCTR = sum (adId, clicked == 1, country == displayCountry) / sum (adId)
stateAdCTR = sum (adId, clicked == 1, state == displayState) / sum (adId)
The formula for the probability of clicking on advertising will be:
y * = f (z), z = w1 * countryAdCTR + w2 * stateAdCTR, f (z) = 1 / (1 + e (-z))
f (z) is a logistic function , returns values in the interval [0: 1]. The learning algorithm selects the coefficients w1 and w2 in such a way as to reduce the difference between y * and y - i.e. maximizes the similarity of predictions and real values.
Add the categorization attributes of the advertiser and view_page_domain to the model, having previously converted them to binary using the one-hot-encoding method, for example:
Categorical:
| Sample | Advertiser |
| one | Adidas |
| 2 | Nike |
| 3 | BMW |
One-hot-encoded:
| Sample | Isadidas | Isnike | Isbmw |
| one | one | 0 | 0 |
| 2 | 0 | one | 0 |
| 3 | 0 | 0 | one |
The formula will be:
z = w1 * countryAdCTR + w2 * stateAdCTR + w3 * advertiser + w4 * view_page_domain
Since the advertiser and view_page is a vector, both w3 and w4 will also be vectors
In CTR prediction, it is very important to take into account the interaction of signs, for example, the page on which the advertisement and advertiser is shown - the probability of clicking on Gucci ads on the Vogue page is completely different than on Adidas ads. The model can be complemented by the interaction between the advertiser and view_page:
z = w1 * countryAdCTR + w2 * stateAdCTR + w3 * advertiser + w4 * view_page_domain + w5 * advertiser * view_page_domain
We already know that the advertiser and view_page are vectors, which means that the dimension of the vector w5 will be the length of the vector advertiser * the length of the vector view_page.
There are several problems with this - at first, it will be a very large vector - all possible domains on which advertisements are multiplied by the number of all possible advertisers. Secondly - it will be very sparse (sparse) and most of the values will never take the value 1 - we will never meet most of the combinations in real life.
Factorization Machines (FM)
FM is well suited for CTR prediction problems, since it explicitly takes into account the interaction of features, while solving the problem of sparseness of data. A wonderful description can be found in the original publication , here I will describe the main idea - each value of the attribute receives an integer vector of length k, and the result of the interaction of signs - the scalar product (dot-product) of vectors - see the formula in the publication in the Model Equation section.
Outbrain competition model
Field-aware Factorization Machines (FFM)
During the analysis of the best models, I discovered that the last 2 competitions on CTR prediction were won by the guys with the model (ensemble) Field-aware Factorization Machines (FFM) . This is a continuation of FM, but now the signs are divided into n fields - a kind of group of signs, such as a group of signs consisting of documents viewed earlier, a group of other advertisements in this ad unit, and so on. Now each feature is represented as n vectors of dimension k - it has a different representation in each other group of features, which allows for more accurate consideration of the interaction between groups of features. Description and details are also in the publication .
FFM training
FFMs are highly susceptible to retraining; an early stop is used to combat this — after each iteration of the model improvement, accuracy is assessed on the validation set. If the accuracy falls, the training stops. I made a few changes to the standard library code, the main of which was the added quality assessment based on the MEAP metric that was used to calculate the result on Kaggle, instead of the standard logloss.
One of the teams that ranked in the top 3 also added the possibility of pairwise optimization in FFM.
To be able to stop early when learning the whole model, I randomly divided the training set in the 95/5 distribution and used 5% as validation.
The final result is a simple average of the results of the work of 5 models on different random distributions with slightly different sets of features.
This method of mixing the results on subsamples of a training set is called bagging (bootstrap aggregation) and often allows to reduce the variance, which improves the result. Also, it usually works well for mixing the results of gradient boosting models (xgboost / lightGBM)
What did not work
Models based on gradient booming, consistently gave worse results (comparable to FM), pairwise optimization slightly improved the picture. Also, the generation of features for FFM based on tree leaves from boosting did not work for me. The FFM → FFM or XGBOOST → FFM stack was consistently worse than the FFM on the entire data set.
| Model name | Result |
| My best single model result | 0.69665 |
| My best result (mix of 5 models) | 0.69778 |
| 1st place best result | 0.70145 |
Final results
Code, infrastructure and hardware
Code
The initial merging of files was done using Python, and I usually use Jupyter for data mining and analysis purposes. I also filtered out the click-log only for users found in the training \ test sets, which made it possible to reduce it from 80 to 10GB.
The original Feature engineering was also written in Python, however, given the huge amount of data, which means the time needed to process them, I quickly switched to Scala. The difference in speed at an approximate estimate was about 40 times.
To quickly iterate and estimate the improvement in accuracy, I used a subset of data, about 1/10 of the total.
This allowed to get the result about 5-10 minutes after the launch + the models were placed in the memory of the laptop.
Generating input files for the final model takes about 3 hours on a 6-core machine. Total recorded files> 500GB. The approximate learning and prediction time was 10-12 hours, memory usage was about 120GB.
The whole process is automated using scripts.
Iron
Most of the work was done on a Dell Alienware laptop (32GB RAM). For the past few weeks, I also used a workstation (i7-6800, 128GB RAM) and in the last week memory optimized x4large and x8large AWS machines, up to 2x in parallel.
Thanks
The article is dedicated to my dear wife, who is very difficult to experience the time when her husband is at home, but at the same time he is not.
Thanks also to Artem Zaik for comments and reviews.
Conclusion
From my point of view, participation in competitions at Kaggle and the like is a great way to learn how to solve real problems using real data and evaluating your decisions against real competitors. Speaking at a high level also often requires the allocation of a large amount of time and effort, especially with full-time work and personal life has not been canceled, so such competitions can be viewed as competitions also with oneself - to win first and foremost yourself.
Source: https://habr.com/ru/post/323938/
All Articles