Monitoring windows service using Zidium
Hello. In this article I will tell you how to control the operation of the windows-service using the Zidium monitoring system.
First, what is monitoring and why is it needed at all? I had an order for an application that should collect data from several systems, perform analytics, and send data to the report system. I implemented the application as a windows-service, deployed it on a hosting. The customer transferred further support of the service to me at an outsourcing, that is, I am responsible for its efficiency and for correcting errors.
But the question arose - how can I track possible problems with the service?
')
What if the service stops due to an internal error or hangs? I will not find out about this until the customer claims that the data has not been updated for several days. In addition, I need data on errors that occur, logs for analysis, etc.
What information about the status of the service I want to have:
This is where monitoring systems come to the rescue. For this project, I chose monitoring Zidium . This is a cloud monitoring system that can be used completely free of charge for an unlimited time. He has everything I need in one bottle.
Let's look first at the source code of the service, without monitoring. The service is written in C # in VS 2015 environment.
Everything is standard for windows - a stream, an infinite loop with interruption of work, some delay at the end of the iteration.
The loop executes methods that collect, process, and send data. What exactly they do for this article does not matter.
Connect Zidium to the project. This is done using the Nuget package. It adds the dll and the zidium.xml file with the settings. In the xml-file, I set the account access parameters. It is possible not to use the file, but to set everything programmatically, but it seemed to me that such a config is more correct.
All examples of use I took from the documentation on the site Zidium.
First, create an auxiliary class that will connect to the system and get the “component”. In my case, the component is the service itself. Here everything is as recommended in the documentation, corrected only the names.
To check the creation of the component, I inserted the receipt of the component into the service start method and called the IsFake method (the fact that the component on the Zidium side is created only when some real work is done with it). For normal operation, this is not necessary; after the test, this call can be deleted.

After launching a component appeared in the personal account.

His color is gray, because we have not yet transmitted any data.
Now let's add an activity signal. The so-called “unit tests” are used for this.
At the very beginning, you need to create the check itself for the “component” and store it in a variable.
Now in each iteration of the working cycle we send the result of the check that the service works as it should. In this case, I specify the time of relevance. This is exactly the time after which the system will raise the alarm if the next signal is not received.
My data is collected once an hour, so I indicated the relevance of 2 hours - a margin for 1 work cycle. For good, of course, we must take into account the real time of the methods, but I decided not to complicate things.
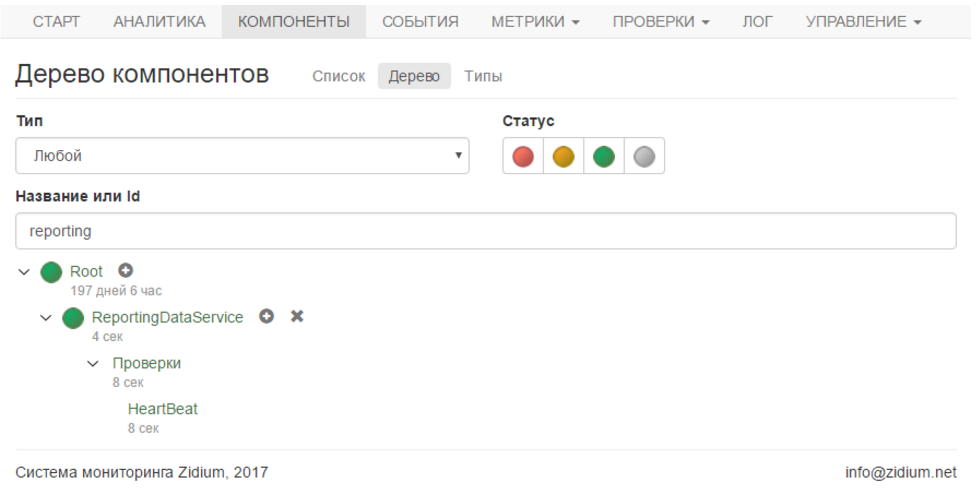
We start the service, and in the personal account we see the green component and the green check. All is well.
For the test, I indicated the time of relevance of 1 minute (so as not to wait long) and stopped the service.
After a minute, the components with the test turned red, and I received an email with a notification that there was no signal.
All notifications are quite flexible, and you can receive them by email and by sms. Each user has their own contacts and their notification settings. Ok, this problem is solved.
Now let's deal with errors. Everything is easier here.
try {} and in catch we send an error. There is a convenient ready method which from Exception selects the message, a stack, etc. and forms an error.

For the test, I just called throw new Exception () in the body of the loop. Here is the error in your account:
Again, I get notified about it if I need it.
It must be said that Zidium quite intellectually understands that several errors are in fact one and the same. Such errors are combined into one, which is very convenient. And the spam from the notifications will not be either.
Next, we have a log. Working with the log is done in the same way as other logging libraries, such as nLog or Log4Net. Just write what we want, indicating the level (importance) of the record.

Bonus - for each log entry you can attach any number of additional properties into which you can put anything - for example, xml. They do not litter the log itself, but they can always be viewed.
This is what the log in your account looks like:
For me, this is much more convenient than reading huge test files.
In addition to the cloud log, Zidium also writes a classic file log just in case (although this can be turned off). It's nice that you do not need to connect other logging libraries. Still, the file log may be useful in extreme cases, for example, if there was no connection to the cloud.
Finally, performance statistics. For this, “metrics” are used. I measure the total work time of the methods of interest to me.
The metric has a name and a value, and it is sent like this:
In your personal account you can see in detail the entire history of the metric.
The main units for the selected period are immediately considered - maximum, minimum and average.
Sorry, you can not download data in xlsx or csv format, it could be useful for your own analysis.
Even for metrics, you can configure the rules of warnings about the output values for the selected range. Then the metrics will also receive notifications. But I did not use it, it is useful for me to just have statistics on the time of work.
My service sends an activity signal to monitoring, collects errors, writes a cloud log, and keeps performance statistics.
I will receive a notification if the service suddenly stops or hangs. I will receive a notification if any error occurs.
Now I am calm for the work I have done and for fulfilling obligations to the customer)
Why monitoring?
First, what is monitoring and why is it needed at all? I had an order for an application that should collect data from several systems, perform analytics, and send data to the report system. I implemented the application as a windows-service, deployed it on a hosting. The customer transferred further support of the service to me at an outsourcing, that is, I am responsible for its efficiency and for correcting errors.
But the question arose - how can I track possible problems with the service?
')
What if the service stops due to an internal error or hangs? I will not find out about this until the customer claims that the data has not been updated for several days. In addition, I need data on errors that occur, logs for analysis, etc.
What information about the status of the service I want to have:
- Activity signal tracking (called heartbeat, heartbeat). If the service stops, the signal will stop flowing and it will become clear - something is wrong.
- Collect detailed error information. I need to fix them. So you need as much data as possible - time, message, stack, etc.
- Logging in the cloud. Why not a file? The service works on the combat server, only the admin has access to it. Admin is a busy person, logs he has no time to search and send to me. Or it turns out that the logs are too big and are not sent via corporate mail. In general, everything is difficult with the file.
- Notifications of problems by email and, well, by sms. To me - about errors, to the administrator - about stopping the service.
- Some statistics on performance - measuring the execution time of key data processing sites. This is useful to me for optimizations.
- Well, it is highly desirable to have all this in one place, and not in different accounting systems.
This is where monitoring systems come to the rescue. For this project, I chose monitoring Zidium . This is a cloud monitoring system that can be used completely free of charge for an unlimited time. He has everything I need in one bottle.
How it works
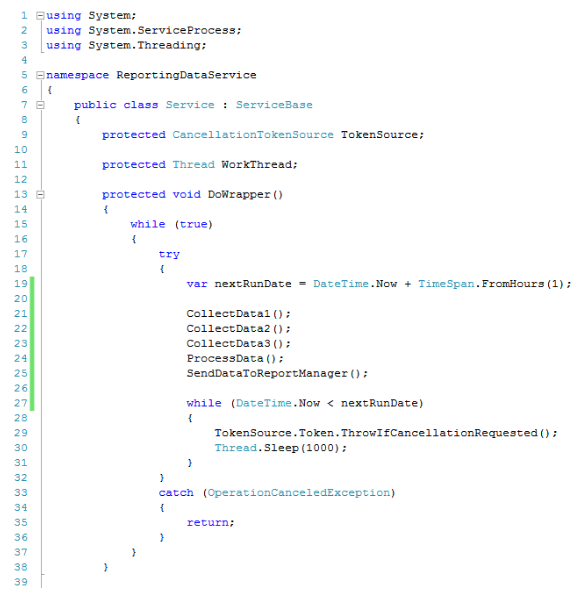
Let's look first at the source code of the service, without monitoring. The service is written in C # in VS 2015 environment.
Everything is standard for windows - a stream, an infinite loop with interruption of work, some delay at the end of the iteration.
The loop executes methods that collect, process, and send data. What exactly they do for this article does not matter.
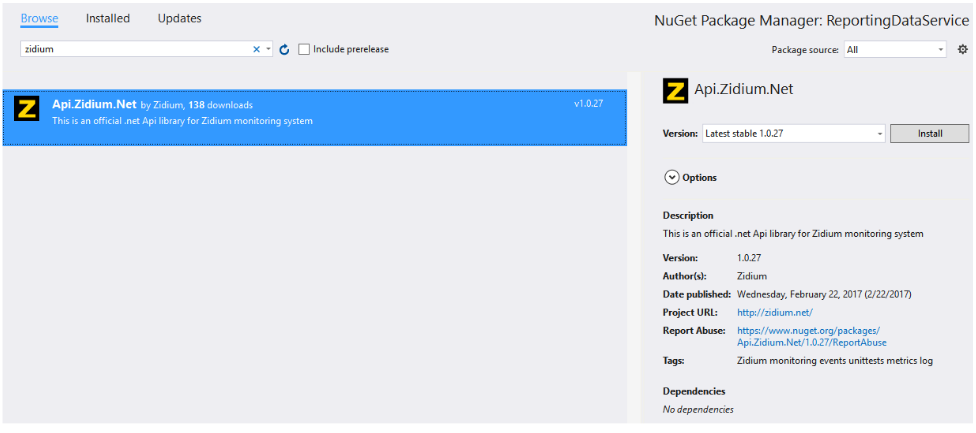
Connect Zidium to the project. This is done using the Nuget package. It adds the dll and the zidium.xml file with the settings. In the xml-file, I set the account access parameters. It is possible not to use the file, but to set everything programmatically, but it seemed to me that such a config is more correct.
All examples of use I took from the documentation on the site Zidium.
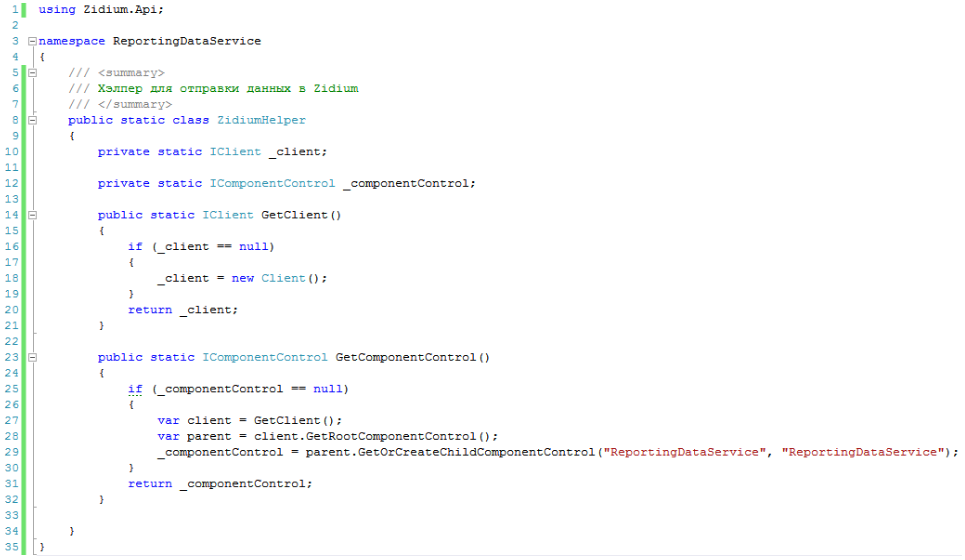
First, create an auxiliary class that will connect to the system and get the “component”. In my case, the component is the service itself. Here everything is as recommended in the documentation, corrected only the names.
To check the creation of the component, I inserted the receipt of the component into the service start method and called the IsFake method (the fact that the component on the Zidium side is created only when some real work is done with it). For normal operation, this is not necessary; after the test, this call can be deleted.
After launching a component appeared in the personal account.
His color is gray, because we have not yet transmitted any data.
Activity signal (HeartBeat)
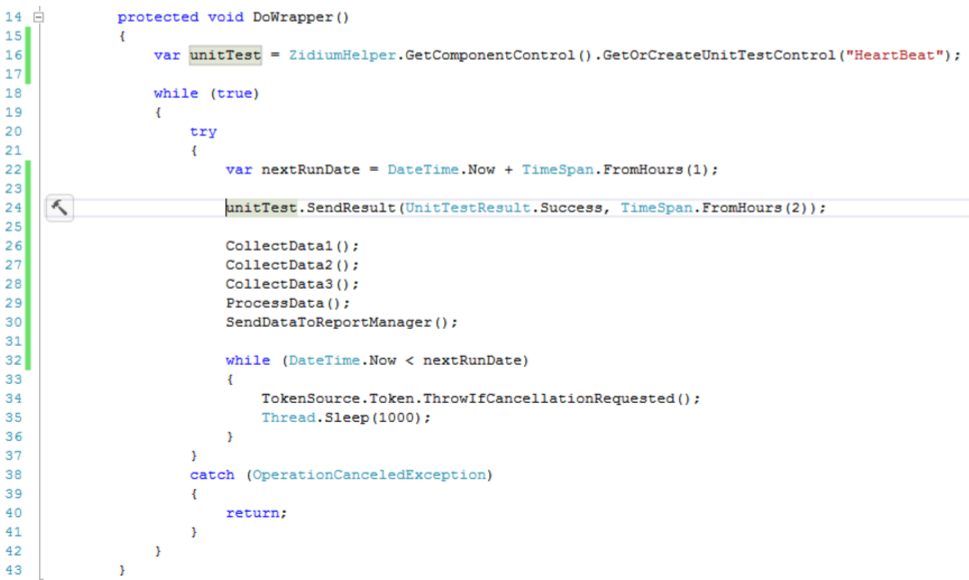
Now let's add an activity signal. The so-called “unit tests” are used for this.
At the very beginning, you need to create the check itself for the “component” and store it in a variable.
Now in each iteration of the working cycle we send the result of the check that the service works as it should. In this case, I specify the time of relevance. This is exactly the time after which the system will raise the alarm if the next signal is not received.
My data is collected once an hour, so I indicated the relevance of 2 hours - a margin for 1 work cycle. For good, of course, we must take into account the real time of the methods, but I decided not to complicate things.
We start the service, and in the personal account we see the green component and the green check. All is well.
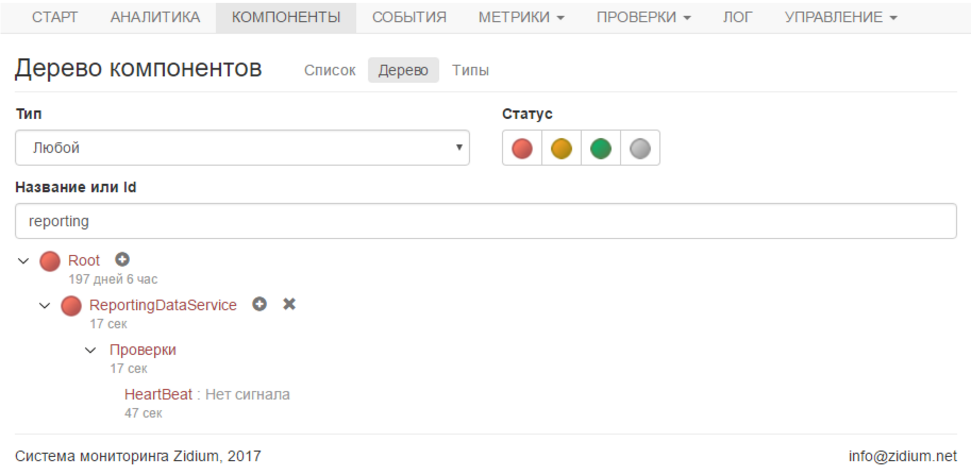
For the test, I indicated the time of relevance of 1 minute (so as not to wait long) and stopped the service.
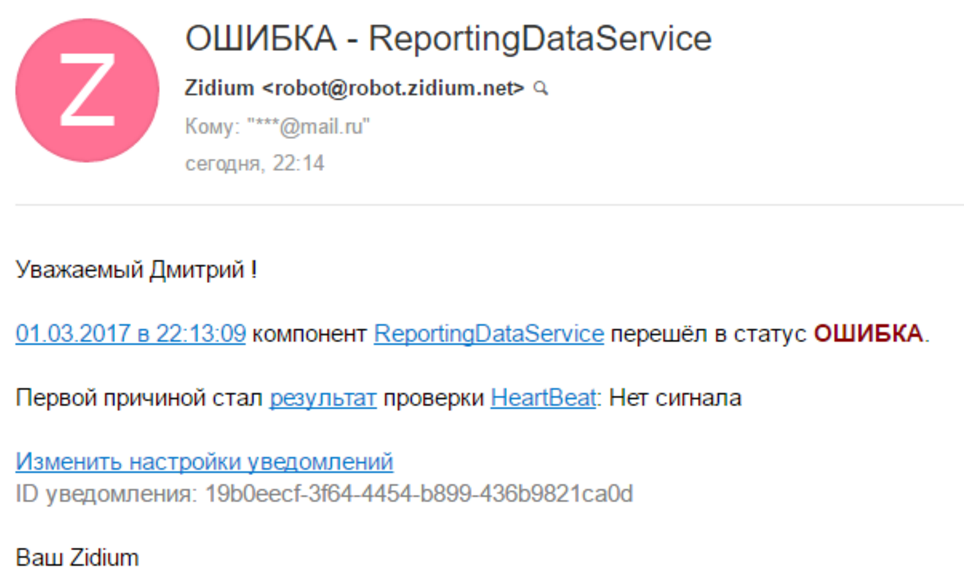
After a minute, the components with the test turned red, and I received an email with a notification that there was no signal.
All notifications are quite flexible, and you can receive them by email and by sms. Each user has their own contacts and their notification settings. Ok, this problem is solved.
Errors
Now let's deal with errors. Everything is easier here.
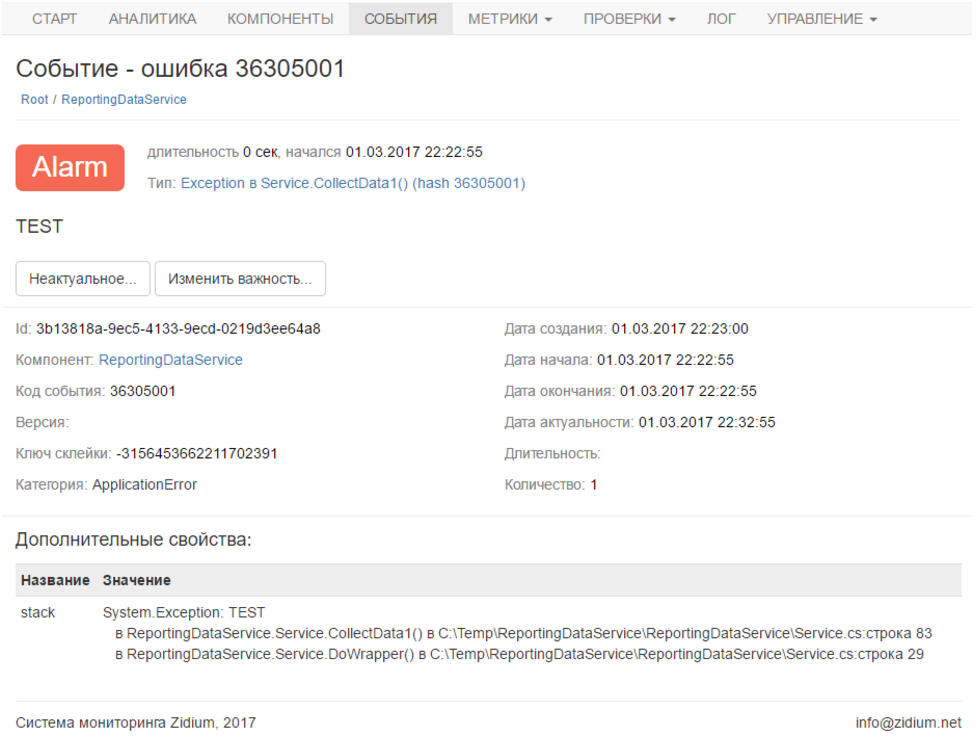
try {} and in catch we send an error. There is a convenient ready method which from Exception selects the message, a stack, etc. and forms an error.
For the test, I just called throw new Exception () in the body of the loop. Here is the error in your account:
Again, I get notified about it if I need it.
It must be said that Zidium quite intellectually understands that several errors are in fact one and the same. Such errors are combined into one, which is very convenient. And the spam from the notifications will not be either.
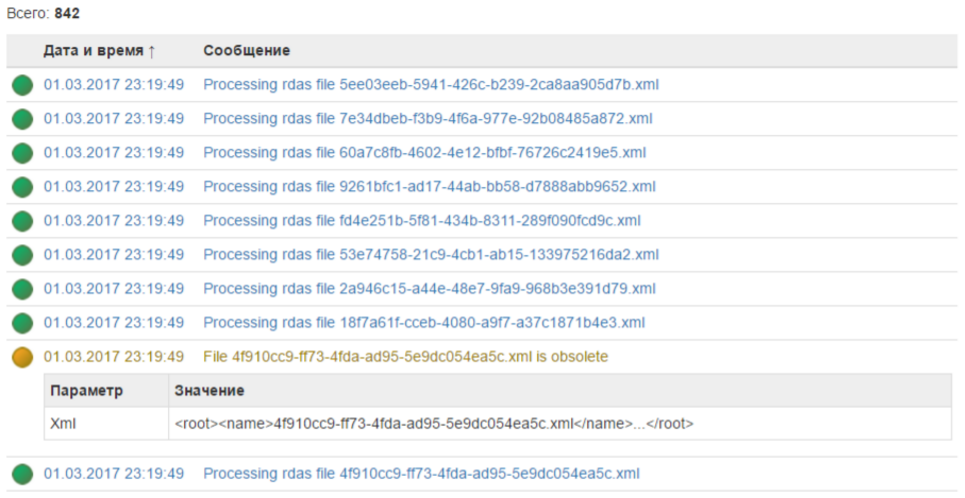
Log
Next, we have a log. Working with the log is done in the same way as other logging libraries, such as nLog or Log4Net. Just write what we want, indicating the level (importance) of the record.
Bonus - for each log entry you can attach any number of additional properties into which you can put anything - for example, xml. They do not litter the log itself, but they can always be viewed.
This is what the log in your account looks like:
For me, this is much more convenient than reading huge test files.
In addition to the cloud log, Zidium also writes a classic file log just in case (although this can be turned off). It's nice that you do not need to connect other logging libraries. Still, the file log may be useful in extreme cases, for example, if there was no connection to the cloud.
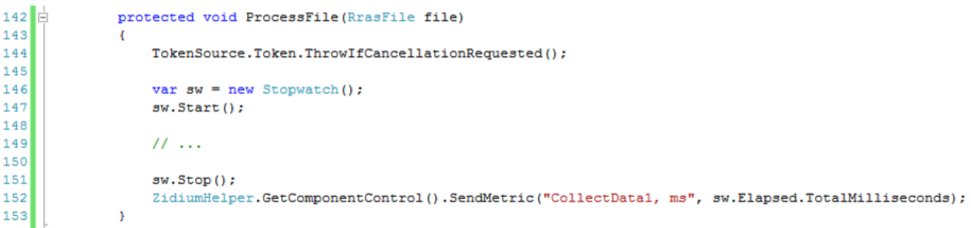
Performance
Finally, performance statistics. For this, “metrics” are used. I measure the total work time of the methods of interest to me.
The metric has a name and a value, and it is sent like this:
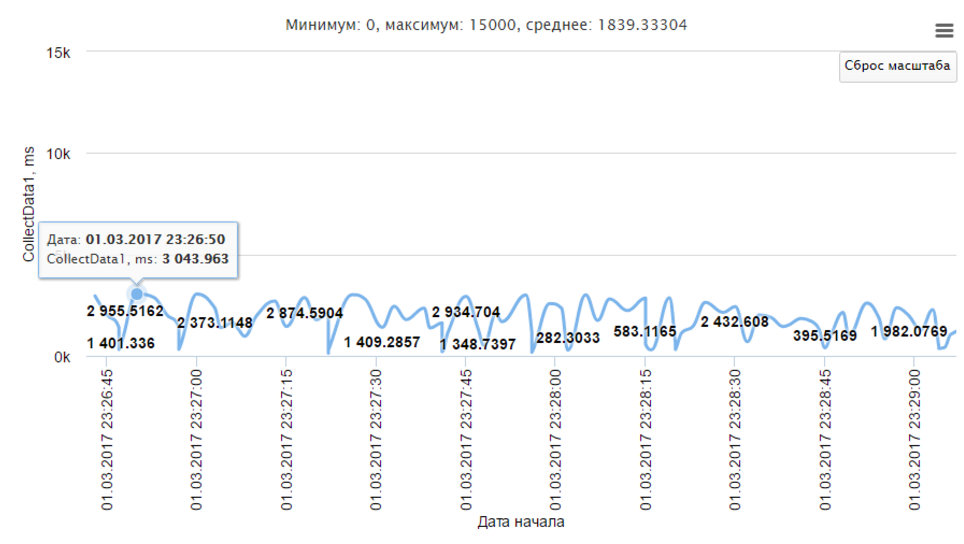
In your personal account you can see in detail the entire history of the metric.
The main units for the selected period are immediately considered - maximum, minimum and average.
Sorry, you can not download data in xlsx or csv format, it could be useful for your own analysis.
Even for metrics, you can configure the rules of warnings about the output values for the selected range. Then the metrics will also receive notifications. But I did not use it, it is useful for me to just have statistics on the time of work.
Total
My service sends an activity signal to monitoring, collects errors, writes a cloud log, and keeps performance statistics.
I will receive a notification if the service suddenly stops or hangs. I will receive a notification if any error occurs.
Now I am calm for the work I have done and for fulfilling obligations to the customer)
Source: https://habr.com/ru/post/323906/
All Articles