Internet of Things in archeology
I want to introduce you to Stas Pavlov , our IoT expert, who has selected several interesting technological stories that have appeared in the framework of Microsoft Technical Case Studies. All the results of work on it can be found on GitHub . Stas was interested in this material because IoT technologies were used in an unusual place - to monitor the state of the ancient mitreum in Rome. Inside you will find some history of ancient Rome and a lot of Internet of things.
1. Power BI Embedded, IoT and machine learning for processing brain thermograms .
2. As in Canada, looking for missing children .
3. Internet of things in archeology .
4. Loading ...
This project refers to the study of an important archaeological monument of Rome - Mitreum, located under the stands of the Great Circus. The work was carried out in conjunction with the Technical University of Milan (PoliMi) - the University of Science and Technology, which graduates engineers, architects and industrial designers. In addition to the university, the city department of cultural heritage (Sovrintendenza Capitolina) and the University of Trieste also participated in the work.
')
We collected the readings of sensors installed inside the mitreum to remotely monitor the carbon dioxide concentration, vibration level, temperature and humidity.
Mithrum has been preserved in good condition to this day. It was first discovered in the 1930s during the restoration of the Rome Opera House. The building dates from the II century BC. e. She probably rebuilt many times. In the III century BC. e. its lower floor was set aside under the sanctuary - mitreum.
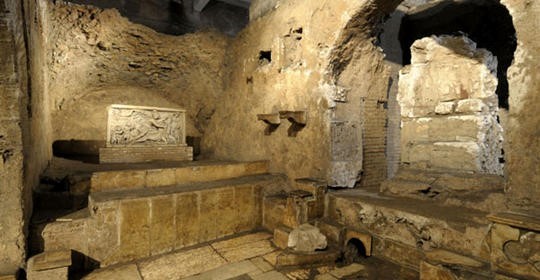
Mitreum in the Great Circus (Rome)
The following IoT devices and technologies were used in the project:
The main task of this project is remote monitoring of the current state of mitreum with the help of special sensors installed inside this architectural monument. Among them are accelerometers, carbon dioxide sensors, temperature and humidity. The data is transmitted to the field gateway, and then to the cloud infrastructure for the purpose of publishing it in visual form on a regular web page.
Visualization of data on the website
For PoliMi, the monitoring of mitreum was the first project on the way to creating a reference system for collecting data from archaeological sites. In the future, it will use different types of sensors, gateways and a single cloud architecture built for this project, so this project used IoT technologies potentially useful for the following developments.
The main goals of this project are:
First of all, we held several Skype meetings to more accurately define the tasks and understand the current state of the project. When we started creating cloud architecture, the PoliMi staff had already chosen the sensors and installed them in the mitreum.
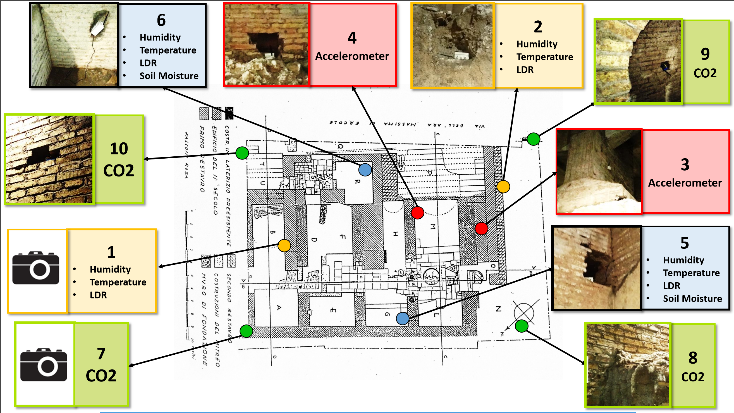
The location of the sensors in the mitreum
At regular intervals (depending on the selected frequency in milliseconds), the sensors send small data sets to the field gateway, where they are processed locally. As can be seen from the table below, the size of each message is quite small, so every 30 minutes the data is grouped into a single file in the .txt format containing all the sensor readings. The C # console application processes the resulting file, after which the structured data is sent to the Azure IoT Hub.
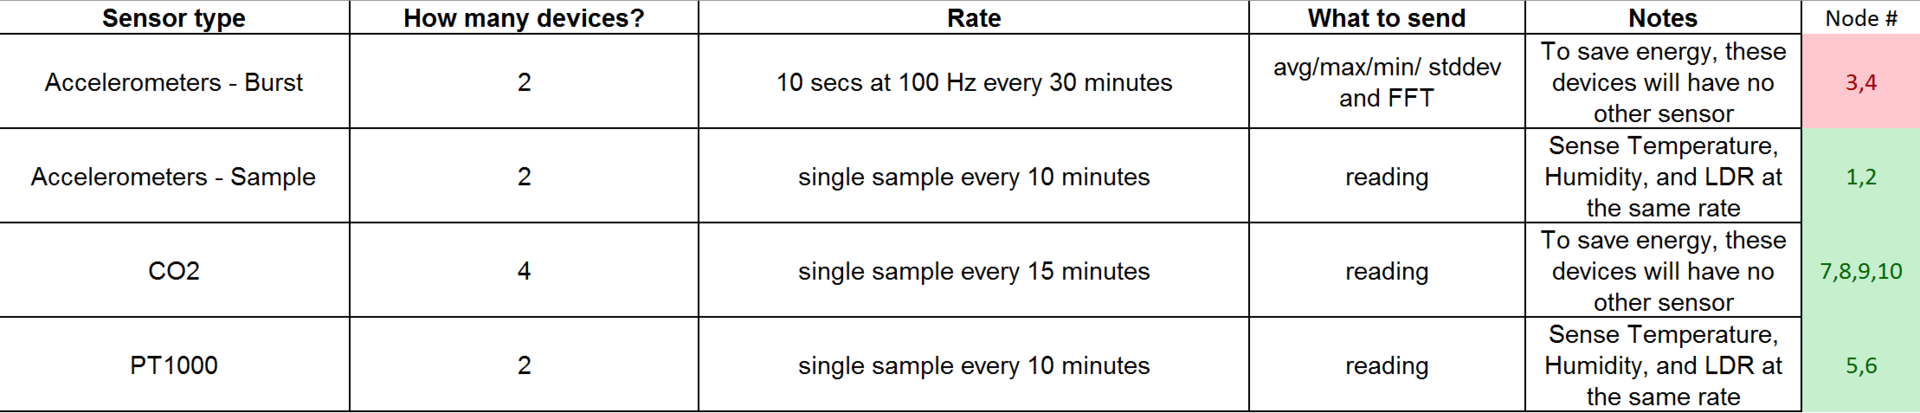
Characteristics of sensors in mitreum
Based on this data, we were able to calculate the monthly cost of the entire cloud infrastructure prior to its deployment, using the Azure price calculator. This initiative, highly appreciated by the client, allowed to continue work on the project. Of course, other advantages also played a role: easy deployment, scaling and transfer of the solution, project support by highly qualified Microsoft employees.
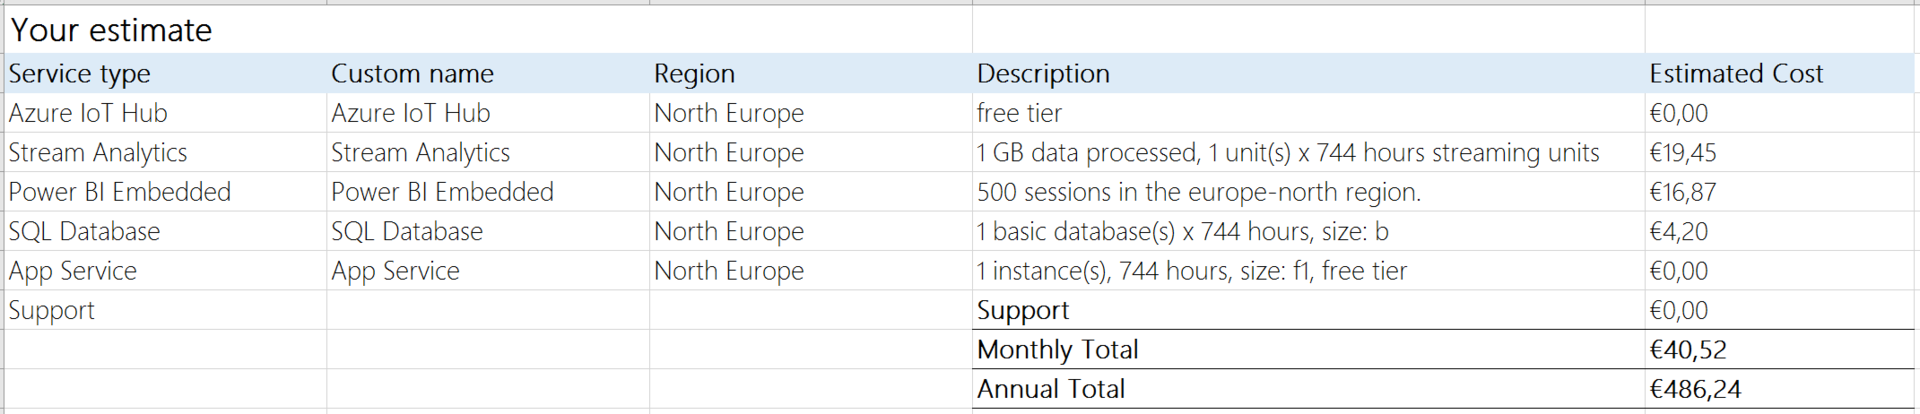
Cost calculation
One of the most serious tasks in this project was the data analysis. It was necessary to separate the readings of all the sensors collected in a text file in order to create the correct message to be sent to the IoT Hub. In solving this problem, we were very helped by the specialists of the PoliMi University. Having clearly understood and defined the message structure, we were able to visualize the data correctly.
Another major challenge was the integration of cloud infrastructure with sensors and a gateway.
We worked together with the client, using various forms of communication: several conferences in Skype, personal meetings, remote development and discussion. In total, we spent about 10 full working days on all stages of the project, including design, development and testing. During this time we organized the implementation of the system and created a comprehensive solution.
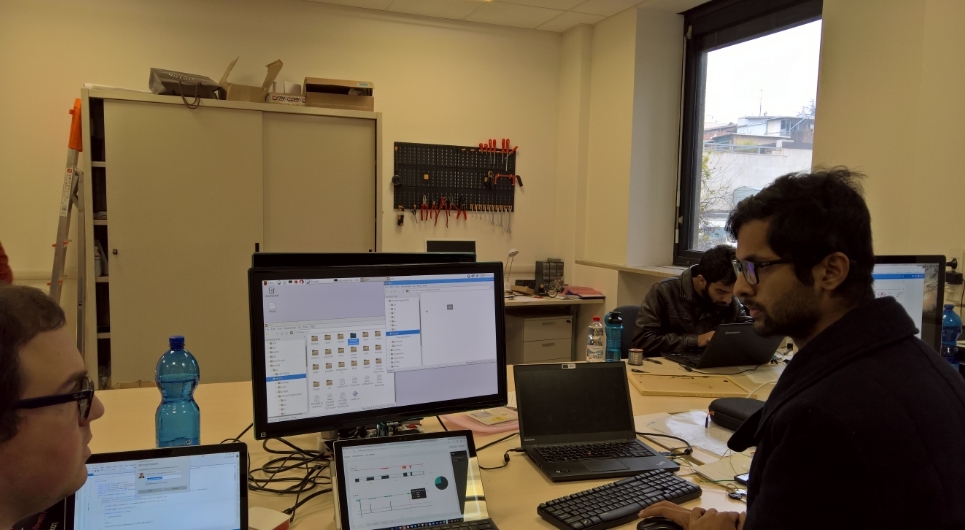
Full-time meeting with Kostab and Luka
As described above, four kinds of sensors send data to the field gateway at the frequency indicated on the solution diagram below.
The network gateway connects to the Azure IoT Hub and sends approximately 1 KB of data every 30 minutes. We chose MQTT as the protocol, since it is widely distributed and convenient for use with the models of the nodes of this project.
Azure Stream Analytics processes the data stream and sends the measurement results to the appropriate SQL database table.
The web application publishes Power BI reports so that end users (PoliMi specialists) get visualized data.
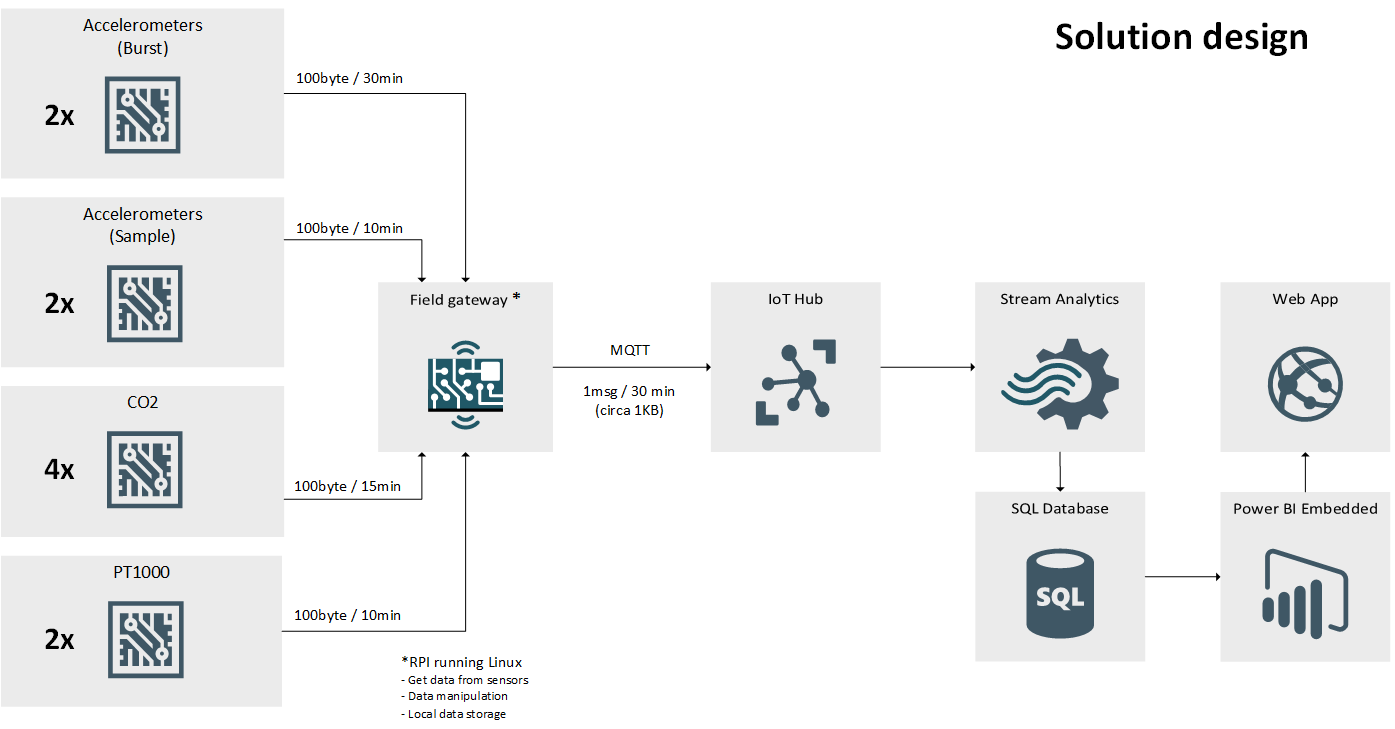
Project Architecture
10 Libelium Waspmote sensors were used for data collection. Their type was chosen by archaeologists and staff responsible for the restoration of the object. Libelium sensor models for the Waspmote computing device were used, including:
The readings are transmitted to the device Raspbery Pi 2, running under the operating system Raspbian and acting as a field gateway.
The choice of OS was determined by the preferences of the client, who had extensive experience with the Raspbian OS and almost did not use Windows 10 IoT Basic and other operating systems. The device processes the data received from the sensors. For example, for values collected from nodes 3 and 4 (accelerometers), a fast Fourier transform (FFT) is performed, which is added to the message sent to the cloud.
A Python application running on the gateway generates a text file with all the data collected every 30 minutes. The choice of Python programming language was for Kostab Dolui the best way to minimize efforts and simplify the replication of the solution on various platforms in the future. This file will be used to send data to the IoT Hub. The image below is a sample .txt file with raw data that will be parsed by the C # console application on the field gateway.
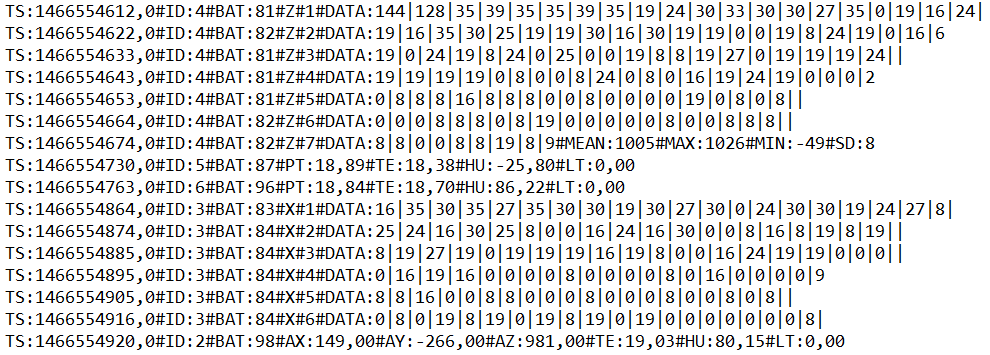
Raw file text file
To send the required data, you need to convert a text file in a console application running on the field gateway. At this stage, there was a question about the choice of the development language of the console application. IoT Hub SDK is available for both Python and C #. Having discussed both options with the client, we decided to develop an application in C #, because we knew the language better. We then installed the Mono software on the Raspberry Pi device to run the application.
This application creates a JSON array of measurements ready for sending to IoT Hub containing the readings of all sensors extracted from a text file. During the final testing, we used a very large file in the .txt format and found some problems with the size of the messages sent to the IoT Hub.

Text parsing scheme
Creating a means of parsing the indications of nodes 3 and 4 was complicated by the nature of the data being sent. They had to send the following information to the field gateway: time stamp, node ID, battery charge level, coordinates, packet number and a set of 20 numbers that are part of the FFT. Data transmission from a single sensor for specific coordinates consists of seven packets with time stamps within 70 milliseconds. We had to identify these packets and create one row in the table, including all the FFT values of the seven packets (represented as a JSON array and stored together as a string).
As mentioned earlier, due to the connection features, first of all we had to process a text file containing sensor readings. Real-time monitoring was not the goal of this project, so the resulting model functions with a slight delay. In the end, we decided not to abandon the text file created by the field gateway, because it can be useful to the client as a log file. We also continued to use the developed parser.
The Raspberry Pi works as an opaque field gateway, so we registered the C # console application as a unique device for IoT Hub. This means that no matter how many sensors we connect to it, the gateway will perform all the necessary manipulations, aggregate the data and create a message to send to the IoT Hub. In addition, this approach will allow re-use of the developed architecture for other archaeological objects and create a scalable and easily portable solution.
Azure IoT Hub allows you to register each device with a name and a symmetric key. This means that each device gets its own connection string.
If it is hacked, the corresponding device can be turned off by stopping the exchange of data with it using the control panel on the Azure portal.
IoT Hub provides a ready-made effective solution for the protection of transmitted data. Before the start of the project, no security requirements were presented, but this feature was widely accepted by the client.
The data transferred to Azure IoT Hub, are subject to storage and visualization. After discussion with the client, we decided to create a database with four different tables, one for each type of sensor. We chose a SQL database, as it is possible to directly request data from it in PowerBI Embedded.
Azure Stream Analytics is then configured with one incoming stream and four outgoing data streams, as can be seen in the screenshot below.
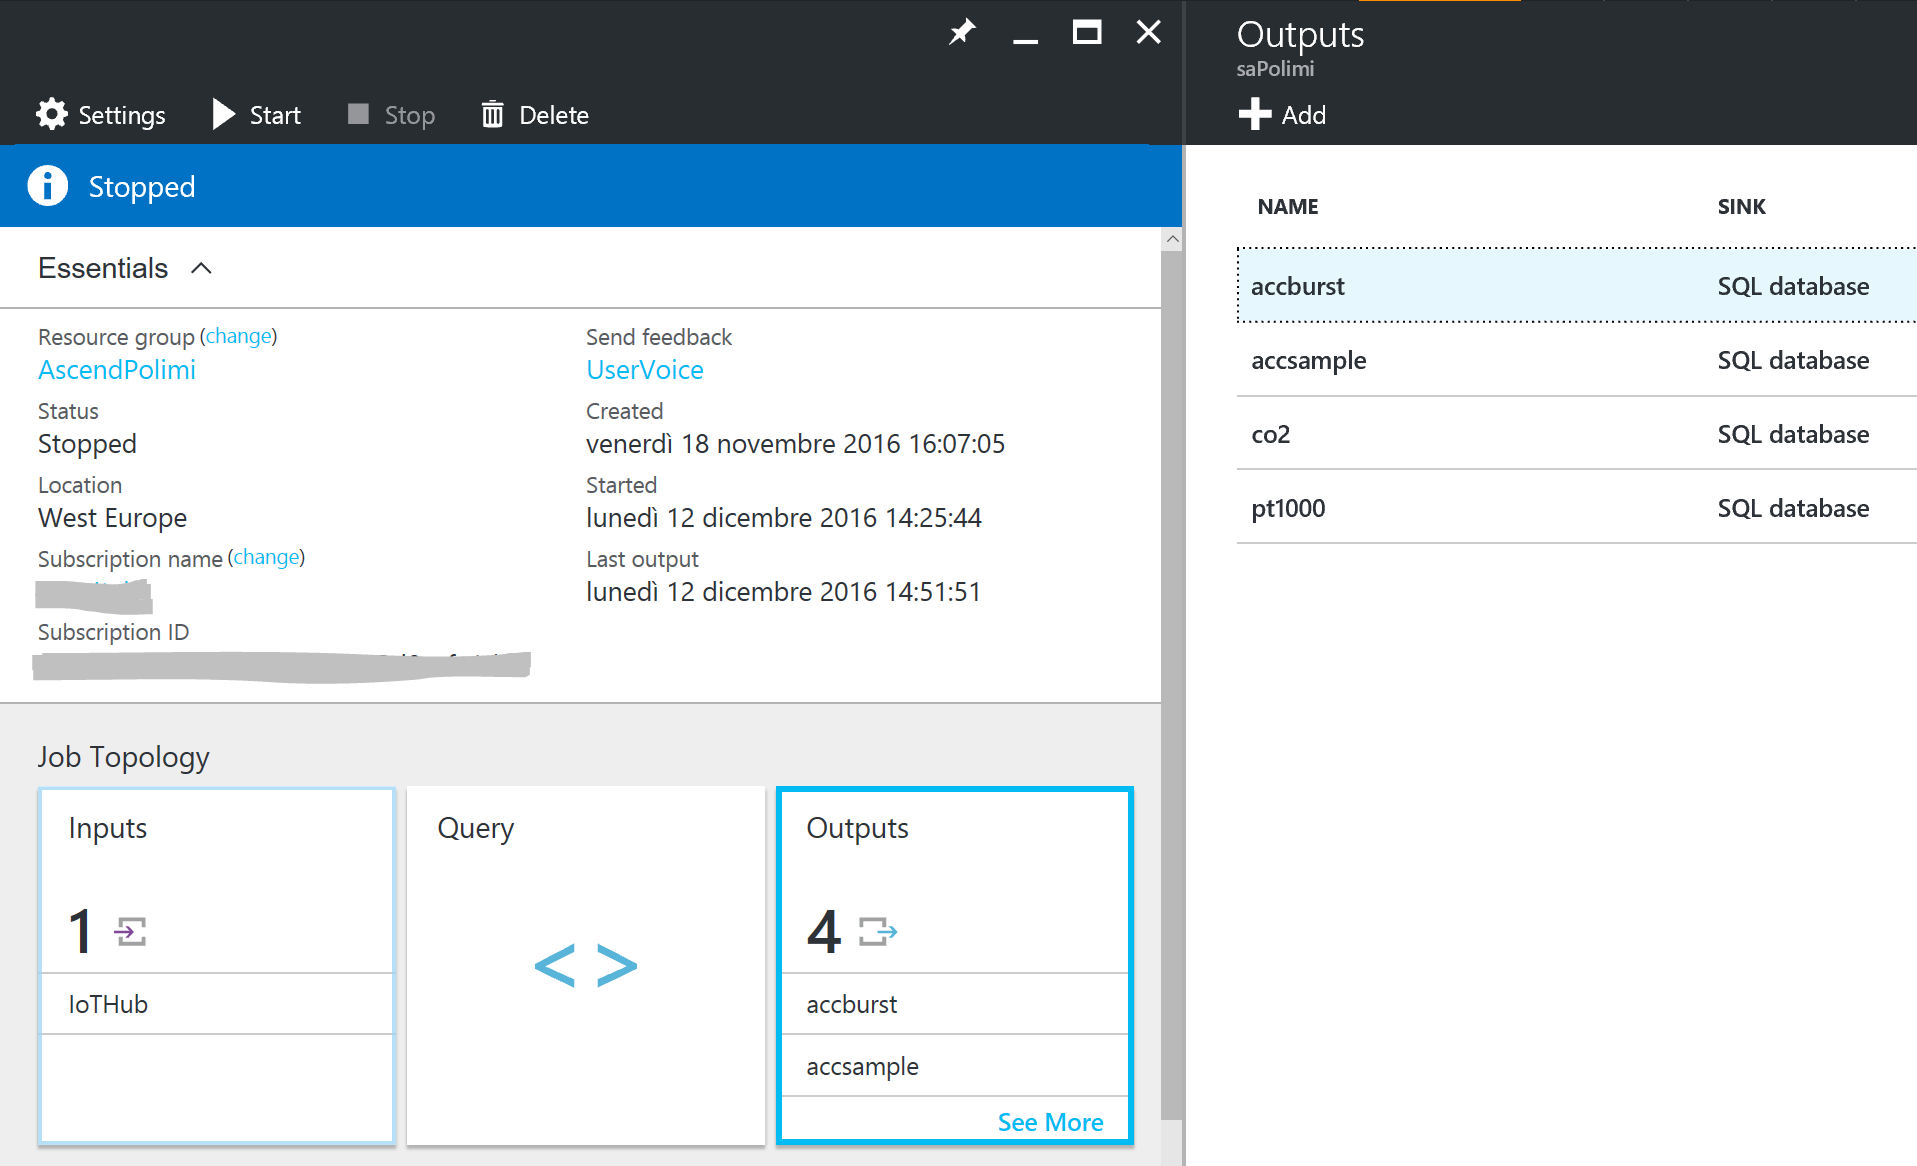
Azure Stream Analytics
The query consists of four operators that send telemetry data to the corresponding SQL database table. For example:
As you can see, the
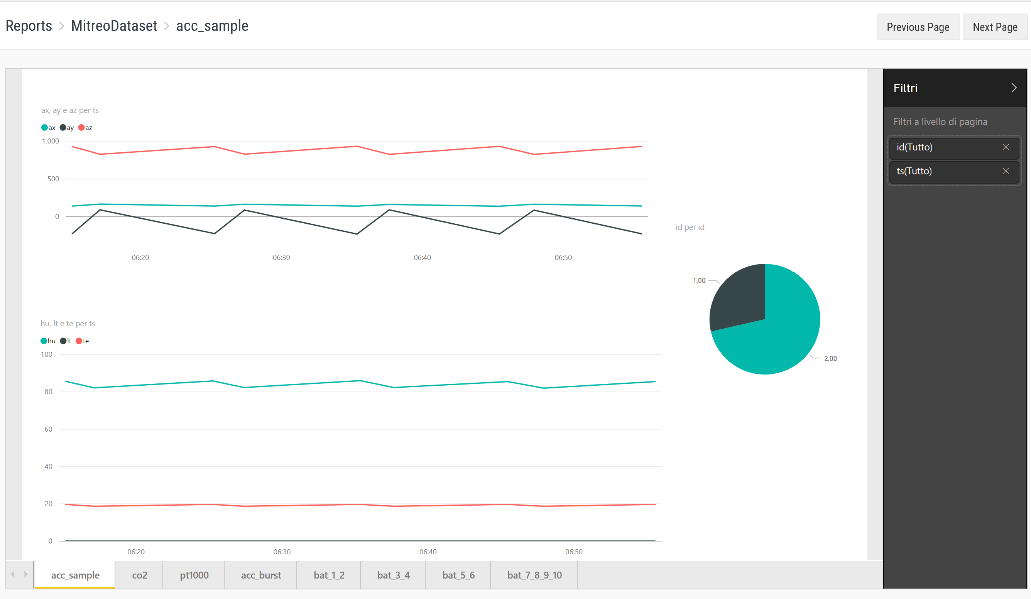
The final stage of the project is visualization. To simplify data analysis, we decided to embed a Power BI report into an ASP.NET web application. Due to this, we managed to realize two important goals of this project: to display data on diagrams that the client can easily personalize, and, most importantly, open public access to sensor readings.
Charts, graphs and data filters, available in a web application, were created in close cooperation with the client, so that the result corresponded to the expectations: various tabs for various sensors, filters, and so on.
Another example of specific requirements: filtering data by timestamp for each device.
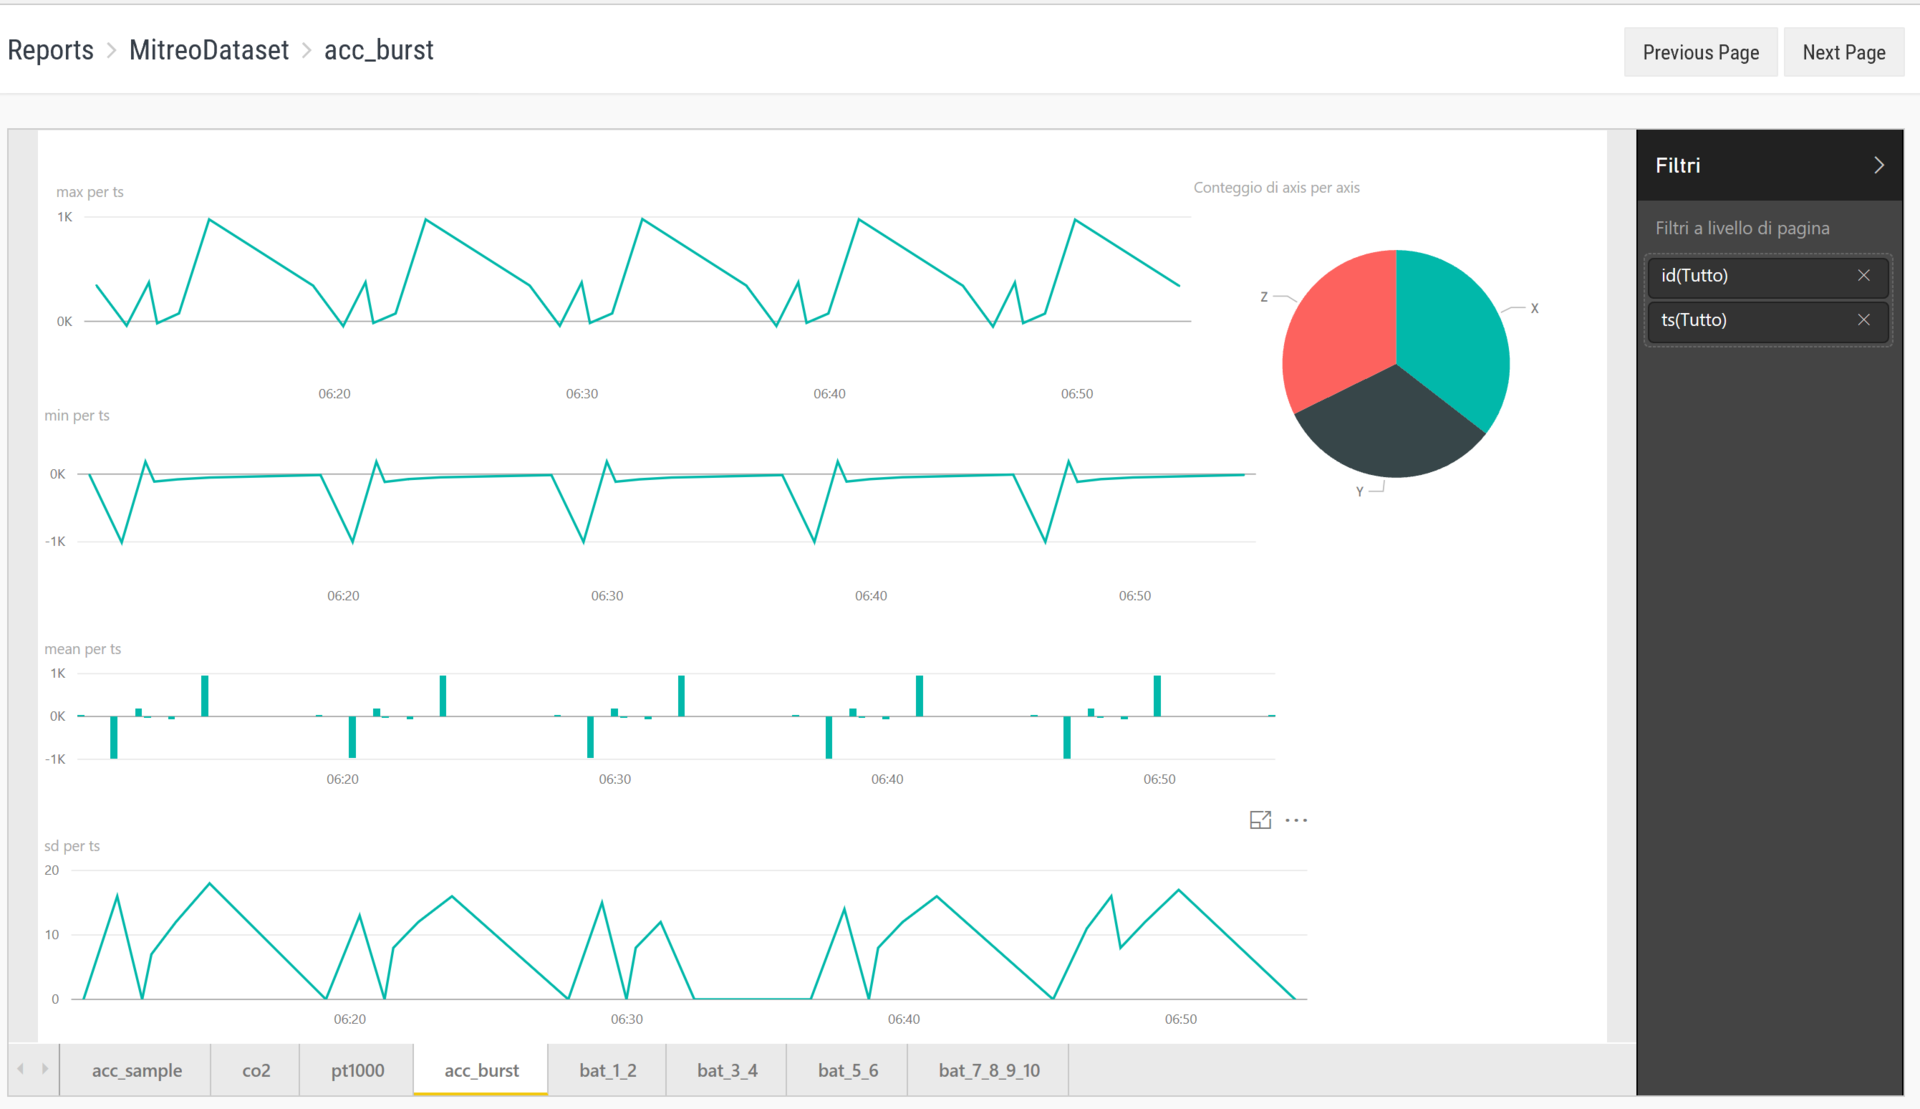
Data Visualization with PowerBI Embedded
We were able to develop a comprehensive solution for the Internet of Things to receive data from an important archaeological site and remotely track its condition. Of course, this is of great importance for scientists. Now they will have access to the right information from anywhere.
In addition, the implemented architecture can be easily scaled and transported. Experts from the Technical University of Milan wanted to figure out how to use these technologies and adapt the solution to other projects. Working together has allowed us to achieve these goals.
Data visualization is very simple and straightforward. Researchers can use it to obtain information about the state of an archaeological site.
A comprehensive solution for remote monitoring of the mitreum in the Great Circus has been successfully implemented. The project team has acquired all the skills necessary to create it. Over the next few months, researchers will test and evaluate the effectiveness of the system in order to understand how to improve it, given the specific needs that they face.
Moreover, the PoliMi team has gained skills with the Azure platform and can easily recreate a similar architecture for various remote monitoring projects related to other archaeological sites.
We remind you that you can try Microsoft Azure for free here .
GitHub repository for C # console application running on the field gateway
Information about mitreum in the Great Circus on Sovrintendenza Capitolina
On March 30, 2017, Microsoft will host the online conference “Business.IoT: Discovering the Internet of Things” . The program will have two parallel tracks (business and technology) with best practices and recommendations from leading experts in the field of Internet of things, machine learning and predictive analytics.
Among the speakers will be: Mikhail Chernomordikov (Microsoft), Sergey Osipov (MAYKOR-GMCS), Dmitry Bergelson (GuaranaCam), Anna Kulashova (Microsoft), Dmitry Marchenko (Microsoft), Andrei Meluzov (KORUS Consulting) and Vasily Yesipov ( KPMG).
To participate, you must register here .
Cycle of Microsoft Technical Case Studies
1. Power BI Embedded, IoT and machine learning for processing brain thermograms .
2. As in Canada, looking for missing children .
3. Internet of things in archeology .
4. Loading ...
Introduction
This project refers to the study of an important archaeological monument of Rome - Mitreum, located under the stands of the Great Circus. The work was carried out in conjunction with the Technical University of Milan (PoliMi) - the University of Science and Technology, which graduates engineers, architects and industrial designers. In addition to the university, the city department of cultural heritage (Sovrintendenza Capitolina) and the University of Trieste also participated in the work.
')
We collected the readings of sensors installed inside the mitreum to remotely monitor the carbon dioxide concentration, vibration level, temperature and humidity.
Mithrum has been preserved in good condition to this day. It was first discovered in the 1930s during the restoration of the Rome Opera House. The building dates from the II century BC. e. She probably rebuilt many times. In the III century BC. e. its lower floor was set aside under the sanctuary - mitreum.
Mitreum in the Great Circus (Rome)
The following IoT devices and technologies were used in the project:
- Special sensors installed in the mitreum: accelerometer (on the device), thermometer (MCP9700A), hygrometer (808H5V5), carbon dioxide sensor (TGS4161), soil thermometer (PT1000) and photoresistor (VT43N2).
- Libelium Waspmotes as a computational module for sensors.
- Raspberry Pi 2 running Raspbian OS with Mono software and a C # console application as a field gateway.
- 802.15.4 for low speed wireless networks for sensor and gateway communications.
- Azure IoT Hub for receiving data: one message every 30 minutes.
- Azure Stream Analytics for data transfer to the database and Power BI.
- SQL Azure database for data storage.
- Power BI Embedded.
- Publicly accessible data visualization in Azure App Service.
Formulation of the problem
The main task of this project is remote monitoring of the current state of mitreum with the help of special sensors installed inside this architectural monument. Among them are accelerometers, carbon dioxide sensors, temperature and humidity. The data is transmitted to the field gateway, and then to the cloud infrastructure for the purpose of publishing it in visual form on a regular web page.
Visualization of data on the website
For PoliMi, the monitoring of mitreum was the first project on the way to creating a reference system for collecting data from archaeological sites. In the future, it will use different types of sensors, gateways and a single cloud architecture built for this project, so this project used IoT technologies potentially useful for the following developments.
The main goals of this project are:
- Find a scalable solution that can be applied at different archaeological sites.
- Integrate cloud infrastructure with gateways and sensors installed locally. Solve interoperability issues that have arisen in this project.
- Find a solution so that any user can see the monitoring data from anywhere.
Sensors and Gateway
First of all, we held several Skype meetings to more accurately define the tasks and understand the current state of the project. When we started creating cloud architecture, the PoliMi staff had already chosen the sensors and installed them in the mitreum.
The location of the sensors in the mitreum
At regular intervals (depending on the selected frequency in milliseconds), the sensors send small data sets to the field gateway, where they are processed locally. As can be seen from the table below, the size of each message is quite small, so every 30 minutes the data is grouped into a single file in the .txt format containing all the sensor readings. The C # console application processes the resulting file, after which the structured data is sent to the Azure IoT Hub.
Characteristics of sensors in mitreum
Based on this data, we were able to calculate the monthly cost of the entire cloud infrastructure prior to its deployment, using the Azure price calculator. This initiative, highly appreciated by the client, allowed to continue work on the project. Of course, other advantages also played a role: easy deployment, scaling and transfer of the solution, project support by highly qualified Microsoft employees.
Cost calculation
Difficulties in project development
One of the most serious tasks in this project was the data analysis. It was necessary to separate the readings of all the sensors collected in a text file in order to create the correct message to be sent to the IoT Hub. In solving this problem, we were very helped by the specialists of the PoliMi University. Having clearly understood and defined the message structure, we were able to visualize the data correctly.
Another major challenge was the integration of cloud infrastructure with sensors and a gateway.
We worked together with the client, using various forms of communication: several conferences in Skype, personal meetings, remote development and discussion. In total, we spent about 10 full working days on all stages of the project, including design, development and testing. During this time we organized the implementation of the system and created a comprehensive solution.
Full-time meeting with Kostab and Luka
Solution and its stages
As described above, four kinds of sensors send data to the field gateway at the frequency indicated on the solution diagram below.
The network gateway connects to the Azure IoT Hub and sends approximately 1 KB of data every 30 minutes. We chose MQTT as the protocol, since it is widely distributed and convenient for use with the models of the nodes of this project.
Azure Stream Analytics processes the data stream and sends the measurement results to the appropriate SQL database table.
The web application publishes Power BI reports so that end users (PoliMi specialists) get visualized data.
Project Architecture
Data for analysis
10 Libelium Waspmote sensors were used for data collection. Their type was chosen by archaeologists and staff responsible for the restoration of the object. Libelium sensor models for the Waspmote computing device were used, including:
- Accelerometer
- Thermometer
- Hygrometer
- Carbon dioxide sensor
- Photoresistor (VT43N2)
- Soil Thermometer (PT1000)
The readings are transmitted to the device Raspbery Pi 2, running under the operating system Raspbian and acting as a field gateway.
The choice of OS was determined by the preferences of the client, who had extensive experience with the Raspbian OS and almost did not use Windows 10 IoT Basic and other operating systems. The device processes the data received from the sensors. For example, for values collected from nodes 3 and 4 (accelerometers), a fast Fourier transform (FFT) is performed, which is added to the message sent to the cloud.
A Python application running on the gateway generates a text file with all the data collected every 30 minutes. The choice of Python programming language was for Kostab Dolui the best way to minimize efforts and simplify the replication of the solution on various platforms in the future. This file will be used to send data to the IoT Hub. The image below is a sample .txt file with raw data that will be parsed by the C # console application on the field gateway.
Raw file text file
Preliminary processing
To send the required data, you need to convert a text file in a console application running on the field gateway. At this stage, there was a question about the choice of the development language of the console application. IoT Hub SDK is available for both Python and C #. Having discussed both options with the client, we decided to develop an application in C #, because we knew the language better. We then installed the Mono software on the Raspberry Pi device to run the application.
This application creates a JSON array of measurements ready for sending to IoT Hub containing the readings of all sensors extracted from a text file. During the final testing, we used a very large file in the .txt format and found some problems with the size of the messages sent to the IoT Hub.
If the size of the text file is more than 256 KB, then it should be divided into small files. This requirement arose due to the IoT Hub restrictions on the maximum size of the data packet transmitted from the device to the cloud.
Text parsing scheme
Creating a means of parsing the indications of nodes 3 and 4 was complicated by the nature of the data being sent. They had to send the following information to the field gateway: time stamp, node ID, battery charge level, coordinates, packet number and a set of 20 numbers that are part of the FFT. Data transmission from a single sensor for specific coordinates consists of seven packets with time stamps within 70 milliseconds. We had to identify these packets and create one row in the table, including all the FFT values of the seven packets (represented as a JSON array and stored together as a string).
Telemetry transmission
As mentioned earlier, due to the connection features, first of all we had to process a text file containing sensor readings. Real-time monitoring was not the goal of this project, so the resulting model functions with a slight delay. In the end, we decided not to abandon the text file created by the field gateway, because it can be useful to the client as a log file. We also continued to use the developed parser.
The Raspberry Pi works as an opaque field gateway, so we registered the C # console application as a unique device for IoT Hub. This means that no matter how many sensors we connect to it, the gateway will perform all the necessary manipulations, aggregate the data and create a message to send to the IoT Hub. In addition, this approach will allow re-use of the developed architecture for other archaeological objects and create a scalable and easily portable solution.
Security
Azure IoT Hub allows you to register each device with a name and a symmetric key. This means that each device gets its own connection string.
If it is hacked, the corresponding device can be turned off by stopping the exchange of data with it using the control panel on the Azure portal.
IoT Hub provides a ready-made effective solution for the protection of transmitted data. Before the start of the project, no security requirements were presented, but this feature was widely accepted by the client.
Storing Telemetry with Stream Analytics
The data transferred to Azure IoT Hub, are subject to storage and visualization. After discussion with the client, we decided to create a database with four different tables, one for each type of sensor. We chose a SQL database, as it is possible to directly request data from it in PowerBI Embedded.
Azure Stream Analytics is then configured with one incoming stream and four outgoing data streams, as can be seen in the screenshot below.
Azure Stream Analytics
The query consists of four operators that send telemetry data to the corresponding SQL database table. For example:
SELECT dateadd(s, ts, '1970-01-01') as ts, id, bat, ax, ay, az, te, hu, lt INTO [accsample] FROM [IoTHub] WHERE id=1 OR id=2 As you can see, the
dateadd function dateadd used to convert time from a UNIX format to a readable form. The rest of the expression reads the data from the stream and saves it in the output mapping table accsample .Data visualization
The final stage of the project is visualization. To simplify data analysis, we decided to embed a Power BI report into an ASP.NET web application. Due to this, we managed to realize two important goals of this project: to display data on diagrams that the client can easily personalize, and, most importantly, open public access to sensor readings.
Charts, graphs and data filters, available in a web application, were created in close cooperation with the client, so that the result corresponded to the expectations: various tabs for various sensors, filters, and so on.
Another example of specific requirements: filtering data by timestamp for each device.
Data Visualization with PowerBI Embedded
Conclusion
We were able to develop a comprehensive solution for the Internet of Things to receive data from an important archaeological site and remotely track its condition. Of course, this is of great importance for scientists. Now they will have access to the right information from anywhere.
In addition, the implemented architecture can be easily scaled and transported. Experts from the Technical University of Milan wanted to figure out how to use these technologies and adapt the solution to other projects. Working together has allowed us to achieve these goals.
Data visualization is very simple and straightforward. Researchers can use it to obtain information about the state of an archaeological site.
Perspectives
A comprehensive solution for remote monitoring of the mitreum in the Great Circus has been successfully implemented. The project team has acquired all the skills necessary to create it. Over the next few months, researchers will test and evaluate the effectiveness of the system in order to understand how to improve it, given the specific needs that they face.
Moreover, the PoliMi team has gained skills with the Azure platform and can easily recreate a similar architecture for various remote monitoring projects related to other archaeological sites.
We remind you that you can try Microsoft Azure for free here .
Additional resources
GitHub repository for C # console application running on the field gateway
Information about mitreum in the Great Circus on Sovrintendenza Capitolina
Business.IoT: discovering the Internet of Things
On March 30, 2017, Microsoft will host the online conference “Business.IoT: Discovering the Internet of Things” . The program will have two parallel tracks (business and technology) with best practices and recommendations from leading experts in the field of Internet of things, machine learning and predictive analytics.
Among the speakers will be: Mikhail Chernomordikov (Microsoft), Sergey Osipov (MAYKOR-GMCS), Dmitry Bergelson (GuaranaCam), Anna Kulashova (Microsoft), Dmitry Marchenko (Microsoft), Andrei Meluzov (KORUS Consulting) and Vasily Yesipov ( KPMG).
To participate, you must register here .
Source: https://habr.com/ru/post/323762/
All Articles