Choosing the right imaging method according to the IBCS standard
Each report you make must carry along with its contents a specific purpose and message for which it is being developed. One of the bad examples of organizing the presentation of data in a report is the so-called “sheets”: large reports consisting of dozens of columns and combining many heterogeneous indicators, including hundreds of data lines. It is believed that such reports show a detailed picture of the “whole”, but in fact they are an extremely non-informative tool.
In this article, I will not consider this kind of reports and a similar approach to organizing data, leaving it on the conscience of "IT-Kamikaze", ready to sacrifice a part of their irretrievable wasted and valuable time for the preparation and cleaning of such reports.
Instead, we will look at a sample report that can often be seen in the hands of management. It can be stated that report design specialists often do not think about how a manager will analyze, compare, compare data and what kind of development there may be, and more often there may not be a wrong approach to visualizing critical information.
Consider the example shown in the figure below.

')
This way of visualization of business information is intended to give an understanding to the management of the company about the distribution of revenues by areas.
At first glance, a completely understandable and readable presentation, which visually shows that the revenue of the “Development” direction in 2016 was the largest compared to the other areas. But let us ask ourselves: how, with such an approach, should we convey some meaningful message? Not a simple statement of the fact of revenue, but something more significant, something that you need to pay attention to? How to use a pie chart to display more than just the weight of each piece of cake? How in such a view can you organize, for example, a comparison of the actual result with the planned indicators that were set for the company as a goal five years in advance or to see the dynamics of changes in indicators for four years ago? Perhaps there is a way how to detail 2016 in such a circular representation and decipher the numbers that are visible in the diagram?
If you do not solve the problem simply to “quickly show some numbers,” and look at the perspective a bit, then the pie chart should be taboo for you. is the most uninformative and useless way to visualize data.
The rule that should be used if you want to use a pie chart is very simple: never use pie charts .
Let us consider an option in which our approach to visualization using the notation of the IBCS standard will not only be a visualization of a permanent event, but will, first of all, carry the information message for business in graphic form. For this, the first thing that needs to be done is to move from a circular view of information to a columnar one.
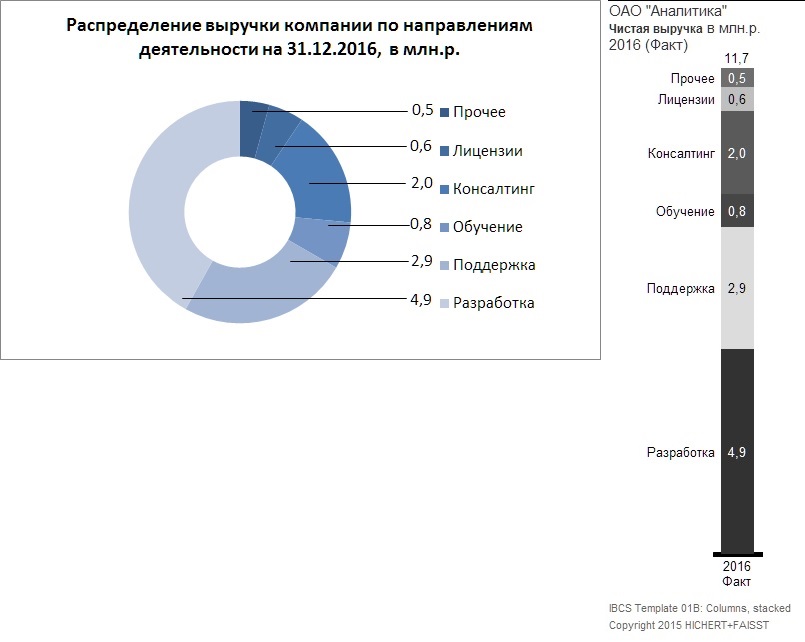
Very simple step, but the data is already read much better and the visualization becomes clear. The graphic has a title that speaks about the dimension of the data presentation and the volume of which company’s data is visualized on it; the weight of each direction is visible both in numerical terms and in the proportional ratio of each group; There is information about the period of the data, the total value of all units.
In addition to the title of the report, we add an informational message that we want to convey to the company’s management, providing this report for analysis. For example, we draw attention to the fact that the revenue in the direction of "Development" in 2016 amounted to 4.9 million rubles.

The column view allows you to easily enter a new information level and show what percentage of the total revenue of the entire company.

Dry, bare figures are good, but anticipating the interest of the management, we can add information on the history of the past several years, as well as expanding the information message of the report. (In parallel, we ask ourselves how we would solve a similar problem for a pie chart ...)
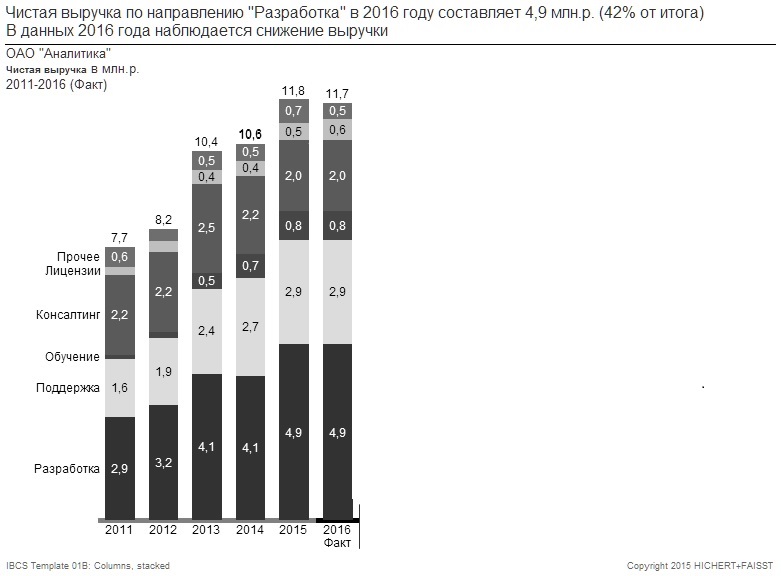
Enough informative and visually clear in order to draw the closest attention to the situation and deal with its correction.
Let us add to the already presented information a forecast up to 2020, which we single out in the report with an additional comparison in order to show the criticality of the emerging trend. In IBCS notation, this does not cause much difficulty.

Try to imagine how you would solve a similar problem on a pie chart? If necessary, you can further expand the report model with data that details the current year with information necessary for making management decisions.
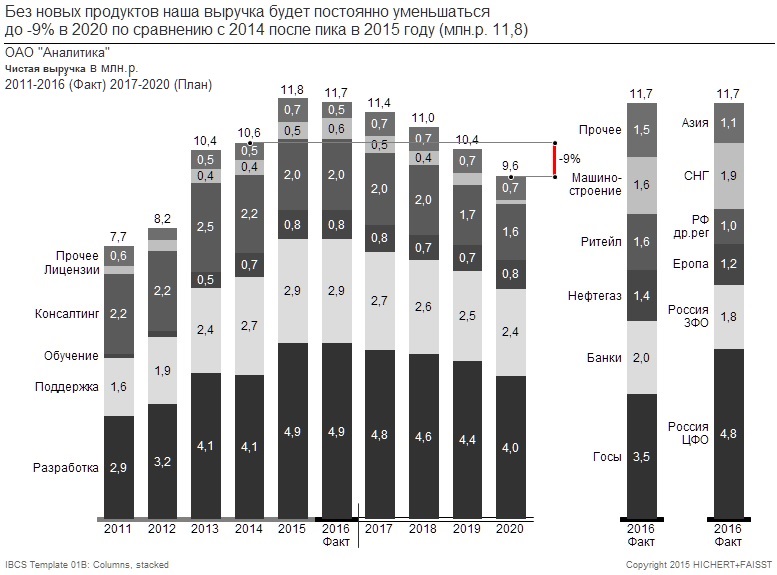
The amount and method of information provided in this way carries not only an abstract statement of some accomplished fact, but also encourages those responsible to pay close attention to the situation and begin to make strategic decisions to correct the situation.
Let's compare how it all began and what we came up with using semantic notation of the IBCS BI standard.

In parallel, we found the answer to the main question: no, not the answer to the main question of life, the universe and all that ... and this is not 42 ... we found the answer to the question of what the analyst’s job is and what he should give to management for analysis and decision making.
Regards, your uncle Nucl
Based on IBCS version 1.0
2017 IBCS Association with adaptions by Ilya Mukovoz. Licensed under Creative Commons BY-SA 4.0 International.
In this article, I will not consider this kind of reports and a similar approach to organizing data, leaving it on the conscience of "IT-Kamikaze", ready to sacrifice a part of their irretrievable wasted and valuable time for the preparation and cleaning of such reports.
Instead, we will look at a sample report that can often be seen in the hands of management. It can be stated that report design specialists often do not think about how a manager will analyze, compare, compare data and what kind of development there may be, and more often there may not be a wrong approach to visualizing critical information.
Consider the example shown in the figure below.
')
This way of visualization of business information is intended to give an understanding to the management of the company about the distribution of revenues by areas.
At first glance, a completely understandable and readable presentation, which visually shows that the revenue of the “Development” direction in 2016 was the largest compared to the other areas. But let us ask ourselves: how, with such an approach, should we convey some meaningful message? Not a simple statement of the fact of revenue, but something more significant, something that you need to pay attention to? How to use a pie chart to display more than just the weight of each piece of cake? How in such a view can you organize, for example, a comparison of the actual result with the planned indicators that were set for the company as a goal five years in advance or to see the dynamics of changes in indicators for four years ago? Perhaps there is a way how to detail 2016 in such a circular representation and decipher the numbers that are visible in the diagram?
If you do not solve the problem simply to “quickly show some numbers,” and look at the perspective a bit, then the pie chart should be taboo for you. is the most uninformative and useless way to visualize data.
The rule that should be used if you want to use a pie chart is very simple: never use pie charts .
Let us consider an option in which our approach to visualization using the notation of the IBCS standard will not only be a visualization of a permanent event, but will, first of all, carry the information message for business in graphic form. For this, the first thing that needs to be done is to move from a circular view of information to a columnar one.
Very simple step, but the data is already read much better and the visualization becomes clear. The graphic has a title that speaks about the dimension of the data presentation and the volume of which company’s data is visualized on it; the weight of each direction is visible both in numerical terms and in the proportional ratio of each group; There is information about the period of the data, the total value of all units.
In addition to the title of the report, we add an informational message that we want to convey to the company’s management, providing this report for analysis. For example, we draw attention to the fact that the revenue in the direction of "Development" in 2016 amounted to 4.9 million rubles.
The column view allows you to easily enter a new information level and show what percentage of the total revenue of the entire company.
Dry, bare figures are good, but anticipating the interest of the management, we can add information on the history of the past several years, as well as expanding the information message of the report. (In parallel, we ask ourselves how we would solve a similar problem for a pie chart ...)
Enough informative and visually clear in order to draw the closest attention to the situation and deal with its correction.
Let us add to the already presented information a forecast up to 2020, which we single out in the report with an additional comparison in order to show the criticality of the emerging trend. In IBCS notation, this does not cause much difficulty.
Try to imagine how you would solve a similar problem on a pie chart? If necessary, you can further expand the report model with data that details the current year with information necessary for making management decisions.
The amount and method of information provided in this way carries not only an abstract statement of some accomplished fact, but also encourages those responsible to pay close attention to the situation and begin to make strategic decisions to correct the situation.
Let's compare how it all began and what we came up with using semantic notation of the IBCS BI standard.
In parallel, we found the answer to the main question: no, not the answer to the main question of life, the universe and all that ... and this is not 42 ... we found the answer to the question of what the analyst’s job is and what he should give to management for analysis and decision making.
Regards, your uncle Nucl
Based on IBCS version 1.0
2017 IBCS Association with adaptions by Ilya Mukovoz. Licensed under Creative Commons BY-SA 4.0 International.
Source: https://habr.com/ru/post/323734/
All Articles