How to make a high-loaded service without knowing the amount of load
At the HighLoad ++ 2016 conference, Oleg Obleukhov spoke about the architecture that does not require administrative intervention, which he planned and implemented in InnoGames.
Hello. Just a few words about me. My name is Oleg, before that I worked at Yandex, I lived in the wonderful city of St. Petersburg. Now I have moved to Germany and work at InnoGames. The company is engaged in the development of online games. On account of 150 million users - a large enough company, well, smaller than Yandex, of course. And today we will talk with you about how to make a high-loaded service without load data, without knowing its quantity.
')
Before we begin. Now you know everything about me, I would like to know a little about the audience. Raise the hand of those who use Docker on production? Well, about a third of the room is good. And now from those who raised their hands, raise those who are satisfied with the use of Docker in production? Significantly less. And now even more difficult question. Those who are satisfied with the use of Docker on the production, raise your hand, those who are a sysadmin or engineer, or someone else non-developer. I see three. Okay.
In fact, we won't talk about Docker today. But we will talk about CRM. I will tell you what it is, why we need this system.

As you can see on the screen, this is a screenshot of one of our most popular games - Forge of Empires, maybe, who even heard. It looks like this. When a player plays Forge of Empires, any actions of this player (for example, “build a building” or simply “click on payment” for some extra money, local currency) are sent to our vault. All these actions are recorded. For some time in our repository (this Hadoop, of course) accumulated about 400 billion of such events, all clicks of all users. This is a disk equivalent of 25 terabytes, not counting the replica factors and everything else.
Why do we need this data? We can build patterns of user behavior from this data. We have a special group of managers who are engaged in nothing else, as they announce to which users with which behavior we are issuing some kind of discount today. This is the so-called Near-Time campaign, or indoor advertising.

It looks something like this. You can see that, for example, if you close the payment window, you will immediately receive a banner “in general, pay now, and you will receive 40% more local currency”. Of course, there are other patterns of behavior. For example, if a user behaves as if he leaves the game soon: he comes in less frequently, performs fewer actions in the game. Losing users is bad: often enough, we pay to ensure that users come. We need to keep these users.
Why do you need this system? Why not just let users play and let them pay when they want?
Well, of course, for the money. This service works not so long ago, about a year. We statistically confirmed that the income increased two or even times more simply because we show the user: “Hey, comrade, pay, we'll just give you more diamonds if you do!” the user is more willing to pay.
Well and the second, very pleasant property is that we detain users in game. That is, if the user behaves as if he wants to leave the game, we tell him: “No, no, no, stay, we will give you bonuses for free. Maybe not even at a discount, but completely free. Please, just stay here! ”Of course, every user is very important to us.
Well, a very, very important feature is the attraction of new players. If the user is satisfied, he is so happy, got his discount, or generally free diamonds, he will say: “Play Forge of Empires. It's so great, you can get free diamonds there. Only you need to perform certain actions, then it will be. "
As I mentioned, about a year ago I received the task of building the architecture of this service. At that time for me it was a black box. I was simply told: "Oleg, we have three of our most popular games." We had more, but these are the most popular - Forge of Empires, Elvenar and Grepolis. All these games already sent events to Hadoop at that time, these are your very clicks, if anyone plays. In general, all these clicks fall into Hadoop and there are approximately 500 million of them per day. This is a rather big amount.
So, it was necessary to write some kind of system, form it, create an architecture that would pull out these events, somehow filter them, look, supplement and send it to the game to give the user a discount.

It looks like this.
One of the most important criteria is that we have to deliver this message, this discount, as quickly as possible. For example, the user closed the payment window, he is still warm, he thinks more: “Oh, I wanted to buy, but something expensive”. And we bang him - discount. Great? Great! This was one of the criteria.
What questions did I have as an engineer when I was told that I needed to make this system?
- What should be the architecture of this system? Because the code was not, nothing was, did not exist. We thought with the developers how to do it all.
- Should there be reliability? That is, the speed of delivery is very important. But if it breaks on Saturday night, do you need to run to fix it? Or you can leave it all until Monday and sleep well, do not worry?
- And the most important question: how much load should this system take? As you remember, we have a constant flow of events - 500 million a day. But how many of them should we take on ourselves and process, pass through our system and issue to games?
Architecture
Let's dive a bit into the architecture of the service we've got.
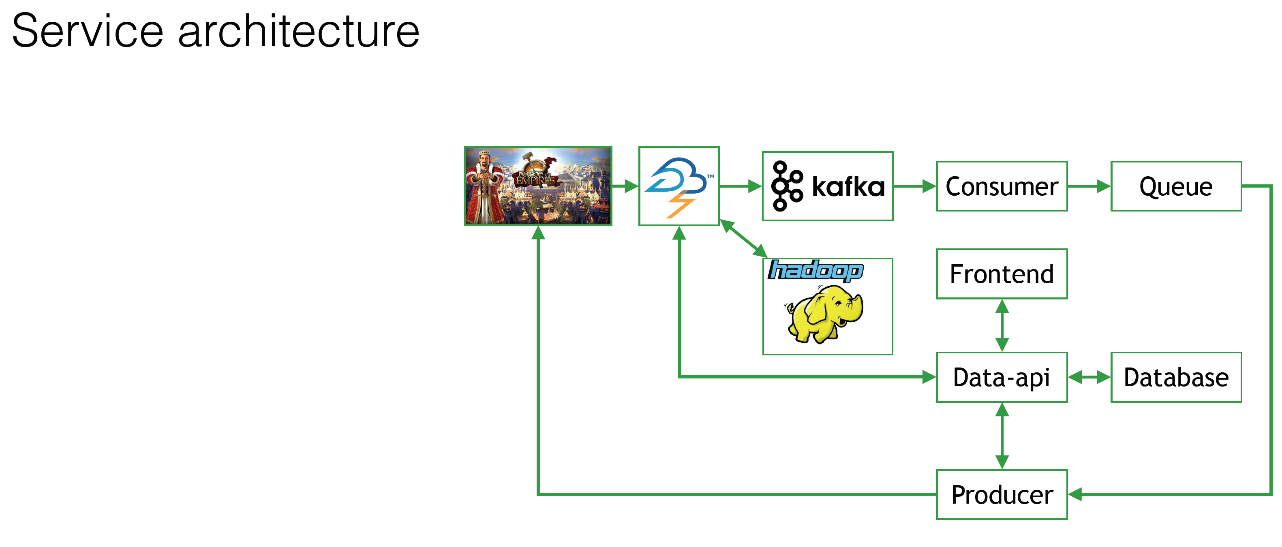
The small logo that is not very clearly visible is Forge of Empires, one of our most popular games. This game and a few others are filing all the 500 million events in the Apache Storm. Many of you know what it is - I will not explain.
On CRM, on our side, there is the so-called Frontend, in which those same managers sit and say: “But let's give us today to everyone who has played a discount for at least 30 minutes? Just because we are so kind. ” They work with this frontend. The database records all the data that with such a template, such a discount, the banner will look like this. All this is stored in the database. That is, you need some kind of database.
Those data that will be filtered out, which are interesting to us, will get from Apache Storm to Kafka on our side, into our system. Of course, all this, without exception, flies into Hadoop. Just to be, as they say. So that we can then use this data.
Then, on the side of our service, there is a so-called consumer (Consumer), which reads this data from Kafka and somehow filters it, maybe complements it, somehow generalizes, looks at behavior and stuffs everything into the queue. It is all made for reliability. Next we have a Producer who checks the database, complements events, adds banners there, removes something from there and sends it all to the games.

What do we see even in this picture?
- We use microservices. We actually have many, many small components. They are not all represented here, but this is a general picture, so that it is understandable.
- The load grows consistently. Today, the manager is in a good mood, and he says: “But let’s give all users a discount at all? To everyone who is online, to all several millions, to tens of millions of users, who is playing right now, we will give them a discount? ”Naturally, from Apache Storm we will increase the flow of data to Kafka, and from Kafka this will go to the side of our system, further for each and every component of our system, the load will greatly increase.
If all 500 million events come to us, we will have everything super-heavily loaded. The manager is in a bad mood, and he says: “I don’t want to give anyone a discount today, I’ve all gotten into trouble”. There will be no load, respectively, the server will do nothing at all. - Components must be super-reliable. If, for example, in the middle of the night the consumer from Kafka breaks, then it will all stop, Kafka will overflow, we will lose a lot of data. In general, it will be very sad, then we will have to restore all this with our hands.
- Well, what is the actual number of components should be? Good question, yes? Because it is not clear at what point at which component a greater amount of load will come.
Who had the idea in the hall, why not start up 100 virtual machines and keep them running all the time? Just in case of life, if the load comes - we will swallow them all, if not - they will stand and do nothing. Does anyone have such an idea? Because it is actually a sensible idea. Here is one sensible person sitting.
As I mentioned, the company is located in Germany. Maybe this is not so important for Russia, but we pay for electricity. We have our own data center. If you make measurements, you will see that any virtual machine, empty, without any payload that does absolutely nothing, consumes 12 watts of electricity. Just because it is running. This is one measurement graph. I made a bunch of them - take my word for it.
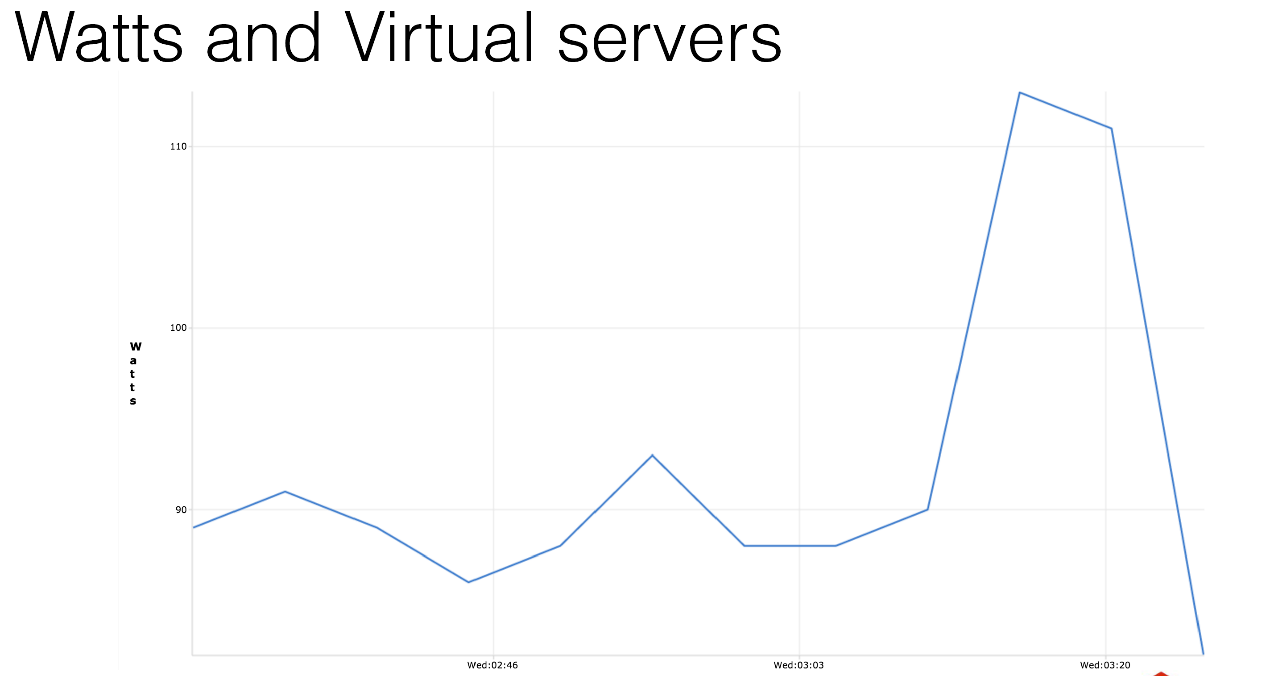
Do you need it? You run 100 virtual servers, they will work for you and consume a hundred euros a month just for the fact that they do nothing, nothing at all. Or maybe you have a bigger system? 1000 servers, it will look like this.

We simply warm the air in the data center. Why do we need it, right?
What can we do here? How to get out of this situation? Right! We use autoscaling! Why not?
When the system does nothing (for example, our managers have decided that they are harmful today and will not give anyone any discounts), we support only the minimum necessary high availability. We have two components running, all in a minimum.
Many companies do this. I'm not talking about the fact that there is an Amazon solution for this and so on. Even Facebook does that. They recently published an article about how they physically turn off hard drives, for example. Many companies are trying in this way to save on electricity or simply on resources, so as not to burn the server into an empty one.
If we need, if the load comes, why don't we run a couple of additional instances, these are the components? We just launch the event consumer from Kafka, and everything will be fine. And if that's not enough: we launched a bunch of components, but we don’t have enough virtual machines? Let's add virtual machines, what the problem is - this is also not very difficult.
Well, as a nice bonus. System administrators and engineers will understand me - the system treats itself. If for some reason all the components of one of the species have died, the system will start these components; if necessary, start the server. Save you from a sleepless night, maybe a quarrel with your wife or other problems that may arise from working at night.
Origins
To understand how our autoscaling works, you need to turn to the sources and understand what we had at that time.
We had (and now have) three data centers. We have thousands of virtual machines and hundreds of hypervisor machines. We mainly use them for virtual machines. We have just completed the migration from Xen to KVM, mostly due to live migration.
We are a fairly modern company. We are testing different cloud solutions. Looking ahead, I will say that they are all much more expensive than using their own data centers. I’m keeping quiet about the fact that if autoscaling breaks down and 1000 virtual machines run on Amazon, you’ll go broke and no CRM discounts will help you.
We use Docker, even use it on production. But I didn’t raise my hand, I’m not very happy with it. For the most part, it did not suit us, it does not have a live migration. Why do I need it, I will tell you later.
At that time we already had our cloud solution. In fact, nothing special, just written in Python web interface, then talk about it.
We use fairly primitive Open Source solutions: Graphite, Puppet, Nagios - well-known things. But we have one zest: our colleague written in Python is a system administrator named BrassMonkey.
So, we need to somehow balance the load on all our services. You remember that we have a bunch of components, there may be another 10 thousand new ones. And we still have to actively balance the load on them. If we raised a new one, we balance it on it instantly.
As you can see, we have several hosts, each of them has a certain number of microservices running, and for each of these microservices we have a public IP address on the loopback interface.
We load balance with FreeBSD and packet filter. Firewall, relatively speaking, is able to balance the load. It works quite simply. We have our hardware load balancer, on it virtual load balancer with the same IP are lifted. From the Internet comes the load, and all this is safely sent to the server, to the components.
But what happens if service N wants to connect to service 1?
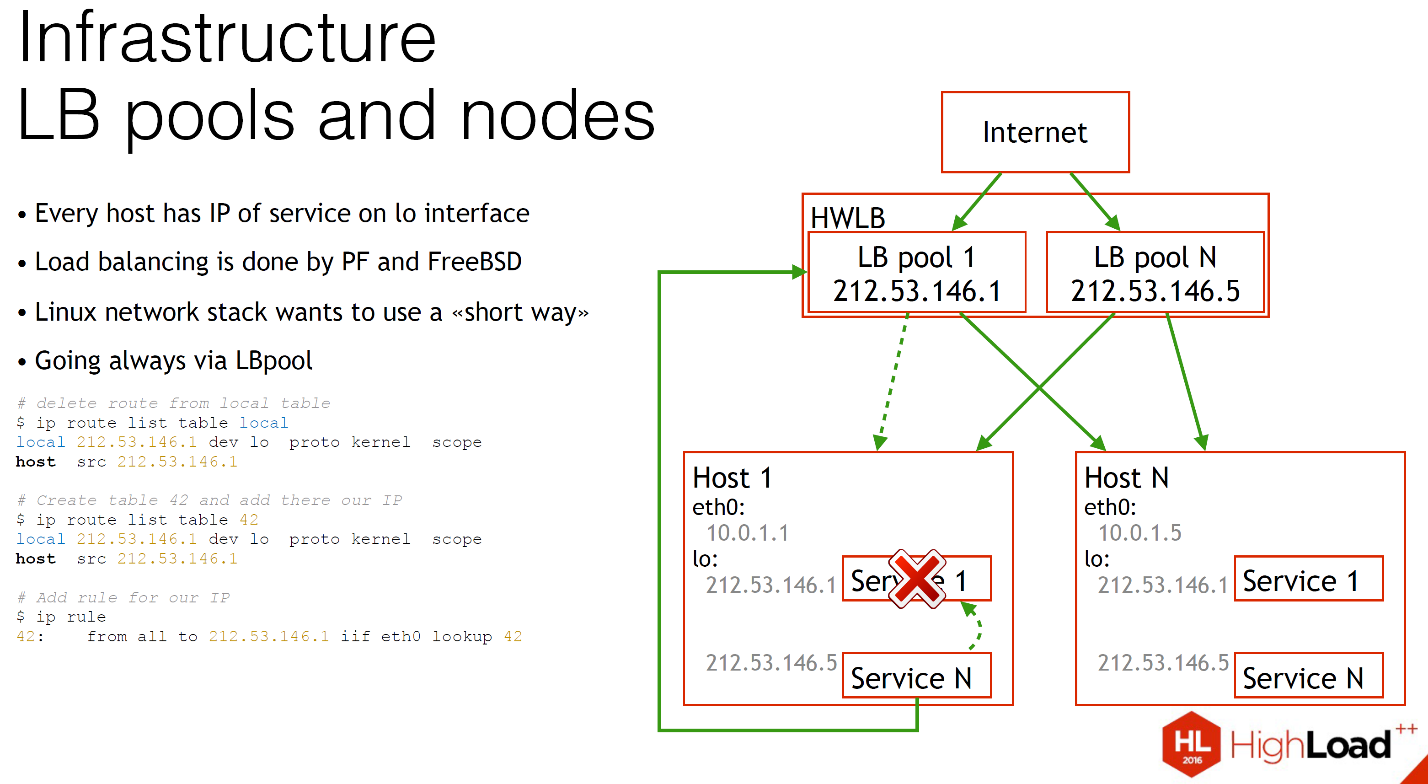
The slide shows: Linux will by default suggest you to use the shortest path, that is, directly, via the local network stack. What happens if service 1 dies? Of course, this connection will be broken. Service N will never know about it. Nothing will work, and you will not understand why until you get into the logs.
To solve this problem, we just did a little hack. We generally send all traffic that is related to this IP, always out. This slows down a bit, but the servers are in the same rack. In most cases, virtual machines run on the same hypervisors. It is not so difficult and scary.
It is very easy to make, no magic is needed. When you add any IP to a host, in Linux, by default, you add a route to the local routing table “to this IP, we always send traffic locally. This route just needs to be deleted and you add your table and say: “And you always go through the external interface”. And that's all. That's all it takes to send traffic out. You always had a health check, you always knew the condition of your service, and if something broke, it would always be easy for you to rebalance to another host. No problem.

We use this load balancing in our CRM, we have a lot of hosts, microservices are running on them. As you can see, on each host there does not have to be a complete set of all possible microservices. It may be completely different, some of them. And we have load balancers in front of them. All this is well balanced.
What happens if LB pool is compiled, load balancer is assembled above host H, where there is no microservice N? We will not balance the load there until it appears there. Everything is very simple and trivial. And if we want to connect directly, we will not connect, we will connect via load balancer, as we discussed above.
Load balancers are collected almost everywhere. We have a database about which we have already spoken. In this case, we use MariaDB, we have a Galera cluster, fully synchronous. It is very convenient for him to work with system administrators. There is no big load on it, let it work. The load on it is balanced in exactly the same way. We can at any moment throw out the host and add it back, if, for example, we need more load.
Components are connected directly through the load balancer. Exactly the same system we have assembled for the very queue that you saw. We use RabbitMQ.
Autoscaling
We are already prepared and we know absolutely everything about the architecture of CRM, let's talk about autoscaling.
We have a hypervisor, we have a lot of them, on each of them many virtual machines are running. We have many microservices running on each virtual host. We somehow need to retrieve data about CPU and memory usage.
We send them to Graphite. But since Graphite can be unreliable, sometimes you have to reboot it or do something else bad. You need autoscaling to work reliably enough, so you need to always get the metrics in Graphite, otherwise your system will go crazy. Passed, we know.
For this we need a special Grafsy client, you can find it on GitHub. This Grafsy sends all metrics to Graphite securely.
Let's talk about Graphite. We use Grafana, like everything else in this room - no one uses Graphite for nothing. Here are some interesting details about using Graphite.
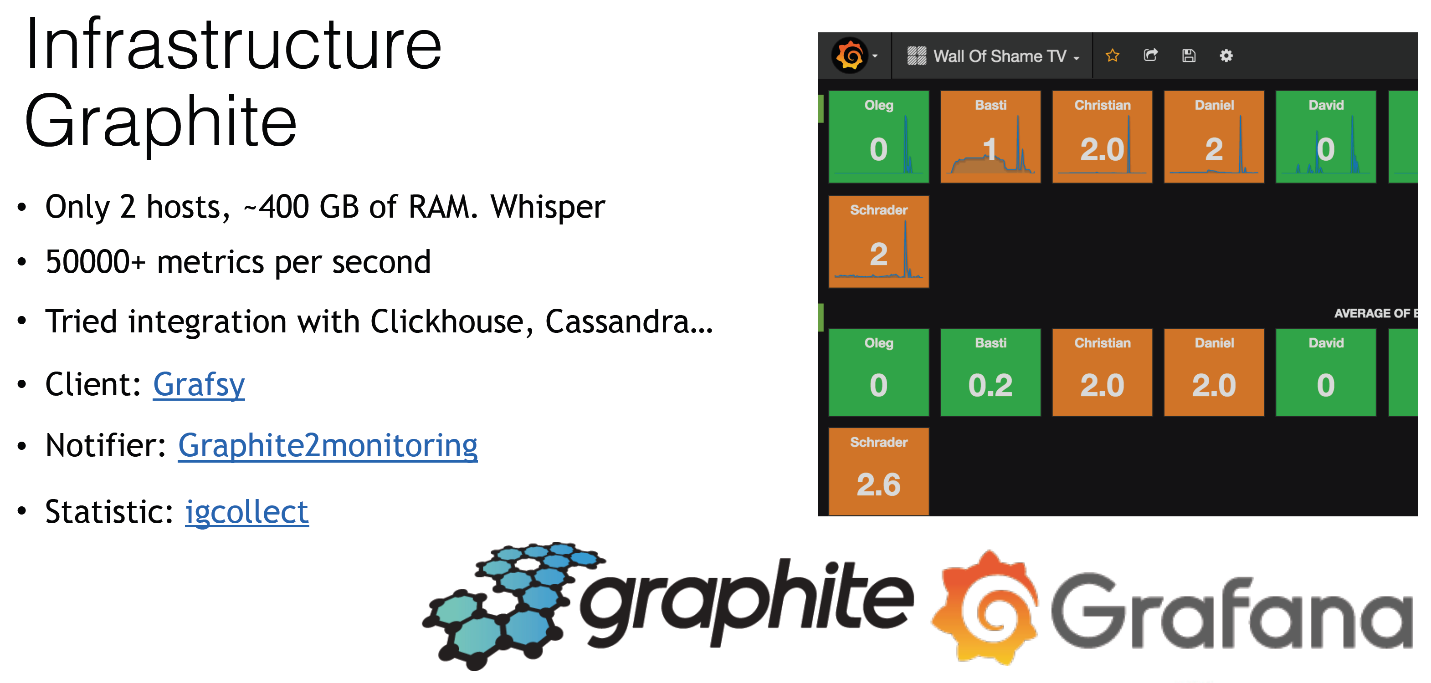
We use it as a wall of shame. Here we have every system administrator of our company. We show how many problems a person has in our monitoring system. It actually helps maintain cleanliness and order. We just send this data there, and everyone sees it. If that: "Hey, go fix it!"
If we talk about Graphite, we have only 2 hosts, but they are quite large. We have about 400 gigabytes of RAM on them. We use Whisper. Why whisper? Everyone knows that this is a fairly old file database. We use it because we have a large enough load on it. These are 50 thousand (or even more) metrics per second, which is quite a lot. We tried to migrate to ClickHouse or Cassandra, but this is not as cloudless as they say. It works about 2 times slower than Whisper.
We use the client Grafsy, which is running on each and every virtual host. He gets metrics in himself. If Graphite is unavailable for some reason, we will re-send all these metrics a little bit later. The essence of this client is very simple. It is very light - it takes literally 2 megabytes in memory - and it works on all servers. It has much more functionality. You can look at github .
We also use a special notifier, because in the Grafana web interface, they promise to do something, but have not done it yet. They promised us a long time ago that if something changes on the graphs in Grafana, we will be notified about it. But it is still not done. If our disk space increases, then we can only see it through checking in our monitoring, but not in Graphite. There is such a simple demon, even a script. He is also on github . He will notify you and your monitoring system. It is quite versatile, it can notify many different monitoring systems.
We collect statistics using IGCcollect. This IG is derived from InnoGames. It can also be found on github .
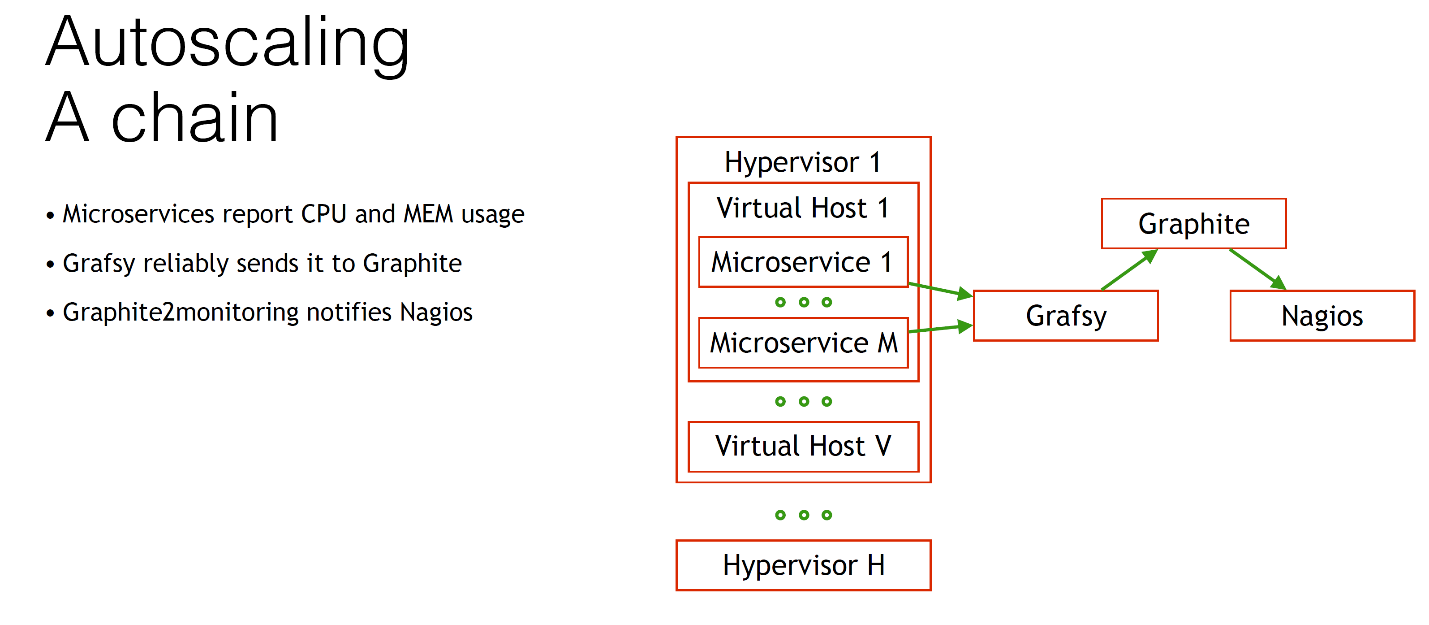
When all metrics arrive in Graphite, our Nagios is notified. If we increase the amount of CPU consumption, we notify Nagios with the help of that notifier.
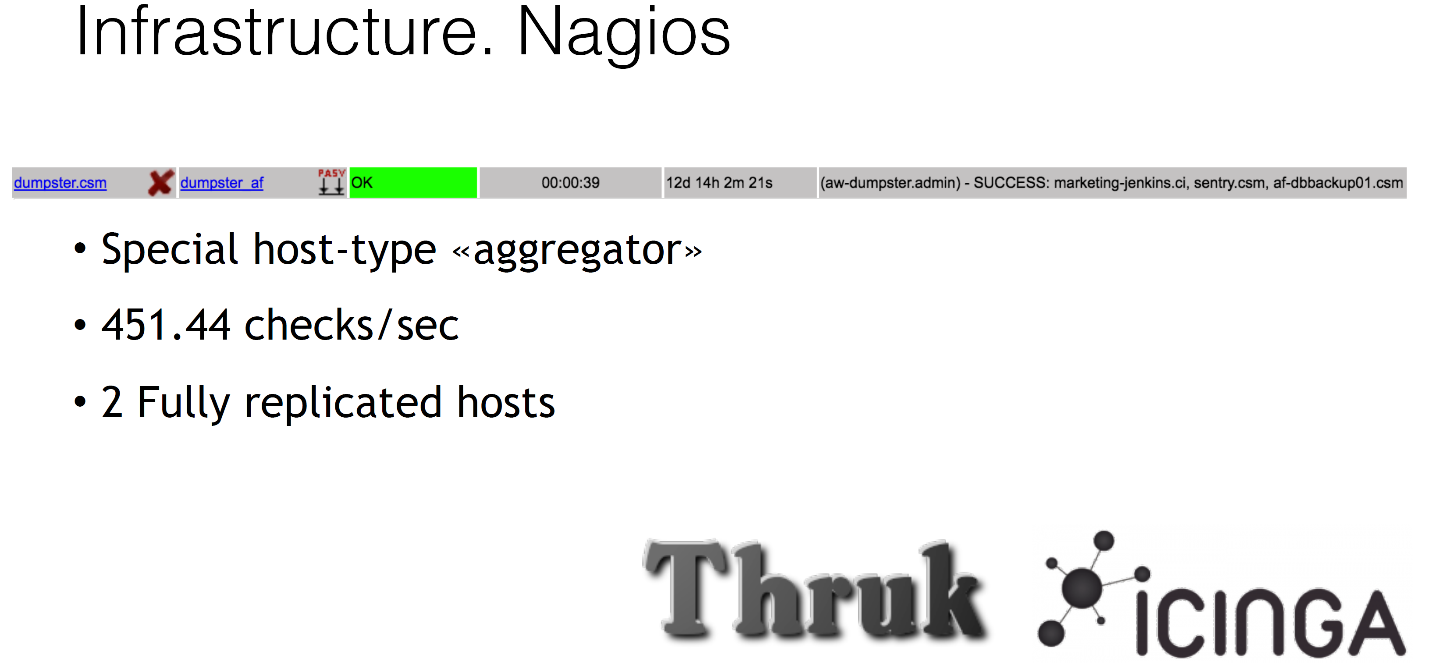
A few words about our Nagios. We all use Icinga and Thruk as a web interface. We also use Nagios for many interesting tasks, for example, fake hosts that actually have no IP addresses, nothing, they are just some kind of dummy fools. They are in our Nagios, and we hang some checks on them, for example, we validate backups. We do not just make backup, we then later separately unpack it and notify him that everything is fine. This is called the special host-type aggregator. In the future we will use it for autoscaling.
Nagios is also quite large: it performs approximately 450 checks per second from one host - we have 2 hosts in different data centers, one is enough for the eyes, there is even a reserve.
What happens next? After Nagios somehow receives information, for example, that we have too large use of the processor by some component, our great and mighty BrassMonkey comes into play. This is our colleague, as I mentioned. Our system administrator. Let's talk a little about him. This is how it looks like.

He has long been used by us to solve routine problems. For example, reboot the server. In the middle of the night, the virtual machine stuck for some reason. Instead of receiving a call, BrassMonkey just goes and reboots this virtual machine - and no problems.
The same thing happens with restarting demons, with some routine tasks. The algorithm of his work is very simple. He goes to Nagios and says: “Listen, comrade, do you have anything for me?” If you have, we inform the system administrators and actually do some actions. But naturally, he can do much more: autoscaling!
When BrassMonkey comes into action, for example, it responds to some event of an increase in the amount of consumption of CPU time, it connects with our Serveradmin - this is the cloud solution that I mentioned recently.
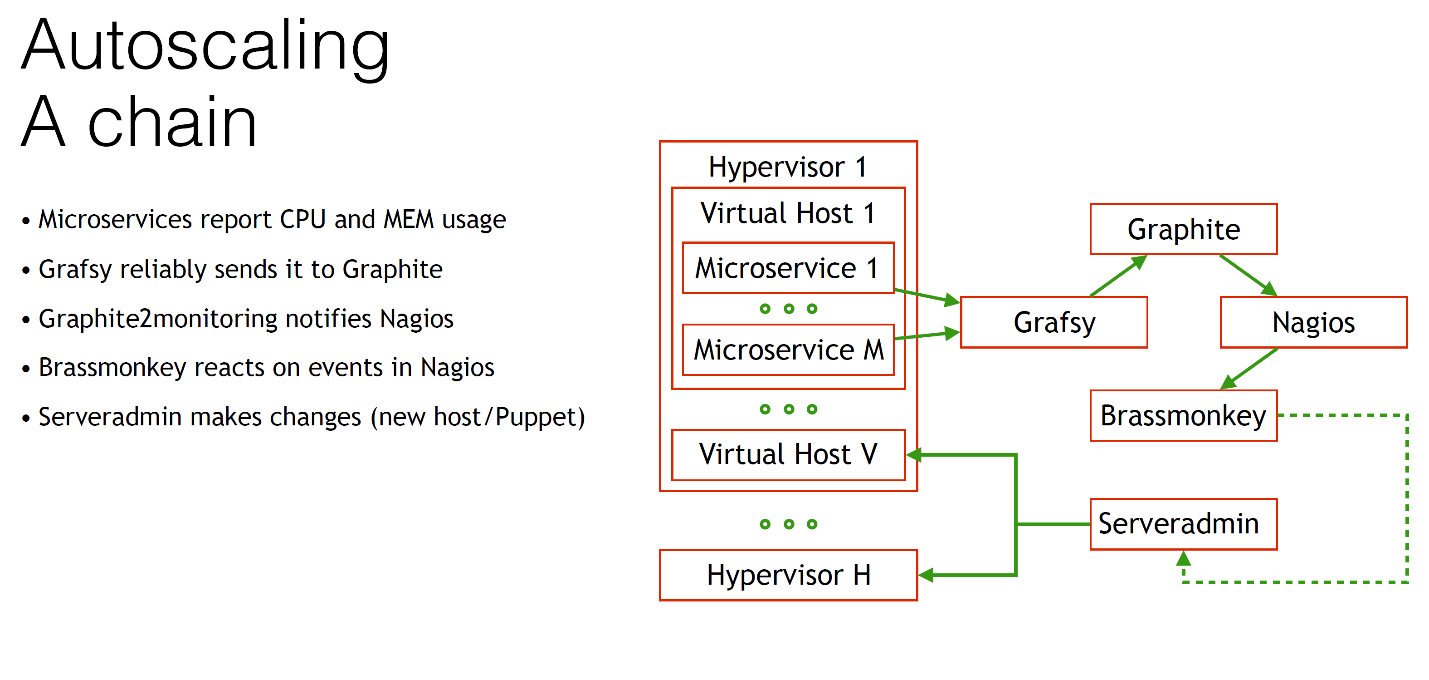
In fact, this Serveradmin manages in general everything in our infrastructure. The most important thing that he can do is create a new virtual machine without any problems, with the help of one command or, for example, add a component to an existing virtual machine. The only thing we need is for BrassMonkey to ask Serveradmin to do something.
This is our Serveradmin.

There are many more attributes, but you do not need to see them. His main task is to be a single source of truth. All the information in it contains all of our infrastructure. If there is any host, then everything about it is described there. It should always be relevant information.
If you want to change the role of the host, you change the Puppet classes right there in the attributes through the web interface. So you say: “Okay, you're no longer a web server, you are now a database.” Just change one attribute, and everything is ready.
Of course, he manages such trivial things as DNS, he manages what balancers our server is under. And, most interestingly, it controls the location of the virtual machine. You can go to the web interface, change the location of the virtual machine there. The attribute is called xen_host - historically, we used Xen. You change the attribute, and it automatically migrates the machine to you with the help of the very KVM live migration, without any downtime at all. Your memory is synchronized on the fly, elegant. Well, of course, he manages such basic things as checks in Nagios, graphs in Graphite.
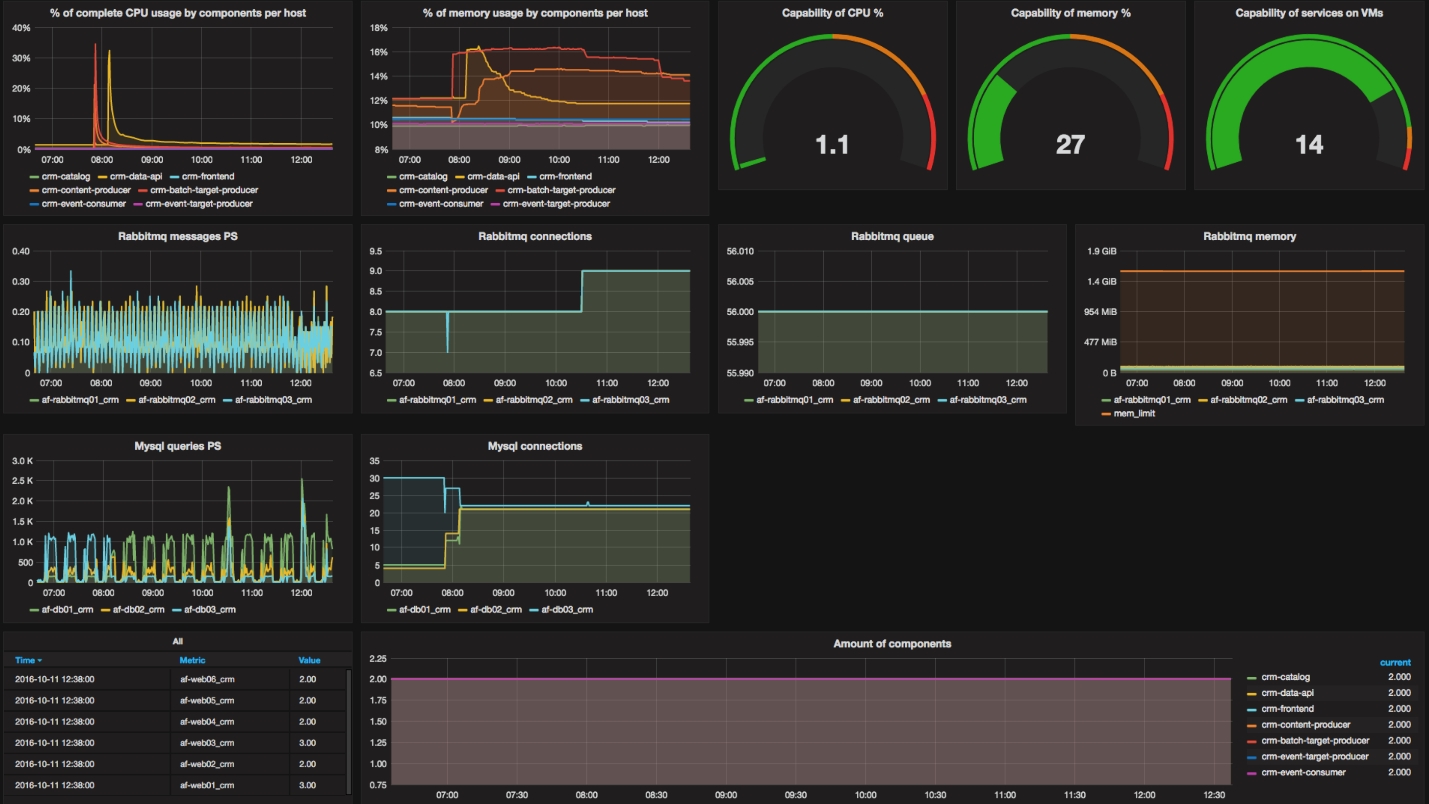
Something like this looks like our dashboard on monitoring that autoscaling and our CRM. There are a lot of graphs, interesting graphs for you - at the top there are three right. They show the capacity of our system. You can see that we have the use of processors (at the moment there is no processor at all), the memory usage and the number of slots in the virtual machines to start the components.
We monitor it all, it all goes to Graphite, all this through Nagios, BrassMonkey, everything is beautiful. Let's see how it all works. This example.
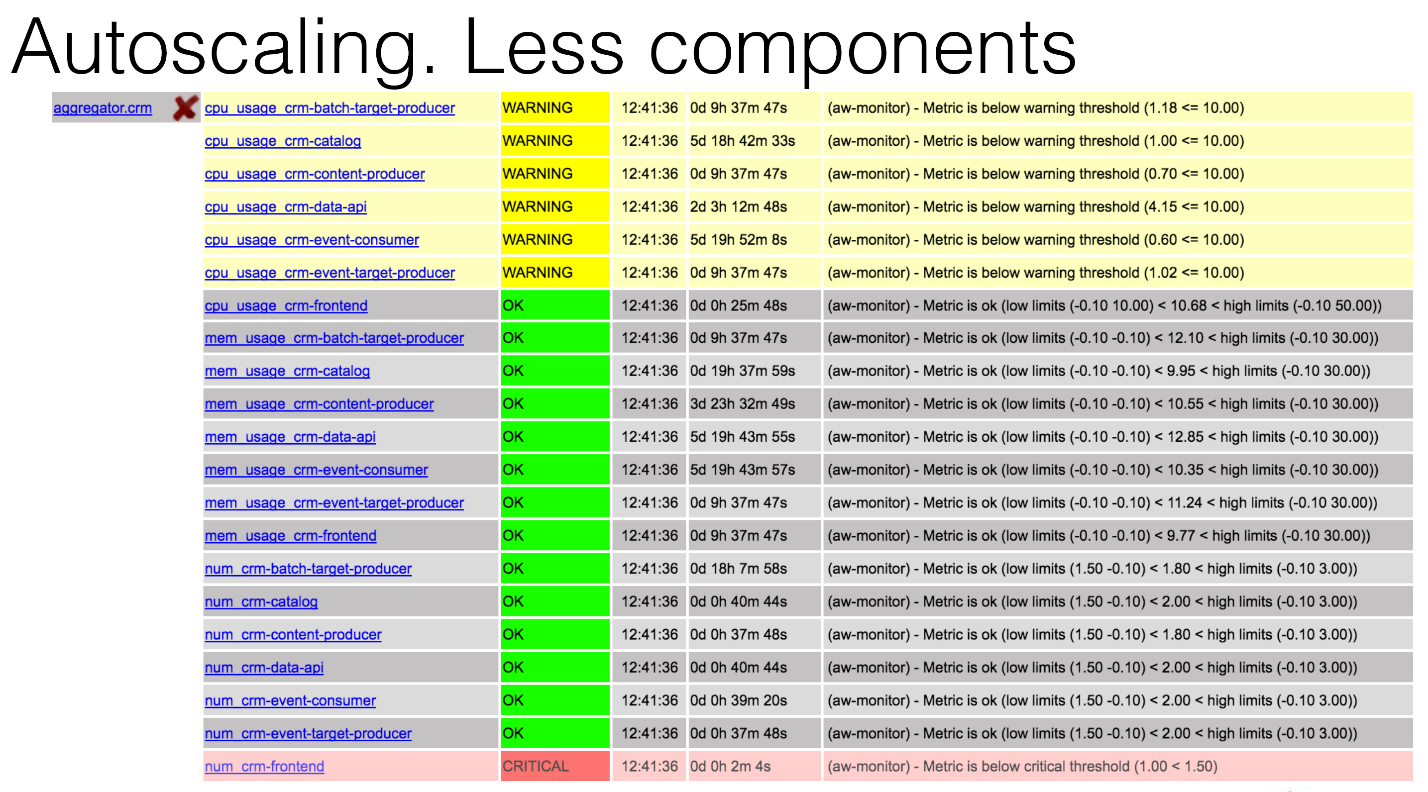
This is what the aggregator will look like, the same virtual host in our Nagios, where you can see that you have a critical CRM-frontend component. For some reason, one of the components died, maybe in the middle of the night. What will happen?

BrassMonkey will enter the game, conduct some analysis and write that it has added a new component to one of the hosts, which already exists, no problems.
The next case. We have increased the load. A bunch of events came to us from Kafka, and our average load on components at the CRM-event-consumer increased by about 70%.This is more than a critical threshold.

Again, we can see this in graphs in Graphite. You now see two graphs: on the left - the CPU consumption of a component on all virtual machines, on the right - the number of those components. You can see that at about 6:10 pm the load began to grow strongly, some data began to arrive, our components began to work. She remained in an acceptable position, we did not do anything. Then this load passed the critical threshold, and at about 18:23 we added the first additional component. Further, our load continues to grow, and the system adds a second component. And this stops, because the situation is resolved. The load goes down.
It took some time, we still held those components in case of increased load. This is a fairly good practice, Facebook also advises. If you read articles like Netflix does their autoscaling, they also say: predict in advance and then reduce the number of components slowly. Hold them just in case.
You can also see on the processor consumption graph that we first had an increase in the load on the consumer, on the event consumer, but then increased on the producer. That is, Producer also entered the game after a while, because we needed to filter the events, add them, some kind of magic happened. But we didn’t do anything with producer, because he didn’t overcome our thresholds.
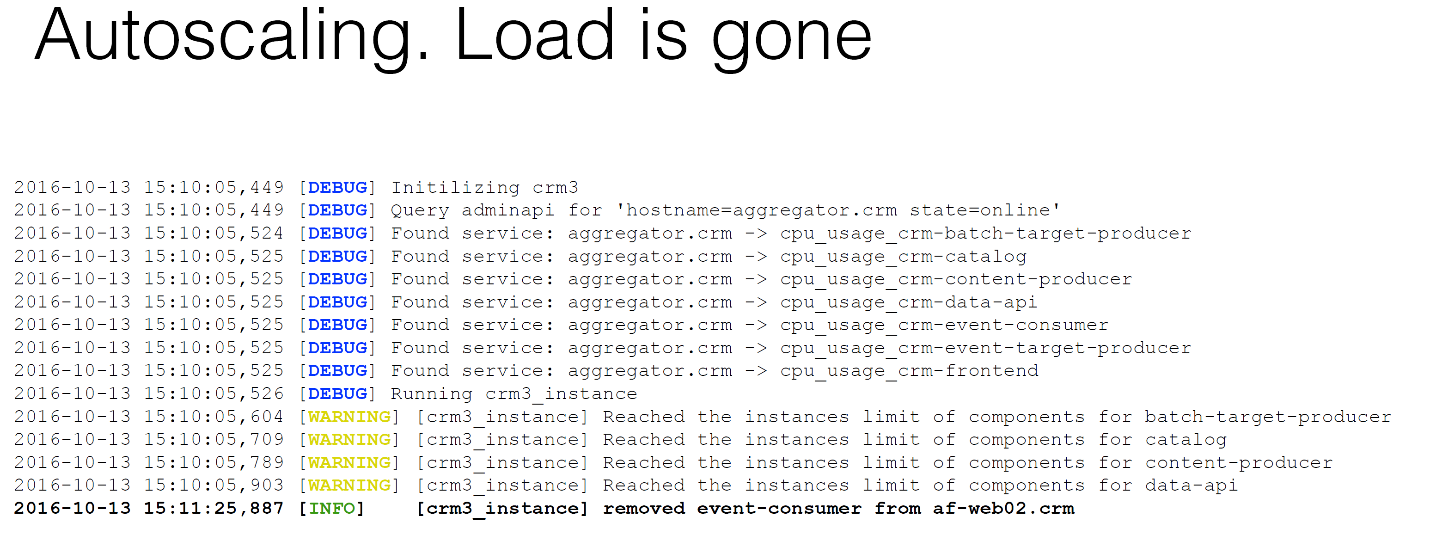
If you look at the BrassMonkey logs, then you will see that BrassMonkey decided to stop at some point, because each component has its own limits on how much we need it. We need to consume much more processors of this component, in the other we need more memory, in the third - more disk.
We have some limits, so that the system does not go crazy, so that we do not wake up in the morning, and there were no problems. We had such a situation when our BrassMonkey worked to increase the disk in the virtual machine. The default virtual machine occupied 10 gigabytes. In the morning we woke up, and she was 400 gigabytes. It was very unpleasant, because XFS easily increases, but does not decrease at all.
If you look at our favorite Serveradmin, you will see that the very attributes that Puppet classes, including our Serveradmin controls, are also 4 components. We are not the time.
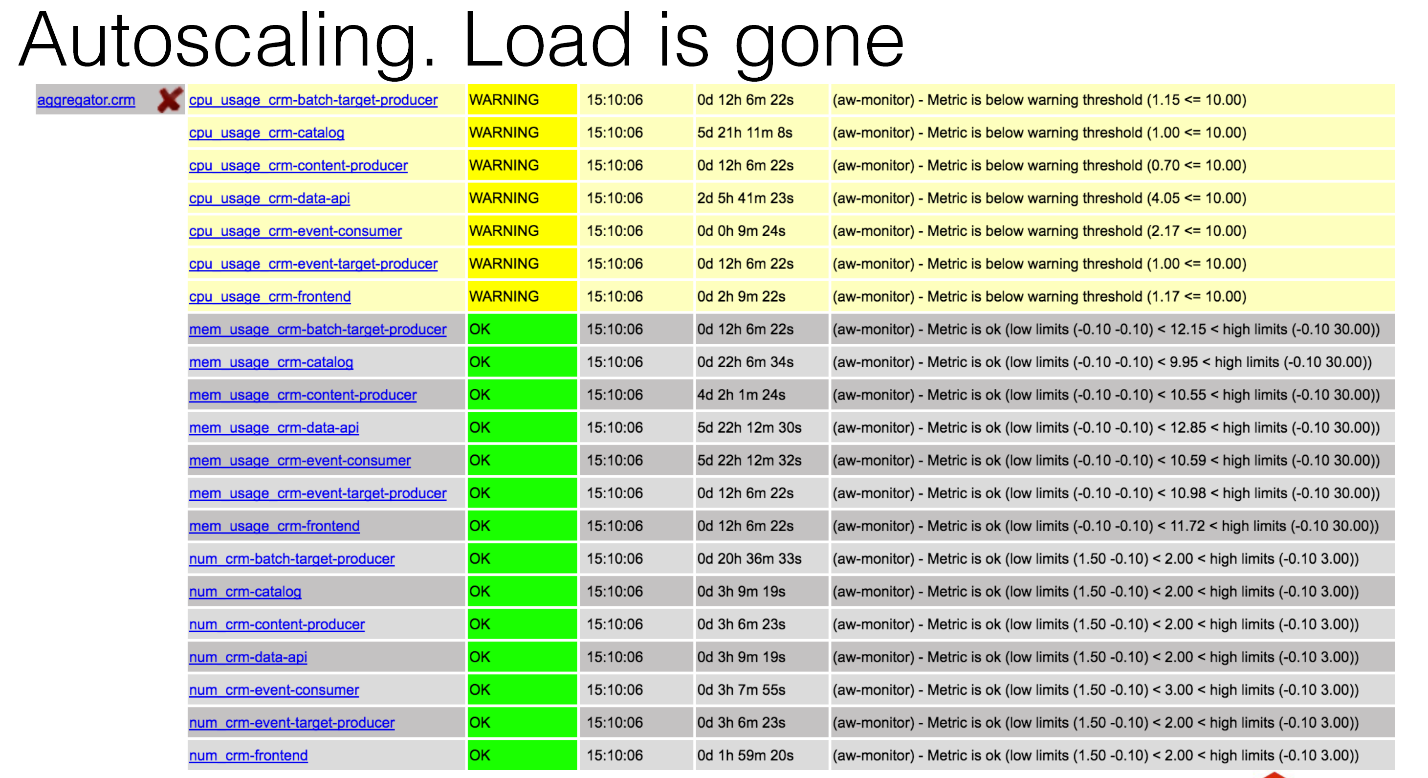
What happens next when the load drops? As we saw in the picture, at some point she was sleeping. We see a warning that we have a minimum limit on the consumption of processes. We do not do anything conditionally, we simply expend, warm the air. If you look at the BrassMonkey logs, you will see that he, too, said: “And let's hit a couple of components after the analysis”.
What you need to do to work like this autoscaling?

In addition to those Open Source solutions that you can find anywhere, you still need to write something.
We need the Grafsy client to deliver metrics reliably. If we break our Graphite for some reason - for example, we use Whisper, with replication hard enough - we just stop it, and Grafsy will be a few days, or even weeks, if you want to save those same metrics, and then send them all together. So we will never lose them.
We still need to write the very notifier. But it is already written, thank God, as they say. He will notify you, you can use it for various monitoring systems, everything is quite simple.
I didn’t talk about this, but as you remember, we have database clusters and queue clusters, in our case RabbitMQ. We also need to check that the node in the cluster is alive. We should not balance the load on it when it is not living. But what to do with MySQL, with MariaDB? You simply connect to it via telnet or any of your favorite utilities, and it says: "This node is running."
What to do if the data on it is not relevant? ClusterHC is interesting because it is already a modular system. You can easily add even your own modules. He is able to check MySQL and RabbitMQ for the fact that the cluster is synchronous. Everything is very pretty.
For the same MySQL, we use a user manager. We tried the Puppet module, it is terrible, do not use it, try here mmdu. To include a host in a cluster, you need some initial setup, you need some users to exist. It is very easy to do with this utility. It will easily create everything from the configuration file.
All these utilities are written in Go. You may remember that we have BrassMonkey, for which we need a module that tells what to do and in what cases. It is written in Python.
In architectural solutions, we also had to do something. We needed to determine which way we want to measure, what we need to increase: the number of components or virtual machines. There are 2 ways: integral and differential. We can predict an increase in the load, but we can say: “Okay, the average load for such a time is equal to that”.
We tried the differential path. Very bad, because you constantly have a prediction. You have a stream of data with which the system may have already coped, you do not need to scale anything, you have constant false positives. It is very ugly, we decided to stay on the integral path.
You need to create a virtual machine with just one command. It sounds simple, but those who use Puppet know that sometimes you have to run Puppet 5-6 times to get it to work at least somehow. We need to bring this to a very good view.
Well, a very important point. This is more to the developers. You need more than 1 component to work at the same time. Because the first thing I stumbled upon when I started working with my developers was that deadlocks were constantly falling down on us, because the components were simply fighting for resources.
These are all fairly obvious things, there is no magic here. You just need to keep the system in order.
Results
What would I like to draw a conclusion from all this?
In fact, it's not so hard to make your own autoscaling. You do not need to use super-expensive Amazon, Google or Microsoft Azure. This is all at least 3 times more expensive than using their own resources. You do not need to run for trends.
I can say, I call: think, maybe you already have everything for this. You probably don’t even have to migrate to another system or technology. You just use your current virtualization. This is all done.
You can save company resources. In addition to saving banal electricity, disk space and slots on hardware-machines, you save your own resources. Because in the middle of the night you don’t have to fix it all. The system administrator will be happy because the system is repairing itself.
Well, an important point for me, I have this pain right here. This is what developers need to write the right applications. This previous presentation was about the correct code. Now we have about the right applications. Sounds pretty obvious, well and good.
I have everything, you can find all the mentioned utilities on GitHub.
→ GitHub of our company
→ My GitHub
For more information, visit our website , maybe that interesting find. Thank.
How to make a high-loaded service without knowing the amount of load
Source: https://habr.com/ru/post/323358/
All Articles