Testing problems: why 100% code coverage is bad

Recently, in our blog, we talked about using domain-specific languages to solve specific development problems using Python. Today we will talk about testing - in particular, about why one hundred percent coverage with code tests is really bad.
The material is based on the performance of the Positive Technologies developer Ivan Tsyganov at the Moscow Python Conf conference ( slides , video ).
')
Why do we write tests
Security experts from Positive Technologies conduct over 200 information security audits per year, but we are primarily a food company. One of our products is the MaxPatrol security and compliance monitoring system.
The product consists of three large subsystems:
- Pentest is responsible for penetration testing - a system without access details tries to collect data about network devices. .
- Audit performs system checks - having access details, the system collects information about the device.
- Compliance - performs compliance checks.
The size of only one Audit subsystem is more than 50,000 lines - without tests, declarations, only pure Python code. Why do we write tests for such a large amount of code?
- It is important for us to understand that the written code works.
- Review the code becomes easier.
- So we get a guarantee that nothing is broken with changes.
Checking the code coverage with tests also allows you to solve your tasks:
- It becomes clear what code is actually tested.
- It allows you to see all the branches of code execution that may not always be obvious.
Do I need 100% coverage?
There is an interesting point here - many experts believe that testing test coverage indicates the quality of testing. In fact, this is absolutely not the case. Yes, this is a good achievement (“we have 100% coverage!”), But this does not mean that the project has been fully tested. One hundred percent coverage says only one hundred percent coverage of the code with tests, and nothing more.
For Python, the de facto coverage checking standard is the coverage.py library. It allows you to check the code coverage of tests, it has a plugin for pytest. Basically, the library works, but not always.
An example - the code below is covered by tests at 100%. And in this example, there are no complaints about the work of coverage.py.
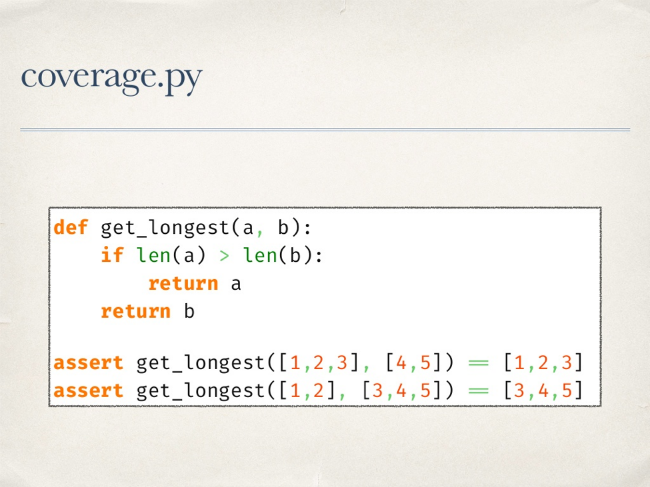
But on a more complex function, one test gives 100% coverage, while the function remains untested. We do not check the situation when a single 'if' function will turn into False.

The library has another mode of operation that allows you to track the coverage of the code execution branches. If you run a check in this mode, you will see that the transition from the third to the fifth line of code is not covered. This means that on all launches of tests we never got from the third line to the fifth right away, but always got to the fourth, that is, the “if” on all the test data turned into True.

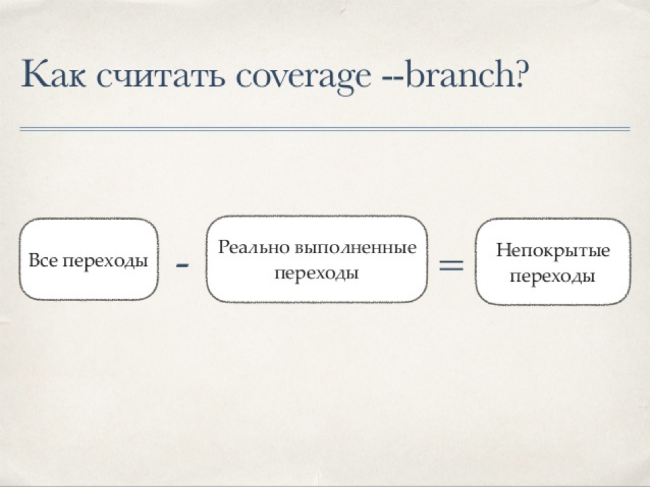
How is coverage considered
There is a simple formula for calculating code coverage for tests:

Coverage.py works according to this scheme - first, the library takes all the sources and runs it through its own analyzer to get a list of instructions. This analyzer bypasses all tokens and notes “interesting” facts from his point of view, then compiles the code, bypasses the resulting code-object and stores line numbers. When traversing tokens, he remembers class definitions, "collapses" multi-line expressions and eliminates comments.
Transitions between lines are considered approximately the same:
Again, the source code is taken and analyzed by the AstArcAnalyzer class to get a pair of values - from which line to which it is possible to go. AstArcAnalyzer bypasses the AST source tree from the root node, and each node type is processed separately.
Next, you need to somehow get information about the actually executed rows - for this in coverage.py the settrace function is used. It allows us to set our own trace function, which will be called when certain events occur.
For example, when the “call” event occurs, we understand that the function was called or we entered the generator ... In this case, the library saves the data of the previous context, starts collecting data of the new context, taking into account the peculiarities of the generators. Another event that interests us is the “line” event. In this case, the line being executed and the transition between the lines are remembered. The return event marks an exit from the context — it is important to remember here that yield also triggers the “return” event.
After this report is built. At this point, we have data on what was done, and what was supposed to be done - from these data we can draw conclusions about the coverage of the code with tests.
All these difficulties with bypassing bytecode, AST-trees allow you to check the coverage of a very complex code and get the correct report. It would seem that here it is a silver bullet, everything is just fine. But in fact, everything is not so good.
What can go wrong
Consider a simple example - the call of a function with the condition when passing parameters.
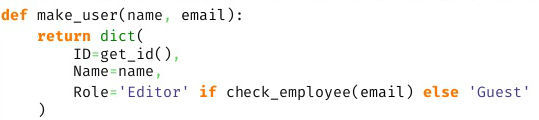
The if statement will always be covered. And we will never know that this condition always turned to false.
The problem will arise when using lambda - inside this function, coverage.py does not look and will not tell us that something is not covered inside. The library will not be able to deal with the list, dict, set-comprehensions.
All of these cases have something in common. As we found out above, coverage.py uses a parser and gets a list of instructions. As a result, the result of the work of the library is to cover instructions, not lines of code.
Making the world better
Take a simple example of uncovered code:

Suppose we want to cover it and know when the condition “or c” did not work. No coverage.py will allow this. What can you try to do in this case?
You can set your own tracing function, look at the result of its work and draw conclusions. That is, in fact, repeat what coverage.py does. This option is not suitable, since we have a limited number of events: call, line, return, exception. Small parts of the if statement we will never see.
Another option is to use the ast.NodeTransformer module. With it, we can bypass the tree, wrap each node in the “something”, run it and see what has been done. The problem here is that at the AST level it is very difficult to wrap a node into “something” without changing the execution logic. And in general, not all nodes can be wrapped. This method is also suitable.
But you can use a different approach. What if, during the import, to intercept control, bypass the bytecode of the imported module, add the call of its trace function inside the bytecode, collect the code-object and see what happened. This idea is implemented in the prototype of the OpTrace library .
How does OpTrace work
First of all, you need to install Import.Hook — everything is pretty simple here. It has Finder, which skips uninteresting modules to us, creating for the desired Loader. In turn, this class receives the module bytecode, its source code strings, modifies the byte code, and returns the modified bytecode as an imported module.
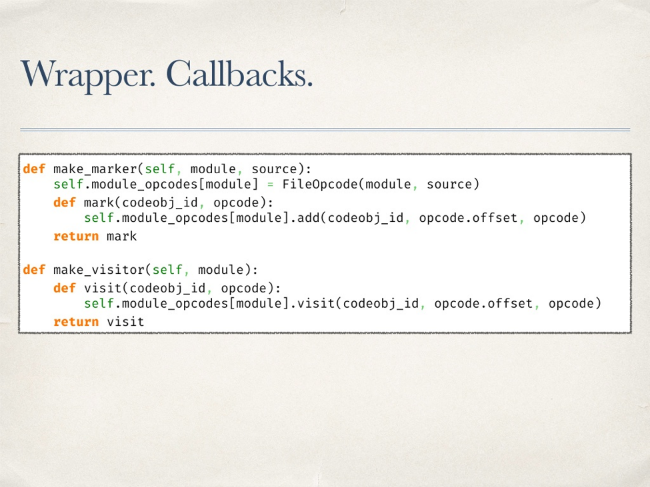
It works all this way. A wrapper is created, inside which two functions are “forwarded” - the first is needed to mark the opcode as already visited (visitor). The second task is to simply note that such an opcode exists in the source (marker).
Python has a number of bytecode tools. First of all, this is the dis module and its method of the same name allows you to see the baytkod in a beautiful way.

Such a view is convenient to view, but not to process. There is another method - get_instructions. It takes a code-object as input and returns a list of instructions.

The work of the library's prototype is built on this method. With this method, the entire bytecode is bypassed. To mark the existence of an opcode, the previously forked function of the marker is called.
Tracing is somewhat more complicated. It’s impossible just to call and call into Baytkod any methods we need. CodeObject has a consts attribute - these are constants available inside it. You can put a lambda function in them and “close” the current instruction to it as a default parameter. Thus, by calling this lambda from constants without parameters, we will be able to trace the execution of specific opcodes. Next you just need to generate the code to call a constant.
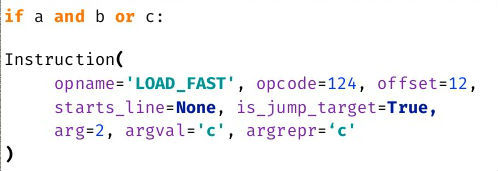
It is important not to forget about the original opcode - you need to add it too - and its parameters, while taking into account the offset in subsequent opcodes. After wrapping the bytecode, it will look something like this:

Bold the original traced bytecode is highlighted in the screenshot. After modifying the bytecode, you need to run the tests. So we will find out which part of the code was executed and which is not. The question arises, what to do with uncovered opcodes? In a draft of 50,000 lines, their listing may take several pages.
In fact, there is no way to uniquely translate any opcode to a line of code, but you can try to find it. Some opcodes have information about the line in which they are located. This means that during a crawl we can save the current line — until we see another line mentioning another line, we assume that the line has not changed. This information will be included in the report. Now he looks much better, it is already clear what happened where.

Suppose that the lines we always calculated correctly. Now you can try to calculate the position in the line for each skipped opcode. Consider a simple example with the LOAD_FAST opcode. Its parameters indicate that we are dealing with loading some variable. We can try to find her name in the line we know.
Covering about 70 types of opcodes, it was possible to get a sane report. But many opcodes can not be covered. The new report looks like this:
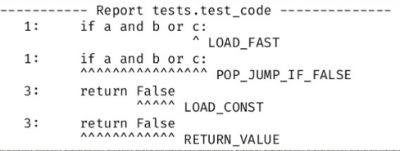
Surprisingly, it works. For example, we clearly see that LOAD_FAST did not work for variable c.
OpTrace: the pros and cons
There are a number of problems with the prototype.
- Variables are not always correctly marked in the report.
- Some opcodes have to be skipped.
- Productivity is essentially unknown — although this is not the most important point here.
On the other hand, there are obvious advantages. First of all, tracing works well, which means this idea has the right to life.
Conclusion
One of the goals of this research and development was to demonstrate the fact that there are no perfect libraries. Coverage.py is good, but not perfect - blindly believing its reports is impossible. Therefore, you should always understand how the library works and how it works from the inside.
Another key thesis - coverage in 100% relaxes the team. Since the results of the work of the libraries cannot be fully trusted, the full coverage is just an achievement, which can hide real problems.
Source: https://habr.com/ru/post/323294/
All Articles