Discipline, Accuracy, Attention to Detail
Introduction:
This article is about working with Microsoft Analysis Services and a little bit about storage on Microsoft SQL Server with which SSAS works. I had to deal with not quite trivial things and sometimes had to “jump over my head” in order to do what they wanted from me. Work had to be in between meetings. Sometimes the new functionality was discussed longer than it was developed. Often at meetings, several times, I had to tell the same thing. When I said that it was difficult for me to confer for more than one hour, they looked at me with surprise and incomprehension. In many ways, thanks to this setting, these not quite trivial things appeared, which I decided to write about.
The average for the period
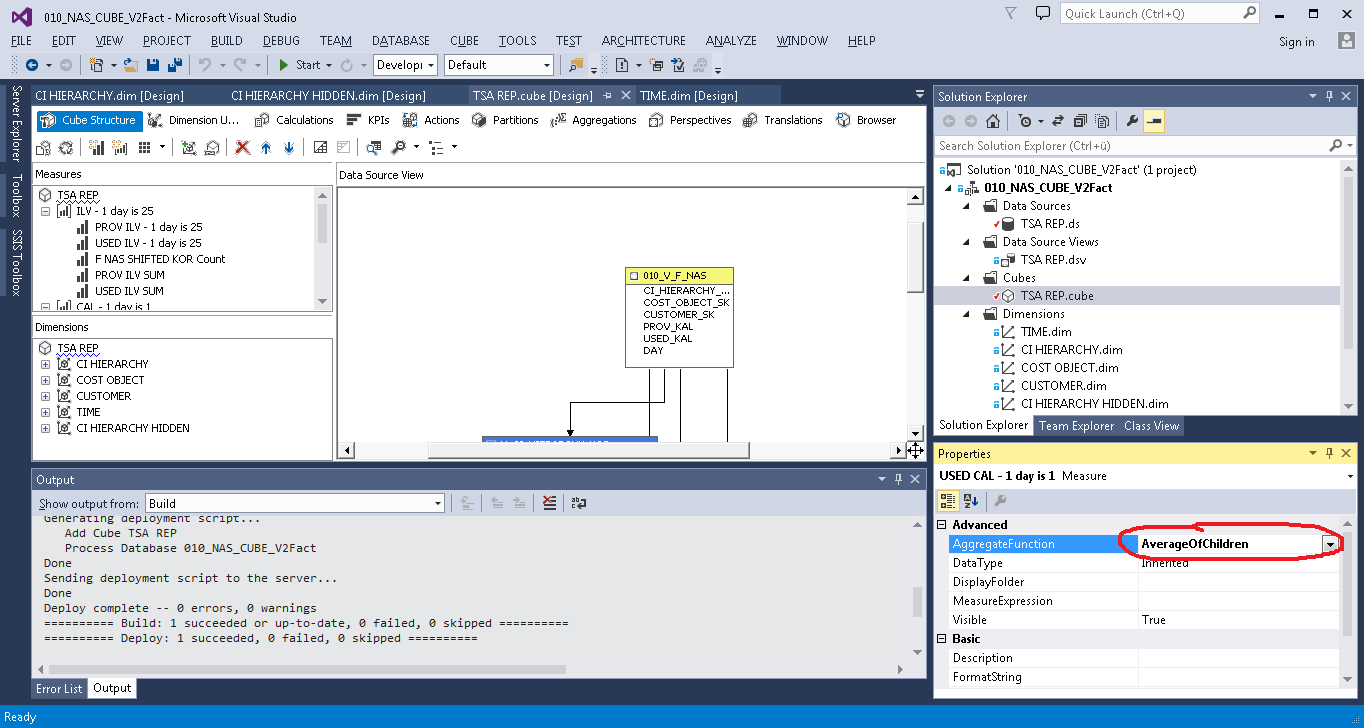
It was necessary to calculate the average value for the period. In MS Analysis Services, there is for this the function Average of Children, which counts the average of all non-empty values over a selected period.
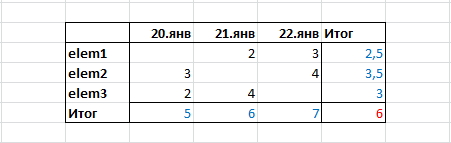
But the customer, after a rigorous study of the results, any questions? He showed me the following sample, and said that it was not correct:
')
Since, in his opinion, it should be like this:
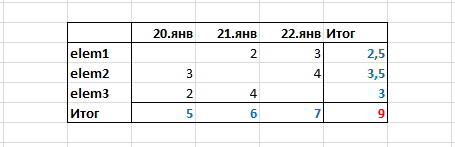
My question is: Why? He replied that he needed not the average value for the period, but the sum of the average values for each element for the period, that is,
NOT THIS WAY:
(5 + 6 + 7) / 3 = 6
THAT'S HOW:
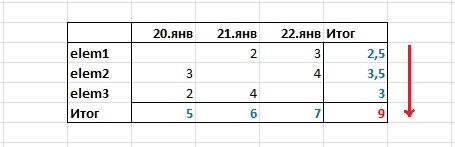
(2.5 + 3.5 + 3) = 9
This desire made me go through all the stages of accepting the inevitable:
- Denial (This is anything but an average over the period);
- Anger (Who taught him mathematics?);
- Bargaining (Let's leave it and ask those who will use it?);
- Depression (And they said that everyone here is very kind and good ...);
- Adoption (You can teach a hare to smoke. We must do it this way, I will do it as requested).
The decision was not entirely obvious. In the Calculations section, I created the Calculated Member and wrote the expression using the functions iif, isleaf and sum.
First option:
iif ( not isleaf([ELEM].[ELEM SK].currentmember), sum(EXISTING [ELEM].[ELEM SK].currentmember.Children,[Measures].[FCT VAL]), [Measures].[FCT VAL] ) where [ELEM] is a dimension, and [ELEM SK] is its key.
The result was unexpected:
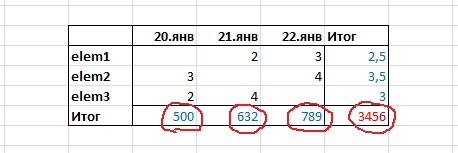
The strange numbers in the Totals turned out to be the sums of all values of the elements in the dimension, regardless of what values I chose in the filter. That is, in the end, there was always the sum of all the elements, not just the selected ones.
The problem was not solved immediately. The first solution was an option with an additional hidden dimension. I created a copy of the [ELEM] dimension, changed the Visible property to False, and wrote:
iif ( not isleaf([ELEM].[ELEM SK].currentmember), sum(EXISTING [ELEM COPY].[ELEM SK].currentmember.Children,[Measures].[FCT VAL]), [Measures].[FCT VAL] ) It turned out as the customer wanted.
A little later, I found a “more correct” solution. I created the Named Set.
CREATE DYNAMIC SET CURRENTCUBE.[Controller Set] AS { EXISTING [ELEM].[ELEM SK].currentmember.Children }; a Calculated Member rewrote to:
iif ( not isleaf([ELEM].[ELEM SK].currentmember), sum([Controller Set],[Measures].[FCT VAL]), [Measures].[FCT VAL] ) Thus, a copy of the measurement [ELEM COPY] was no longer needed.
I presented this solution to the customer and took up other tasks. After some time, I received a new technical task, which included the notion of “statistical average”. My question is - What is it? He said that users do not need the sum of the average values for each element for the period, but the average for the period, that is, the usual Average of Children, but he asked me to save.
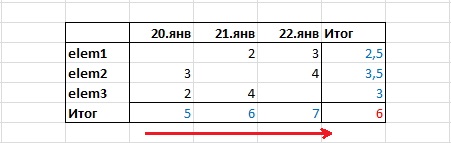
He also asked to add an average for the period, taking into account all days, and not just those in which there are values.
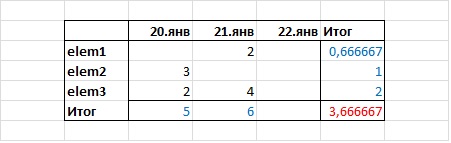
(5 + 6) / 3 = 3.666667
I solved the task with the help of an additional fact, which simply counted the number of lines in the table for Time Dimension (in this solution, there is always one record for each day in this table). Further, he added the facts with aggregation - the sum (AggregateFunction = Sum) and added the Calculated Member, in which he divided the Sum, by the number of days.
[Measures].[Sum DATA]/[Measures].[TIME Count] Storage
The client we work for was not so simple. You can say about him - "Monsieur knows a lot about perversions." After we dealt with Cuba, a more global task was set before us. Develop storage (Data Vault), but not simple. The first thing we were told was that now our Bible is “Building a Scalable Data Warehouse with Data Vault 2.0,” written by Daniel Linstedt and insisted on adding “Bitemporal Database Table Design” there . Based on the built repository, it was required to build a Cube with historicity. Such a cube has two time dimensions, one shows the business date, the other - the transaction date. If we talk about the development process, it was painful, even now it hurts, but something happened.
The essence of “Bitemporal Database Table Design” is that each record has 4 additional fields:
- Business_date_ from
- Business_date_to
- Transaction_date_from
- Transaction_date_to
The first 2 contain the interval of business dates - from which and for which date the value remained unchanged. The second 2 fields contain the interval of transactional dates. In this interval, the period is stored during which the value has not been corrected by anyone (as an option retroactively).
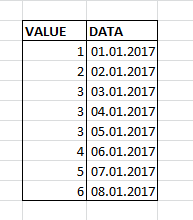
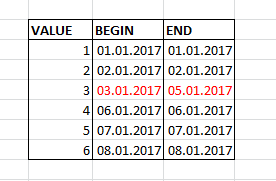
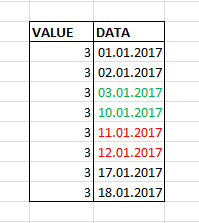
One of the problems in solving this problem was the original data, or rather the view in which we received them. The data came in the form of daily sections. That is, there was a Date field in which the date on which the data was taken was stored, the next day there was a new value in the Date field and the data either changed on that day or not. It was necessary to combine the data into periods. Those. if, for example, the value did not change for 3 days in a row, then instead of 3 lines you should save one in which instead of the DATA column there would be two columns BEGIN and END.
Data before conversion:
Data after conversion:
I solved this problem through LAG and LEAD functions. The essence of the solution is that if the value does not change for 3 days in a row, then the date from the current line, minus the date from the previous one will be equal to 1:
- If the data goes in a row, then 01/12/2017 - 01/11/2017 = 1
- If there is a gap between the data, then 01/10/2017 - 01/03/2017 = 7
From here:
SELECT * FROM ( SELECT Volume ,[Date] dt ,DATEDIFF(day, LAG([Date], 1) OVER (PARTITION BY Volume ORDER BY [Date]), [Date]) difLag ,DATEDIFF(day, [Date], LEAD([Date], 1) OVER (PARTITION BY Volume ORDER BY [Date])) difLead FROM dbo.Test n ) m WHERE ( difLag > 1 OR difLag IS NULL ) OR ( difLead > 1 OR difLead IS NULL )- Next, we need to somehow group this result, combine pairs for those periods that lasted more than one day and leave those whose period lasted one day. I made a grouping, numbered lines and combining even and odd lines.
So the whole query:WITH se AS ( SELECT * FROM ( SELECT Volume ,[Date] dt ,DATEDIFF(day, LAG([Date], 1) OVER (PARTITION BY Volume ORDER BY [Date]), [Date]) difLag ,DATEDIFF(day, [Date], LEAD([Date], 1) OVER (PARTITION BY Volume ORDER BY [Date])) difLead FROM Test n ) m WHERE (difLag > 1 OR difLag IS NULL) OR (difLead > 1 OR difLead IS NULL) ) ,p1 AS --choose only one day periods (be careful) ( SELECT Volume ,dt AS VT_BEG ,dt AS VT_END FROM se WHERE NOT (isnull(difLag, - 1) = 1 OR isnull(difLead, - 1) = 1) ) ,p2 AS ( SELECT Volume ,CASE WHEN difLead IS NOT NULL AND (difLag IS NULL OR difLag > 1) THEN dt END AS VT_BEG ,CASE WHEN difLag IS NOT NULL AND (difLead IS NULL OR difLead > 1) THEN dt END AS VT_END ,row_number() OVER (ORDER BY Volume,dt) AS rn FROM se WHERE isnull(difLag, - 1) = 1 OR isnull(difLead, - 1) = 1 ) SELECT * FROM ( SELECT min(Volume) AS data ,min(VT_BEG) AS VT_BEG ,min(VT_END) AS VT_END FROM p2 GROUP BY (CASE WHEN rn % 2 = 0 THEN rn ELSE rn + 1 END) UNION ALL SELECT Volume,VT_BEG,VT_END FROM p1 ) g ORDER BY VT_BEG ,data
Total:
In the office of the client for whom I work, hangs a poster with the slogan. With this slogan, I decided to name this article, since, in my opinion, it, in part, explains the reason for the difficulties that I have to face. The project is not finished yet and I think that all the most interesting is still ahead. I have already come to terms with meetings and when people ask me about something, sometimes the phrase from KVN comes to mind: “Well done, ask smart questions, get stupid answers ...”, which helps me to get together and try to answer something intelligible.
In this article, I told only about the most, in my opinion, interesting things that were in the project. Besides them there was a lot of routine, disputes and other, not so original, decisions. I hope that what I have written about will be interesting and useful.
Source: https://habr.com/ru/post/323276/
All Articles