Simplify IBCS Report Design
IBCS is not an integrated battlefield control system (integrated battle management system) as someone might have thought, IBCS is International Business Communication Standards, which translates as International Business Communication Standard, or a standardization language for presenting information in graphical and textual form in panels , graphs and tables, designed to achieve the same understanding of the information provided by different users.
IBCS is a standard that incorporates the concepts and rules of visual design of clear reports and presentations, based on the same principles used in circuit design, musical notation, or road marking signs that everyone understands.
The standard includes a number of practices, this article discusses the practice called “Simplify and avoid interference” (SIMPLIFY avoid clutter).
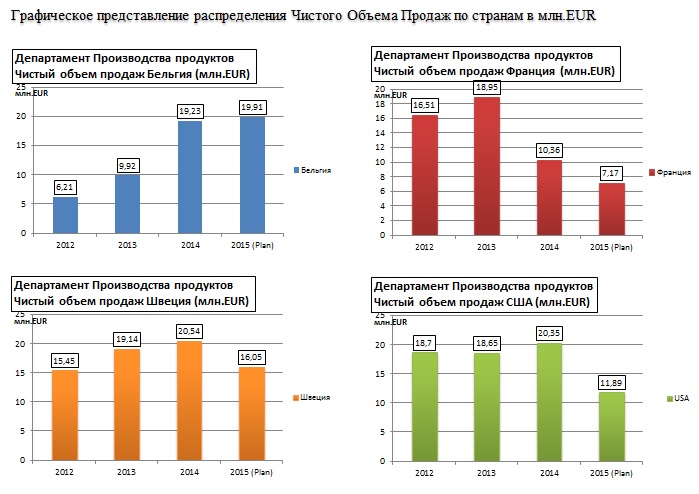
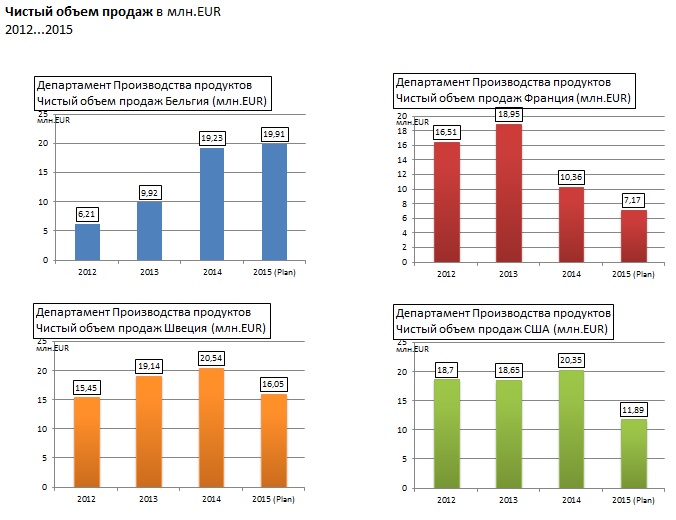
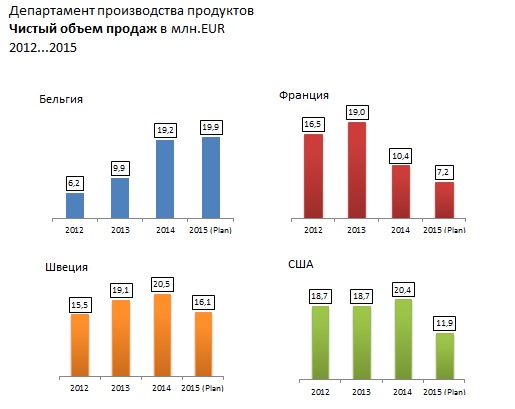
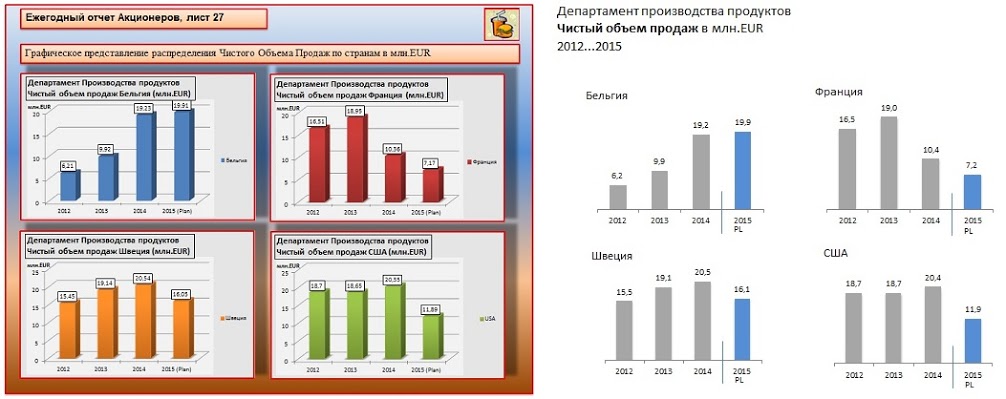
We often have to deal with the custom design of business information in a very ambiguous way. For example, as in the figure below.
')
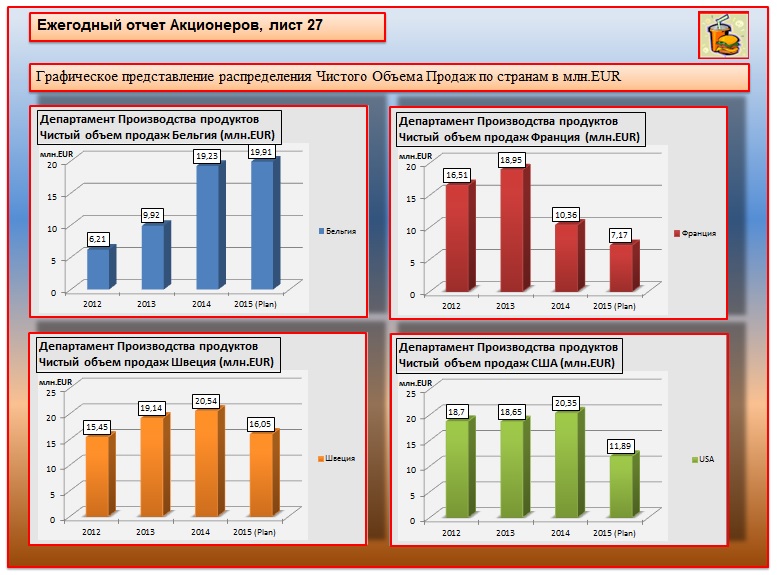
On the one hand, this dashboard presents data calling for conclusions about the state of the business, and on the other hand, the presentation of this information is so overloaded with unnecessary attributes that the very essence of the message is lost.
The IBCS standard urges to go by simplifying data presentation and focusing on maximum priority on the essence of the information presented, and not on its visual design.
Therefore, this presentation will be subject to lynching. The first thing that catches your eye is the abundance of flowers, the abundance of frames and the general congestion of the information panel.
Let us ask ourselves: what business sense does the background have?
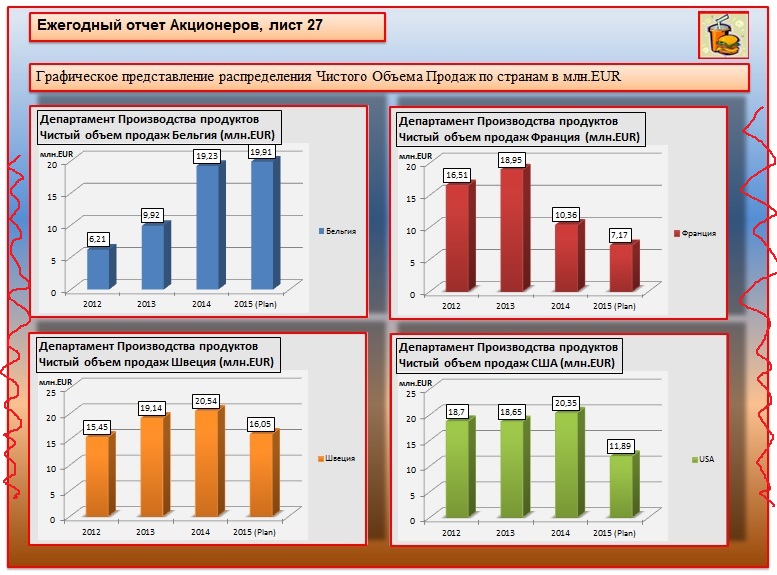
Is there any message, message, information in the background, based on which we could make a meaningful conclusion? Not! Or maybe he is in the red framework? Also no! => We remove!
Is there some kind of semantic load of the background under the text? Also no!
=> We remove!

Logo in the upper right corner - what's the point?
Yes, if this is a report provided outside, for example to our partners, then to identify it in the mass of similar, the logo can be a useful attribute, but if the report is used internally and all its consumers know what they are working with, the logo, as well as information about page number is not needed.
=> We remove!
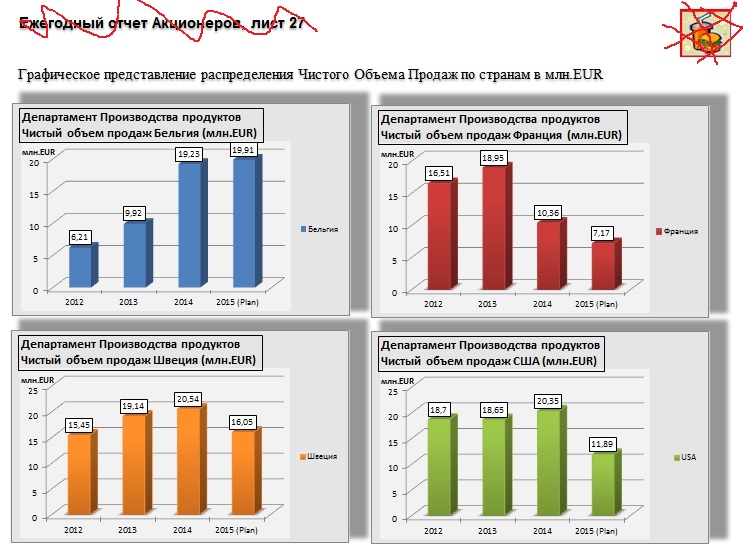
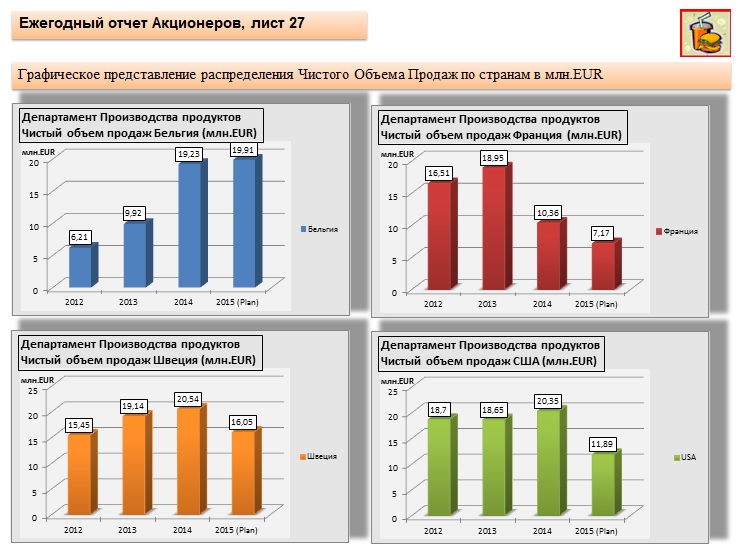
The next analysis object is the 3D representation of frames. In order to work with numbers, we do not need it!
=> We remove!
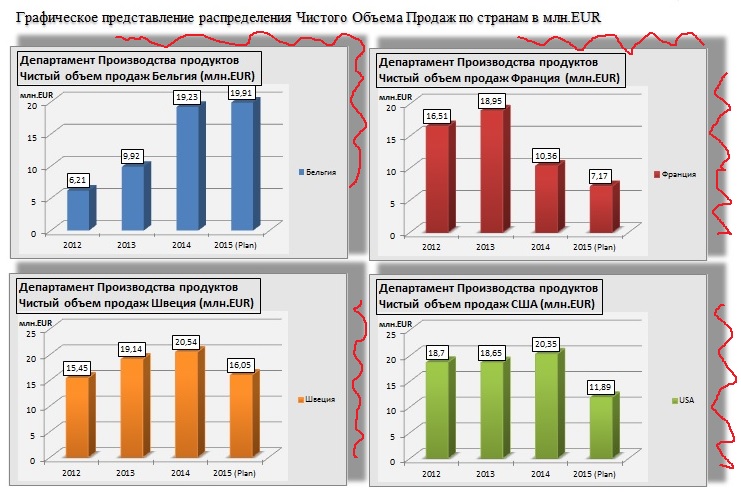
Frames around the graphs also do not carry any semantic load.
=> We remove!
The next analysis object is the three-dimensional graphs in the column view, which were popular in the early 90s. Let's take a close look, is it possible in terms of the appearance of these graphs to understand how much this or that value differs from the neighboring one and what is the real value of the column if it is projected on the vertical axis? It is very difficult because The 3D graph has an upper bound that is higher than the real value of the column. Such a visual presentation does not carry any meaning and only weights the perception of information.
=> We remove!
Now look carefully at the fonts. Fonts are different and moreover, they use selection, i.e. they are fat. There is a logical question: what to do if you really need to highlight something in the text to focus attention? The answer is obvious: remove the boldness for all fonts, discard the use of Sherif fonts and use simple fonts like Arial, Colibry, etc.
In addition, there is no point in explaining in the title that this report is a graphical representation of sales data. This is an obvious fact.
=> We remove!
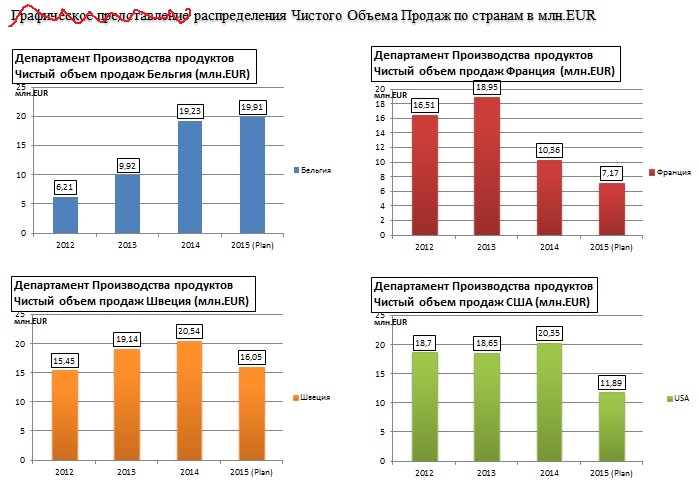
The remaining informative part is transferred to the report title.
The next object of analysis is a color legend which, in addition to the header above each graph, explains the assignment of a particular color to a country. In this report, each country is located in its own frame, there are no areas of intersection of data and mixed graphs. Therefore, the color legend has no meaning.
=> We remove!
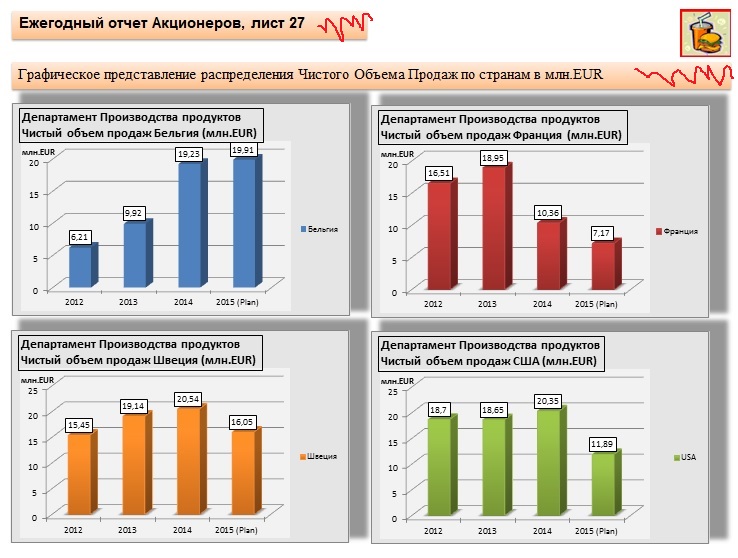
The header of each frame contains a duplicate report title. He is not needed because already submitted to the header of the report i. we understand what report is in front of us, what it is called and what its meaning is.
We also see above each chart information about which department prepares this report, this is important, so we transfer this data to the heading.
Also near each frame there is duplicated information about the currency and dimension, which is already presented in the header and it does not make sense to duplicate it.
=> Delete!
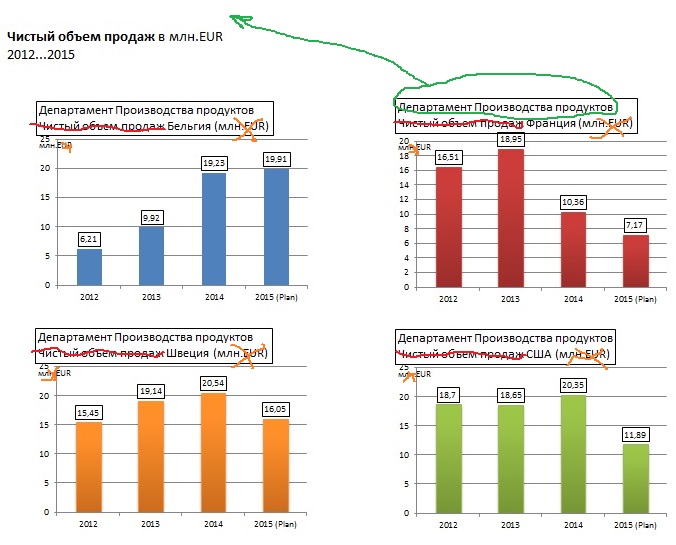
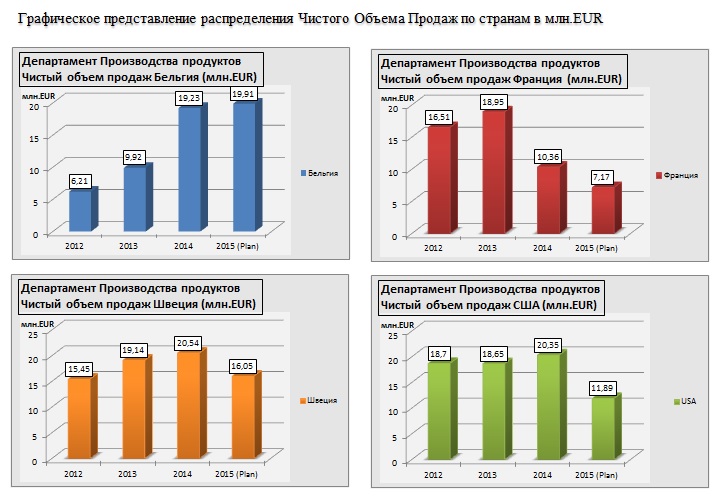
We do not need numbers on the vertical scales ah because they are duplicated above each column in the graph.
=> Delete!
The next object of analysis is the detail presented in figures, namely the number of decimal places. Cardinality of more than one digit visually on the graph will not be discernible to the eye, so it does not bear any comparable with the visualization of useful information.
=> We remove!
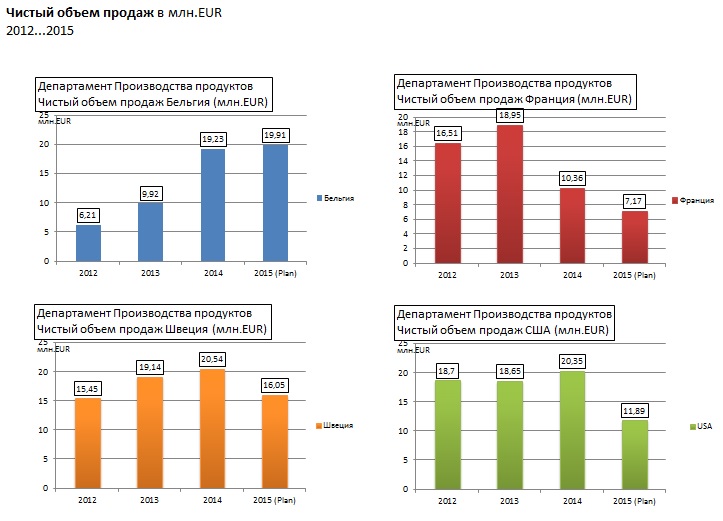
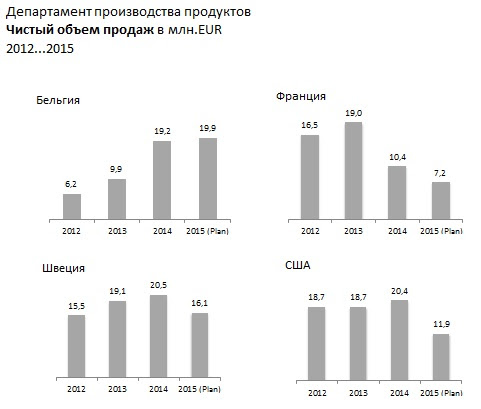
Already looks better, but this is not the limit ...
The color coloring of the graphs is also an extra attribute, since The name of the country to which it belongs is already presented in the name of each frame.
=> We remove!
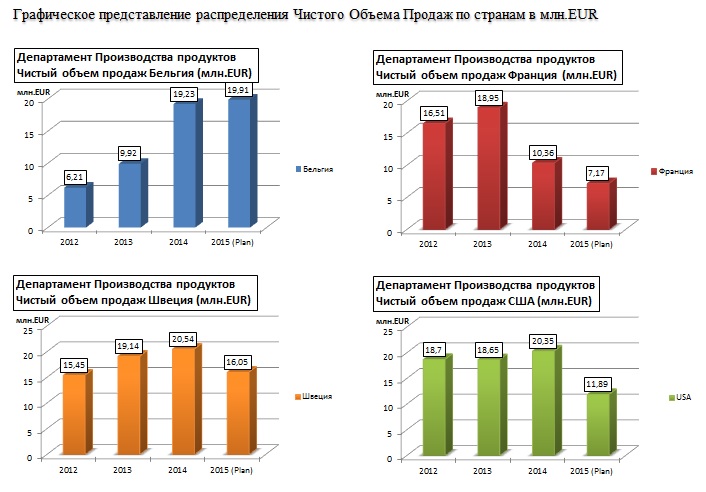
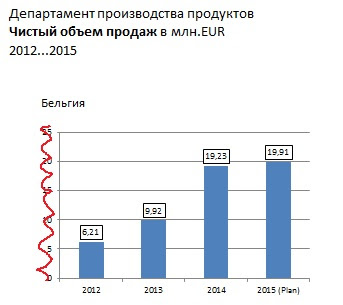
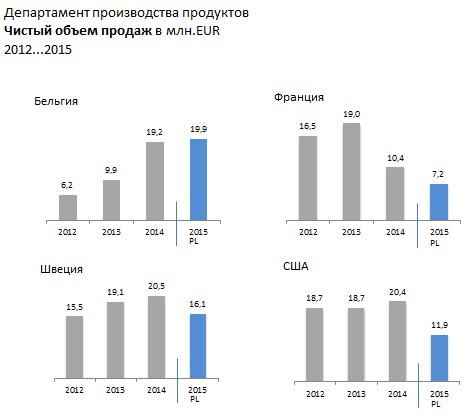
As a result of simplification, we have come to a completely different presentation of information.
For ease of use, a timeline cut-out is added to the graphs, identifying and separating actual and planned data (2015).
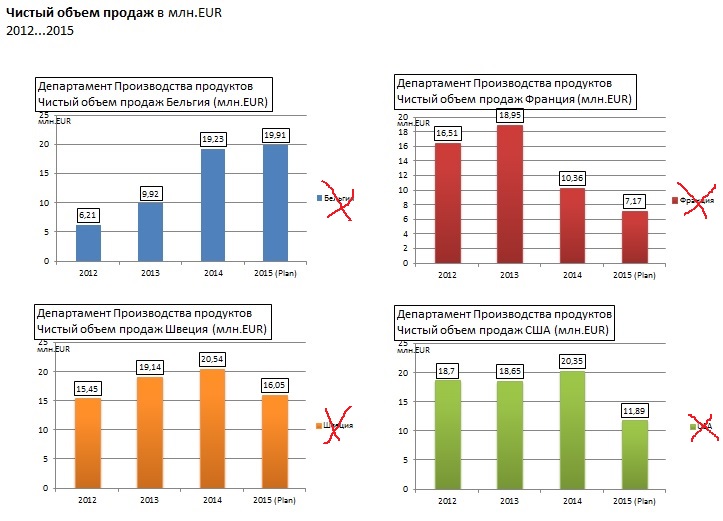
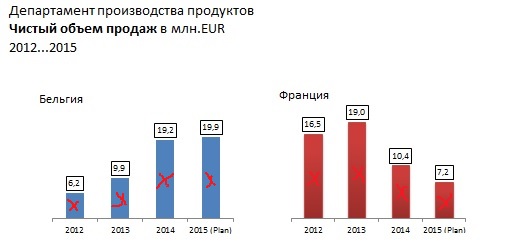
The above simplifications, in their ultimate goal, are designed to simplify the flow of information and make it more understandable, especially if there is a need to draw the user's attention to a particular element that requires special attention and analysis, as in the example below: 2015.
This presentation of information immediately emphasizes and draws attention to the object that requires close attention.
Compare what we started with and what was obtained as a result of applying one of the practices of the IBCS standard, which is called “simplification”.
Good luck everyone! Your uncle Nucl
IBCS is a standard that incorporates the concepts and rules of visual design of clear reports and presentations, based on the same principles used in circuit design, musical notation, or road marking signs that everyone understands.
The standard includes a number of practices, this article discusses the practice called “Simplify and avoid interference” (SIMPLIFY avoid clutter).
We often have to deal with the custom design of business information in a very ambiguous way. For example, as in the figure below.
')
On the one hand, this dashboard presents data calling for conclusions about the state of the business, and on the other hand, the presentation of this information is so overloaded with unnecessary attributes that the very essence of the message is lost.
The IBCS standard urges to go by simplifying data presentation and focusing on maximum priority on the essence of the information presented, and not on its visual design.
Therefore, this presentation will be subject to lynching. The first thing that catches your eye is the abundance of flowers, the abundance of frames and the general congestion of the information panel.
Let us ask ourselves: what business sense does the background have?
Is there any message, message, information in the background, based on which we could make a meaningful conclusion? Not! Or maybe he is in the red framework? Also no! => We remove!
Is there some kind of semantic load of the background under the text? Also no!
=> We remove!
Logo in the upper right corner - what's the point?
Yes, if this is a report provided outside, for example to our partners, then to identify it in the mass of similar, the logo can be a useful attribute, but if the report is used internally and all its consumers know what they are working with, the logo, as well as information about page number is not needed.
=> We remove!
The next analysis object is the 3D representation of frames. In order to work with numbers, we do not need it!
=> We remove!
Frames around the graphs also do not carry any semantic load.
=> We remove!
The next analysis object is the three-dimensional graphs in the column view, which were popular in the early 90s. Let's take a close look, is it possible in terms of the appearance of these graphs to understand how much this or that value differs from the neighboring one and what is the real value of the column if it is projected on the vertical axis? It is very difficult because The 3D graph has an upper bound that is higher than the real value of the column. Such a visual presentation does not carry any meaning and only weights the perception of information.
=> We remove!
Now look carefully at the fonts. Fonts are different and moreover, they use selection, i.e. they are fat. There is a logical question: what to do if you really need to highlight something in the text to focus attention? The answer is obvious: remove the boldness for all fonts, discard the use of Sherif fonts and use simple fonts like Arial, Colibry, etc.
In addition, there is no point in explaining in the title that this report is a graphical representation of sales data. This is an obvious fact.
=> We remove!
The remaining informative part is transferred to the report title.
The next object of analysis is a color legend which, in addition to the header above each graph, explains the assignment of a particular color to a country. In this report, each country is located in its own frame, there are no areas of intersection of data and mixed graphs. Therefore, the color legend has no meaning.
=> We remove!
The header of each frame contains a duplicate report title. He is not needed because already submitted to the header of the report i. we understand what report is in front of us, what it is called and what its meaning is.
We also see above each chart information about which department prepares this report, this is important, so we transfer this data to the heading.
Also near each frame there is duplicated information about the currency and dimension, which is already presented in the header and it does not make sense to duplicate it.
=> Delete!
We do not need numbers on the vertical scales ah because they are duplicated above each column in the graph.
=> Delete!
The next object of analysis is the detail presented in figures, namely the number of decimal places. Cardinality of more than one digit visually on the graph will not be discernible to the eye, so it does not bear any comparable with the visualization of useful information.
=> We remove!
Already looks better, but this is not the limit ...
The color coloring of the graphs is also an extra attribute, since The name of the country to which it belongs is already presented in the name of each frame.
=> We remove!
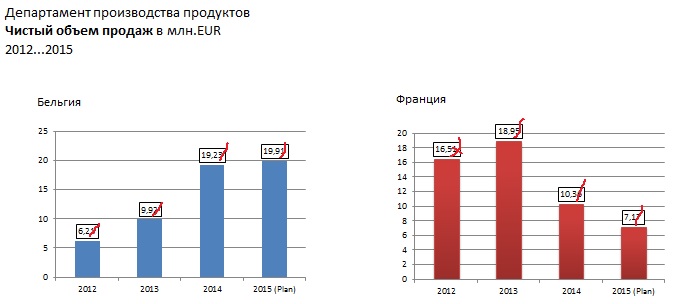
As a result of simplification, we have come to a completely different presentation of information.
For ease of use, a timeline cut-out is added to the graphs, identifying and separating actual and planned data (2015).
The above simplifications, in their ultimate goal, are designed to simplify the flow of information and make it more understandable, especially if there is a need to draw the user's attention to a particular element that requires special attention and analysis, as in the example below: 2015.
This presentation of information immediately emphasizes and draws attention to the object that requires close attention.
Compare what we started with and what was obtained as a result of applying one of the practices of the IBCS standard, which is called “simplification”.
Good luck everyone! Your uncle Nucl
Source: https://habr.com/ru/post/323230/
All Articles