Program on PYTHON to determine the authorship of the text by the frequency of occurrence of new words
Short history of the method
In a short publication [1] entitled “Authorship of Writers Can Be Recognized by a Special Formula”, it was reported that in the scientific journal New Journal of Physics, a group of Swedish physicists from Umeå University, under the guidance of Sebastian Berngardson, described a new method that allows identify the author of the text. Researchers tested how in the texts of three writers - Thomas Hardy, Henry Melville and David Lawrence - the so-called Zipf's law is implemented. The researchers found that the frequency of the emergence of new words with the growth of the volume of the text varies from different authors in different ways, and this pattern does not depend on the specific text, but only on the author.
This message was published on December 11, 2009, and more than twenty years ago, John Charles Baker [2] introduced a unit to measure the author's ability to use new words (here the term "new" is interpreted as not previously used in this text). John proved that this unit is an individual characteristic of the author.
In periodicals and online there is no information on the implementation of the Zipf law to determine authorship. Therefore, my work is the first scientific research in this area.
Full program code
#!/usr/bin/python # -*- coding: utf-8 -*- import nltk from nltk import * from nltk.corpus import brown stop_words= nltk.corpus.stopwords.words('english') import numpy as np import matplotlib.pyplot as plt import matplotlib as mpl mpl.rcParams['font.family'] = 'fantasy' mpl.rcParams['font.fantasy'] = 'Comic Sans MS, Arial' from nltk.stem import SnowballStemmer stop_symbols = '.,!?:;"-\n\r()' def comor_text(): # NLTK - stemmer = SnowballStemmer('english') # if len(txt.get(1.0,END))!=1 and len(txt1.get(1.0,END))!=1 and len(txt2.get(1.0,END))!=1: mrus=[txt.get(1.0,END),txt1.get(1.0,END),txt2.get(1.0,END)] mr=3 # elif len(txt.get(1.0,END))!=1 and len(txt1.get(1.0,END))!=1 and len(txt2.get(1.0,END))==1: mrus=[txt.get(1.0,END),txt1.get(1.0,END)] mr=2 elif len(txt.get(1.0,END))!=1 and len(txt1.get(1.0,END))==1 and len(txt2.get(1.0,END))==1: mrus=[txt.get(1.0,END)] mr=1 else: txt3.insert(END,"There are no all texts") return # , for text in mrus: v=([stemmer.stem(x) for x in [y.strip(stop_symbols) for y in text.lower().split()] if x and (x not in stop_words)]) # - my_dictionary=dict([]) z=[] for w in v: if w in my_dictionary: my_dictionary[w]+=1 else: my_dictionary[w]=1 max_count=int(txt5.get(1.0,END)) min_count=int(txt4.get(1.0,END)) if len(my_dictionary)<max_count: txt3.insert(END,"It is not enough of words for the analysis ") return # - my_dictionary_z=dict([]) for key,val in my_dictionary.items(): if val in my_dictionary_z: my_dictionary_z[val]+=1 else: my_dictionary_z[val]=1 z.append(val) z.sort(reverse=True) # e=z[ min_count:max_count] ee=[my_dictionary_z[val] for val in z][ min_count:max_count] ee=np.arange(len(my_dictionary))[ min_count:max_count] if text==mrus[0]: # -a,b + % zz=round((float(len(my_dictionary))*100)/(float(len(v))),0) tt=('In total of words (Text-1) --%i. New words --%i. Percen new words-- %i'%( len(v),len( my_dictionary),int(zz))) xData1 = ee yData1 = e z=[1/w for w in ee] z1=[(1/w)**2 for w in ee] t=[ round(e[i]/ee[i],4) for i in range(0,len(ee)) ] a=round((sum(e)*sum(z1)-sum(z)*sum(t))/(len(ee)*sum(z1)-sum(z)**2),3) b=round((len(ee)*sum(t)-sum(z)*sum(e))/(len(ee)*sum(z1)-sum(z)**2),3) y1=[round(a+b/w ,4) for w in ee] s=[round((y1[i]-e[i])**2,4) for i in range(0,len(ee))] sko=round(round((sum(s)/(len(ee)-1))**0.5,4)/(sum(y1)/len(ee)),4) tg='Factor --a '+str(a)+' Factor--b '+str(b)+' Mistake of approximation-- '+str(sko)+"%"+"\n"+tt txt3.delete(1.0, END) txt3.insert(END,tg) txt3.insert(END,'\n') y1Data1=y1 elif text==mrus[1]:# -a,b + % zz=round((float(len(my_dictionary))*100)/(float(len(v))),0) tt=('In total of words (Text-2) --%i. New words --%i. Percent new words-- %i'%( len(v),len( my_dictionary),int(zz))) xData2 = ee yData2=e z=[1/w for w in ee] z1=[(1/w)**2 for w in ee] t=[ round(e[i]/ee[i],4) for i in range(0,len(ee)) ] a=round((sum(e)*sum(z1)-sum(z)*sum(t))/(len(ee)*sum(z1)-sum(z)**2),3) b=round((len(ee)*sum(t)-sum(z)*sum(e))/(len(ee)*sum(z1)-sum(z)**2),3) y1=[round(a+b/w ,4) for w in ee] s=[round((y1[i]-e[i])**2,4) for i in range(0,len(ee))] sko=round(round((sum(s)/(len(ee)-1))**0.5,4)/(sum(y1)/len(ee)),4) tg='Factor --a '+str(a)+' Factor--b '+str(b)+' Mistake of approximation-- '+str(sko)+"%"+"\n"+tt txt3.insert(END,tg) txt3.insert(END,'\n') y1Data2=y1 elif text==mrus[2]:# -a,b + % zz=round((float(len(my_dictionary))*100)/(float(len(v))),0) tt=('In total of words (Text-3) --%i. New words --%i. Percent new words-- %i'%( len(v),len( my_dictionary),int(zz))) xData3 = ee yData3=e z=[1/w for w in ee] z1=[(1/w)**2 for w in ee] t=[ round(e[i]/ee[i],4) for i in range(0,len(ee)) ] a=round((sum(e)*sum(z1)-sum(z)*sum(t))/(len(ee)*sum(z1)-sum(z)**2),3) b=round((len(ee)*sum(t)-sum(z)*sum(e))/(len(ee)*sum(z1)-sum(z)**2),3) y1=[round(a+b/w ,4) for w in ee] s=[round((y1[i]-e[i])**2,4) for i in range(0,len(ee))] sko=round(round((sum(s)/(len(ee)-1))**0.5,4)/(sum(y1)/len(ee)),4) tg='Factor --a '+str(a)+' Factor--b '+str(b)+' Mistake of approximation-- '+str(sko)+"%"+"\n"+tt txt3.insert(END,tg) txt3.insert(END,'\n') y1Data3=y1 if mr==3: # + r12=round(sum([abs(yData1[i]-yData2[i]) for i in range(0,len(xData1))])/len(xData1),3) txt3.insert(END,"Average distances between art products of the author K--"+ str(r12)) txt3.insert(END,'\n') r13=round(sum([abs(yData1[i]-yData3[i]) for i in range(0,len(xData1))])/len(xData1),3) txt3.insert(END,"Average distance between art products of the authors K and M--"+ str(r13)) txt3.insert(END,'\n') plt.title('Distribution of frequencies of use of words in the text', size=14) plt.xlabel('Serial number of new words', size=14) plt.ylabel('Frequency of the use of new words', size=14) plt.plot(xData1, yData1, color='r', linestyle=' ', marker='o', label='Test art product of the author -') plt.plot(xData1, y1Data1, color='r',linewidth=2, label='Approximation of hyperbola y=(b/x)+a') plt.plot(xData2, yData2, color='g', linestyle=' ', marker='o', label='Comparable art product of the author -') plt.plot(xData2, y1Data2, color='g',linewidth=2, label='Approximation of hyperbola y=(b/x)+a') plt.plot(xData3, yData3, color='b', linestyle=' ', marker='o', label='Art product of the author -') plt.plot(xData3, y1Data3, color='b',linewidth=2, label='Approximation of hyperbola y=(b/x)+a') plt.legend(loc='best') plt.grid(True) plt.show() elif mr==2:# + r12=round(sum([abs(yData1[i]-yData2[i]) for i in range(0,len(xData1))])/len(xData1),3) txt3.insert(END,"Average distances between art products of the author K--"+ str(r12)) txt3.insert(END,'\n') plt.title('Distribution of frequencies of use of words in the text', size=14) plt.xlabel('Serial number of new words', size=14) plt.ylabel('Frequency of the use of new words', size=14) plt.plot(xData1, yData1, color='r', linestyle=' ', marker='o', label='Test art product of the author -') plt.plot(xData1, y1Data1, color='r',linewidth=2, label='Approximation of hyperbola y=(a/x)+b') plt.plot(xData2, yData2, color='g', linestyle=' ', marker='o', label='Comparable art product of the author -') plt.plot(xData2, y1Data2, color='g',linewidth=2, label='Approximation of hyperbola y=(a/x)+b') plt.legend(loc='best') plt.grid(True) plt.show() elif mr==1: # plt.title('Distribution of frequencies of use of words in the text', size=14) plt.xlabel('Serial number of new words', size=14) plt.ylabel('Frequency of the use of new words', size=14) plt.plot(xData1, yData1, color='r', linestyle=' ', marker='o', label='Test art product of the author -') plt.plot(xData1, y1Data1, color='r',linewidth=2, label='Approximation of hyperbola y=(a/x)+b') plt.grid(True) plt.show() def choice_text():# try: op = askopenfilename() f=open(op, 'r') st=f.read() f.close() if len(txt.get(1.0,END))==1: txt.insert(END,st) elif len(txt1.get(1.0,END))==1: txt1.insert(END,st) elif len(txt2.get(1.0,END))==1: txt2.insert(END,st) except: pass def array_text_1 ():# UNICODE if len(txt.get(1.0,END))!=1: u=txt.get(1.0,END) else: txt3.insert(END,"There are no text №1") return op=1 processing_subjects (u,op) def array_text_2 ():# UNICODE if len(txt1.get(1.0,END))!=1: u=txt1.get(1.0,END) else: txt3.insert(END,"There are no text №2") return op=2 processing_subjects (u,op) def array_text_3 ():# UNICODE if len(txt2.get(1.0,END))!=1: u=txt2.get(1.0,END) else: txt3.insert(END,"There are no text №3") return op=3 processing_subjects (u,op) def processing_subjects (u,op):# ( NLTK+corpusbrown) q= nltk.word_tokenize(u) qq=[w for w in q if len(w)>2] z=nltk.pos_tag(qq) m=[w[0].lower() for w in z if w[1]=="NN"] d={} for w in m: if w in d: d[w]+=1 else: d[w]=1 pairs = list(d.items()) pairs.sort(key=lambda x: x[1], reverse=True) modals=[] wq=10 for i in pairs[0:wq]: modals.append(i[0]) cfd = nltk.ConditionalFreqDist( (genre, word) for genre in brown.categories() for word in brown.words(categories=genre)) # genres=['news', 'editorial', 'reviews', 'religion', 'hobbies', 'lore', 'belles_lettres', 'government', 'learned', 'fiction', 'mystery', 'science_fiction', 'adventure', 'romance', 'humor'] sys.stdout = open('out.txt', 'w') cfd.tabulate(conditions=genres, samples=modals) sys.stdout.close()# f=open('out.txt', 'r') w=f.read() txt3.insert(END,w) f.close() sys.stdout = open('out.txt', 'w') cfd.tabulate(conditions=genres, samples=modals) sys.stdout.close() f=open('out.txt', 'r') b=0 u={} for i in f: b=b+1 if b>=2: d=i.split() c=d[1:len(d)] e=[int(w) for w in c] u[d[0]]=sum(e) for key, val in u.items(): if val == max(u.values()): tex="Text № -%i- Theme-- %s. Concurrences- %i"%(op,key,val) txt3.insert(END,tex) txt3.insert(END,'\n') f.close() cfd.plot(conditions=genres, samples=modals) def close_win(): tk.destroy() # tkinter + + + import tkinter as T from tkinter.filedialog import * import tkinter.filedialog import fileinput tk=T.Tk() tk.geometry('630x630') main_menu = Menu(tk) tk.config(menu=main_menu) file_menu = Menu(main_menu) main_menu.add_cascade(label="The comparative analysis of the art texts", menu=file_menu) file_menu.add_command(label="Choice of the texts", command=choice_text) file_menu.add_command(label="Definition of subjects of the text-1", command=array_text_1) file_menu.add_command(label="Definition of subjects of the text-2", command=array_text_2) file_menu.add_command(label="Definition of subjects of the text-3", command=array_text_3) file_menu.add_command(label="Definition of the author of the text", command=comor_text) file_menu.add_command(label="Exit from the program", command=close_win) lab =Label(tk, text="The text for comparison author -K ", font=("Arial", 12, "bold "),foreground='red') lab.pack() txt= Text(tk, width=66,height=5,font=("Arial", 12, "bold "),foreground='red',wrap=WORD) txt.pack() lab1 = Label(tk, text="The test author -K",font=("Arial", 12, "bold "),foreground='green') lab1.pack() txt1= Text(tk, width=66,height=5,font=("Arial", 12, "bold "),foreground='green',wrap=WORD) txt1.pack() lab2 = Label(tk, text="The text author-M", font=("Arial", 12, "bold "),foreground='blue') lab2.pack() txt2= Text(tk, width=66,height=5,font=("Arial", 12, "bold "),foreground='blue',wrap=WORD) txt2.pack() lab3 = Label(tk, text="Text results of comparison", font=("Arial", 12, "bold"),foreground='black') lab3.pack() txt3= Text(tk, width=66,height=6,font=("Arial", 12, "bold"),foreground='black',wrap=WORD) txt3.pack() lab4 = Label(tk, text="Minimum quantity of words in a window ", font=("Arial", 12, "bold"),foreground='black') lab4.pack() txt4= Text(tk, width=8,height=1,font=("Arial", 12, "bold"),foreground='black',wrap=WORD) wd=10 txt4.pack() txt4.insert(END,wd) lab5 = Label(tk, text="Maximum quantity of words in a window ", font=("Arial", 12, "bold"),foreground='black') lab5.pack() txt5= Text(tk, width=8,height=1,font=("Arial", 12, "bold"),foreground='black',wrap=WORD) wd=90 txt5.pack() txt5.insert(END,wd) tk.title('The analysis of the art text') x = (tk.winfo_screenwidth() - tk.winfo_reqwidth()) /4# y = (tk.winfo_screenheight() - tk.winfo_reqheight()) / 16# tk.wm_geometry("+%d+%d" % (x, y))# tk.mainloop() ')
Features of the program I developed:
- The possibility of separate analysis on the first and second Zipf law of each document.
- The ability to separately determine the genre of each document (implementation with the redistribution of data flow).
- Movable, dynamic window for selecting a site of rank or number of words directly in the process of analysis.
- Color marking of the analyzed documents with their graphic implementation.
- The ability to make changes to the document directly in the analysis process (if there are not identifiable characters in the document).
To test the work of the program, works of famous English-speaking writers were used.
A comparative analysis of the works of Dan Brown “The Davinchi Code” and “Angels and Demons” and Robert Ladlam “Borne Identification” is given.
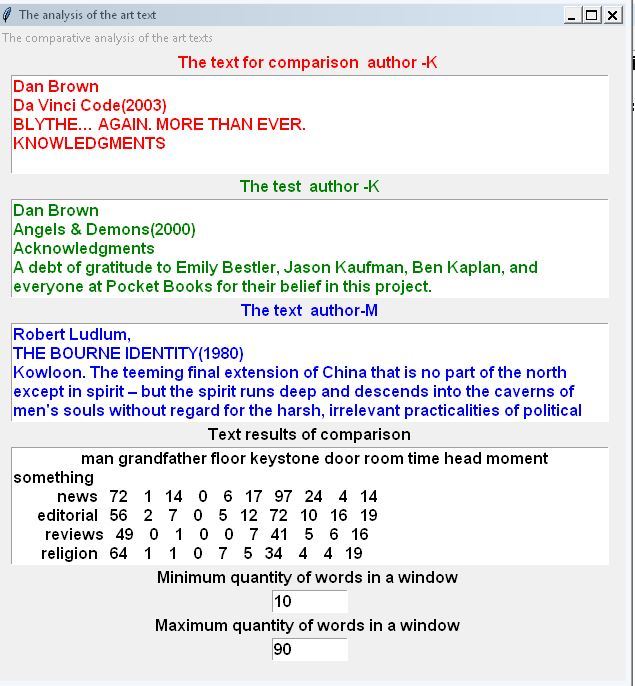
Program interface
Grimer for comparative analysis of authorship of the works of Dan Brown and Robert Ludlam.
Listing of results

Schedule
In the first two fields of the form we load different works of one author, and in the third of the other.
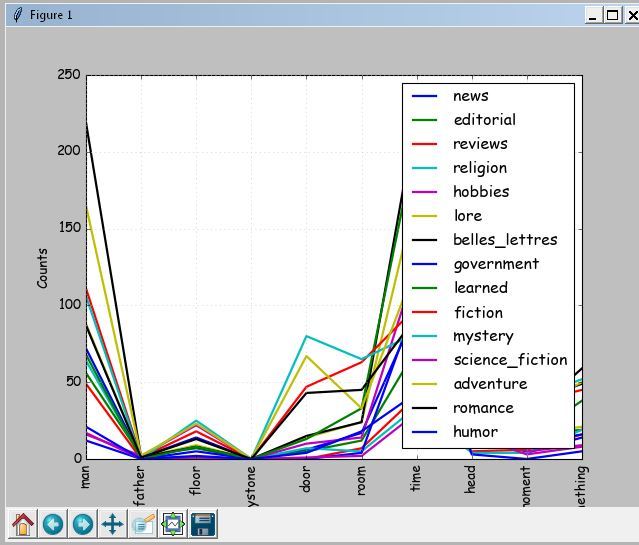
To determine the genre of works, select from the text of the work the key nouns or modal verbs. These can be either single words or phrases. From a specially marked body (I used Brown). The genre is determined by the maximum number of occurrences of the selected words.
Making sure that all the texts of one genre can begin to analyze the authorship. To solve particular problems, for example for analyzing technical texts, you can create your own database of topics.

Listing of results
Factor --a 91.184 Factor--b 2297.14 Mistake of approximation-- 0.0511% In total of words (Text-1) --81020. New words --11120. Percent new words-- 14 Factor --a 100.21 Factor--b 2869.22 Mistake of approximation-- 0.0965% In total of words (Text-2) --86079. New words --11868. Percent new words-- 14 Factor --a 154.162 Factor--b 4982.418 Mistake of approximation-- 0.0433% In total of words (Text-3) --128217. New words --10626. Percent new words-- 8 Average distances between art products of the author K--25.062 Average distance between art products of the authors K and M--138.25 Comparison chart
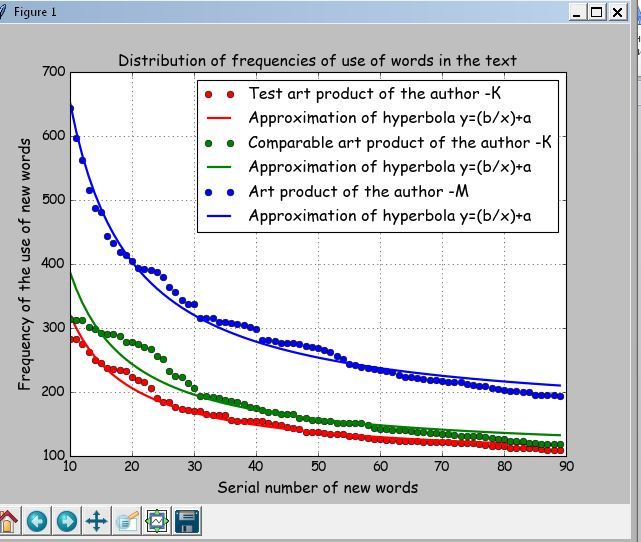
From the given printout and graphics, the authors' individuality is visible: K is green and red curves and M is a blue curve. The average distance between the approximating hyperbolas of the author K is 25.062, and between the first work of the author K and the product of the author M - 138.25.
The program builds a fragment for the number of words from 10 to 90 according to the second Zipf Law ─ “quantity - frequency” [4]. Zipf found that the frequency and number of words in the text with this frequency are also related.
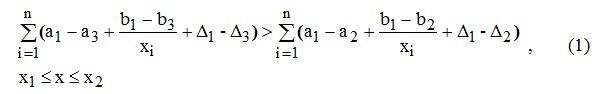
Special formula
 ─ hyperbolic approximation coefficients and approximation errors for the author K;
 ─ coefficients of hyperbolic approximation and approximation error for the author M;
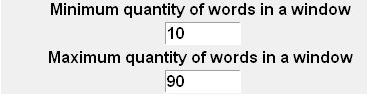
 ─ The range for the number of words is adjustable during the analysis of the graph.
Inequality (1) I checked on 50 triples the works of English-speaking authors. I have no more statistics. Those who want inequality (1) in justice can check it with their examples.
Conclusion
The implementation of the method of determining the authorship of texts in terms of the frequency of using new words in Python is considered. A formula is given for a comparative analysis of three texts, two of which are by one author and the third one. An example is given for a comparative analysis of works by Dan Brown and Robert Ludlam.
Links
- Authorship of writers can be recognized by a special formula .
- This article was published on January 1, 1988 in the Literary and Linguistic Computing Volume Report.
- Simple Python program for hyperbolic approximation of statistical data
- Zipf (Zipf) Laws
Source: https://habr.com/ru/post/323206/
All Articles