ClickHouse: very fast and very convenient
Victor Tarnavsky shows that it works. Before you decrypt report Highload ++ 2016.
Hello. My name is Victor Tarnavsky. I work at Yandex. I'll tell you about a very fast, highly fault-tolerant and super-scalable ClickHouse database for analytical tasks that we developed.
')
A few words about me. I am Victor, I work at Yandex and I lead the department that develops analytical products such as Yandex.Metrica and Yandex.AppMetrica. I think many of you have used these products and know them. Well, in the past, and still I write a lot of code, and before that I was still developing iron.
What will happen today?
I will tell a little story: why we decided to create our own system, how it came to life such that in the modern world, in which seemingly there is a solution for any task, we still needed to create our own database. Then I will talk about what features are now in ClickHouse, what it consists of, and what features it has that you can use. Then you want to dive a little deeper and tell you what decisions we made inside ClickHouse, and what it consists of, and why ClickHouse works so fast. And in the end I want to show how ClickHouse can help you personally or the company you work for, what tasks you should use it for, what cases you can build around ClickHouse.
A bit of history
It all started in 2009. Then we made Yandex.Metrica, a web analytic tool. That is such a tool that the owners or developers of sites put on their site. This is a piece of JavaScript, it sends the data to Yandex.Metrica. Then in “Metric” you can see the statistics: how many people were on the site, what did they do, whether they bought a refrigerator and all that.
And from the point of view of developing a web analytic system, this is a challenge. When you develop one service or some product, you design the load so that it can withstand some RPS and other parameters of this one service or product. And when you develop a web analytics tool, you need to withstand the workload of all sites that your web analytics tool is on. And in the case of "Metrics" - this is a very large scale: tens of billions of events that we take every day.
Metric is on millions of websites. Every day, hundreds of thousands of analysts sit and look at the Metrics interface, request some reports, choose filters and try to understand what is happening on their website, whether this person bought this refrigerator or what is happening. According to external data, Metrica is a system that is one of the three largest players in this market. That is, the number of sites that we have and the number of people Metric sees is a product from the top, there are practically no larger products.
In 2009, Metric did not look like this:
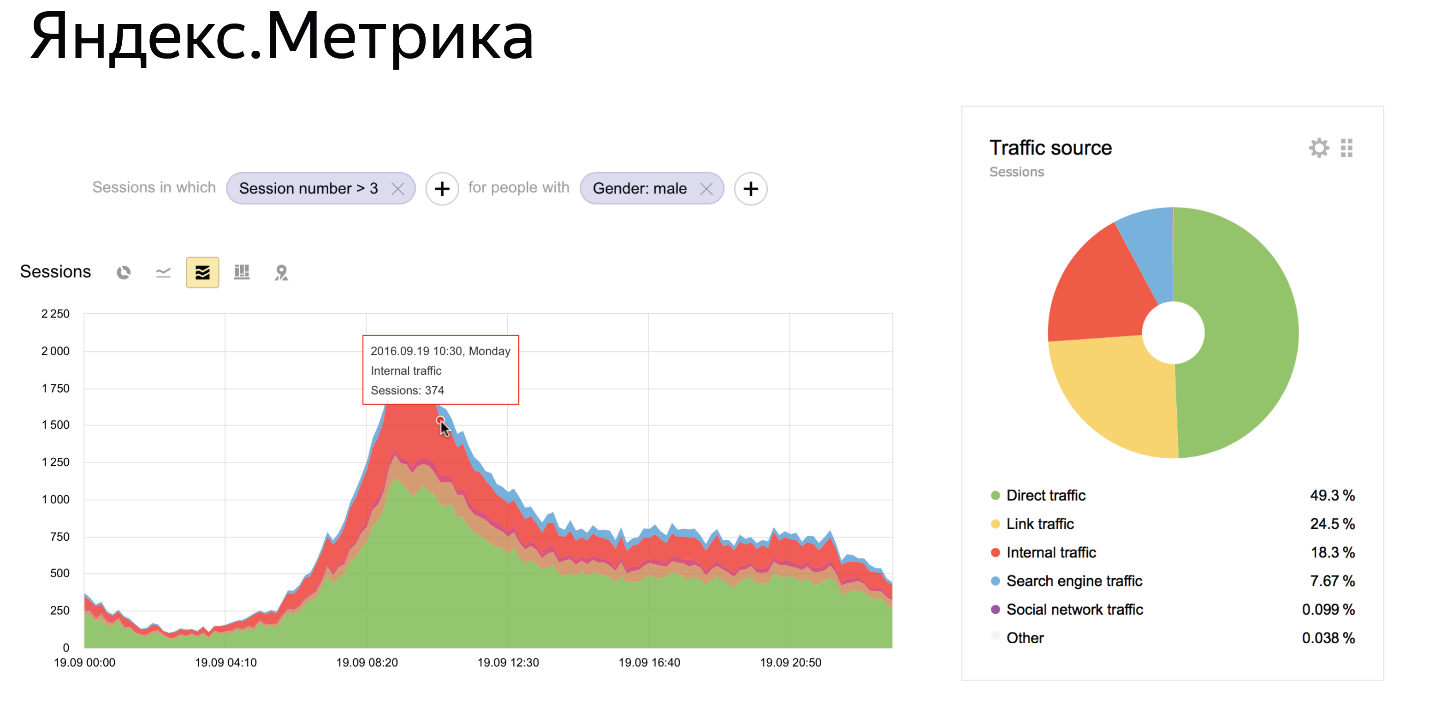
This is her current state. It is seen that in the "Metric" there is a lot of things. There are Dashboards on which you can build your reports. There are graphics that allow you to build something in real time. There is a complex system of filters with which you can view the data in any slice. For example, to look at data only for girls or only for people who came from Zimbabwe is something like that.
The question arises - how to store data to realize all these features?
And in 2009, we lived, as we call it, in a world of “classical” aggregated data. What does this look like?
Suppose you want to build a report on the floor. As you know, there are three genders in the world: male, female and “undefined”, when we were unable to understand which sex a person has. You take your favorite database, make a column with the floor in it, make it enumerate any of the three values, make a column with the date, because you need to build a graph, and make columns with metrics that you think are: number of people, number of events For example, visits to the site, the number of refrigerators purchased, and so on. For example, on Cron, once a day, recalculate such a record and write new lines to MySQL, and everything works successfully.
In 2009, we lived in such a paradigm. Therefore, for each report that we did, we created, in fact, a new such table. And in the case of "Metrics" there were more than 50 similar different tables with different pre-aggregated key. Our system was significantly more complicated. We knew how to do it in real time. We were able to withstand any load, but nevertheless the meaning remained the same.
The problem with this approach is that it’s impossible to implement such an interface over this data structure. Because if you wrote down on your plate that the male gender, the date of such and such, 4 refrigerators were bought, then you will not be able to filter this data, because the number 4 is written there and it is not known how many of these people are of any age. Therefore, over time, we came to the concept of a non-aggregated approach.
It looks like this. We keep a small number of very wide tables of original events. For example, in the case of Metrics, these are page views. One line means one page view, one page view has a lot of different attributes: a person's gender, age, a refrigerator is bought or not, and some other columns. In our case, in the views we record over 500 different attributes for each view.
What does this approach allow you to do? It allows you to build any reports on top of this data model. Data can be filtered and grouped in any way, because you have all the parameters, you can calculate anything. It turns out a small number of tables, in the case of "Metrics" they can be counted on the fingers of one hand, but they have a very large number of columns.
Problem of this approach
We need a database that allows for such a wide and long table - because it is obvious that it will be longer than the aggregated data - to read any queries quickly.
Select DBMS
This was the main question that we had in 2009. Then we already had our own experiments. We had such a system, we called it All Up. There were already non-aggregated data in it, and if someone remembers the old “Metric”, it contained a report designer, in which you could select some filters, measurements, and build an arbitrary report. He was just on top of this All Up system. She was simple enough, she had many flaws, she was not flexible enough, not fast enough. But she gave us the understanding that this approach is in principle applicable.
We began to choose bases, we formed some requirements for ourselves. We realized that we have about such a list of requirements.

Of course, we need to fulfill requests as quickly as possible. Because our main product advantage is to fulfill requests for large amounts of data as quickly as possible. The larger the site for which we can quickly read the data, the better. So that you understand the pattern: a person looks at the interface in "Metric", changes some parameters, adds filters. He wants to get a result quickly, he does not want to wait until tomorrow, or half an hour, until it comes to him. You need to do these requests in seconds.
Need real-time data processing. As at the level of this request, when a person is sitting and wants to quickly see the result, so is the level of time that passes between buying a refrigerator on the site and the moment when the site owner sees that the person bought this refrigerator. This is also a very important advantage, for example, for news sites that produce some kind of news and want to quickly see how fast it is growing. We need a system that allows you to insert this data in real time into the database and in parallel with this take out fresh results and aggregated data from there.
We need the ability to store petabytes of data, because we have them. "Metric" is very large - the volume is measured in petabytes. Not every base can scale this way. For us, this is a very important parameter.
Fault tolerance in terms of data centers. Well what does this mean?
We live in Russia and saw a lot of things. A tractor periodically arrives and digs up a cable that leads to your data center, and then quite unexpectedly the same day, an excavator arrives and digs a backup cable into your other data center, which is located 100 kilometers away. And okay, if I was joking like that. But it really was. If, sometimes, a cat crawls into a transformer, it explodes. Sometimes the meteorite falls, destroys the data center. In general, everything happens - the data centers are turned off.
In Yandex, we design all of our services in such a way that they live — not degraded in their product characteristics when the data centers are turned off. Any of the data centers can shut down and services must survive. At the database level for Metrics, we need a database that can survive when the data center drops, which is especially difficult given the previous points, about storing petabytes of data and real-time processing.
We also need a flexible query language, because Metric is a complex product and we have many different combinations, reports, filters, and everything. If the language is similar to any Mongation DBO aggregation API - if someone tried to use it, then this one does not suit us. We need some kind of language that is convenient to use, so this was one of the key criteria for us.
Then it was about how? There was nothing on the market. We managed to find bases that implemented a maximum of three of these five parameters, and then with some stretch, and even five were out of the question. We had the creation of the All Up system and we realized that we seem to be able to build such a system ourselves. We started prototyping. Began to create a system from scratch.
The main ideas that we pursued when creating a new system and it was initially clear that it should be SQL . Because its flexibility is enough for our tasks.
It is clear that SQL is an extensible language, because it is possible to add some functions to it, even some super-turnings to do. This is a language with a low entry threshold. All analysts and most developers are familiar with this language.
Linear scalability. What does “linear” mean? Linear means that if you have a cluster and you add servers to it, then performance should increase, because the number of servers has increased. But if you take some more typical system that doesn’t scale well enough, you can easily find out that you are adding a server, and then you make a request at once for the entire cluster and the performance will not increase. Go
You are lucky if it is the same, but in most cases it will also fall over time. This does not suit us.
Initially, we designed the system with a focus on fast execution of requests, because, as I said, this is our main feature. From the point of view of system design, from the very beginning it was clear that this should be a Column-oriented - column solution. Only a rolling solution is capable of realizing everything that we need, covering all our needs.
And we started to create, started to prototype. In 2009 , we had a prototype that did some simple things.
In 2012 , we began to transfer parts of our production to ClickHouse. Production elements appeared that started working on top of ClickHouse.
In 2014 , we realized that ClickHouse has grown to a state where you can create a new generation product. Metrica 2.0 on top of ClickHouse, and we started copying the data.
This is a very nontrivial process, if someone tried to copy two petabytes from one place to another, it is not very easy - it cannot be done on a flash drive.
In December 2014 , we launched a new “Metric” on top of ClickHouse - it was a direct breakthrough, segmentation, a bunch of features, and it all worked on top of this base.
A few months ago , in June, we posted ClickHouse in Open Source. We realized that there is a niche and everything is still on the market. I had a website about “nothing on the market”, now we are still close to this situation, little has changed. There are not many good solutions for this task on the market. We realized that we were on time - we can now put in Open Source and bring a lot of benefit to people. Many tasks are now very poorly solved, but ClickHouse solves them very well.
It somehow happened by an explosion. Of course, we expected some great effect from the fact that we laid out Open Source. But what happened exceeded all our expectations. Before that, we had many Yandex projects that were implemented at ClickHouse, but right now, when we posted, we started writing about us everywhere.
Where about us just did not write: on HackerNews, on all specialized publications. A lot of large companies began to ask us, a bunch of smaller companies, about new solutions. Someone has already tried to do, and right now the status is such that ClickHouse uses, I can say - more than a hundred different companies outside of Yandex. Either at the stage of ready-made prototypes, or already in production. There are companies that use ClickHouse right in production and build pieces of their services on top of ClickHouse.
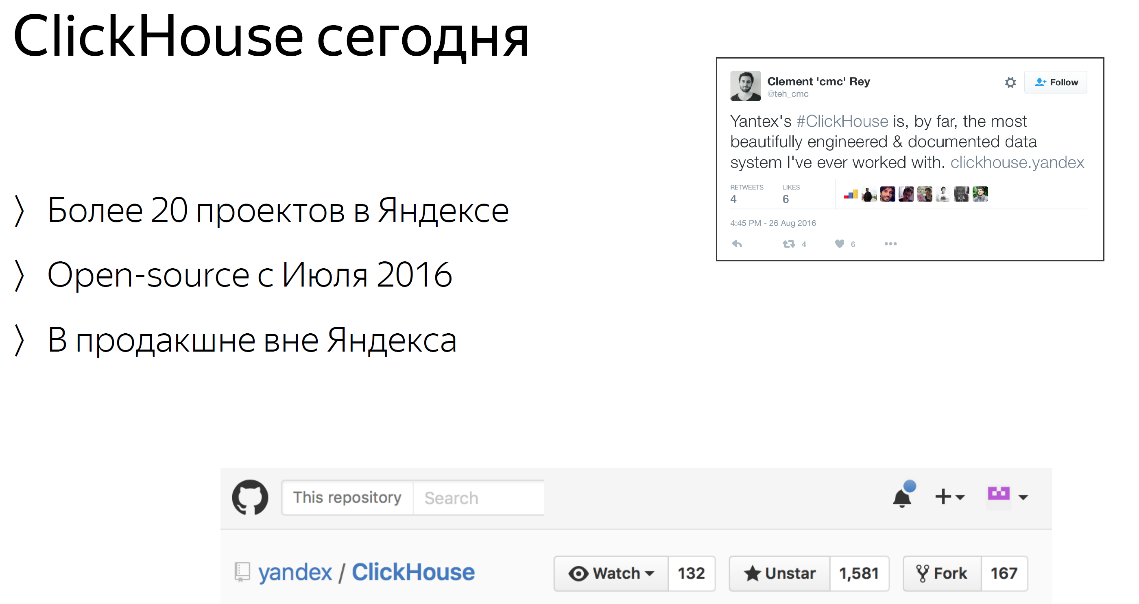
We received 1500 stars on GitHub - but this is an outdated slide, now there are 1800 of them. The metric is so-so, but just in case I can say for comparison that Hadoop has 2500 stars. You see, level. We will soon overtake Hadoop, I think and then there will be something to talk about.
Indeed, there are a lot of activities happening now. We are starting to arrange all sorts of mitaps and we will arrange them, so come and ask.
What are the possibilities
What am I talking about?
Linear scalability is a very important advantage of ClickHouse compared to similar solutions. Out of the box, ClickHouse can scale linearly and you can build a very large cluster and everything will work well. For example, because it works very well with us. Petabytes of data - building a petabyte cluster on ClickHouse is not a problem. Out of the box, cross-datacenter works, for this you don’t need to do anything and he initially thought of as a cross-datacenter solution. In our “Yandex” we mainly use such clusters.
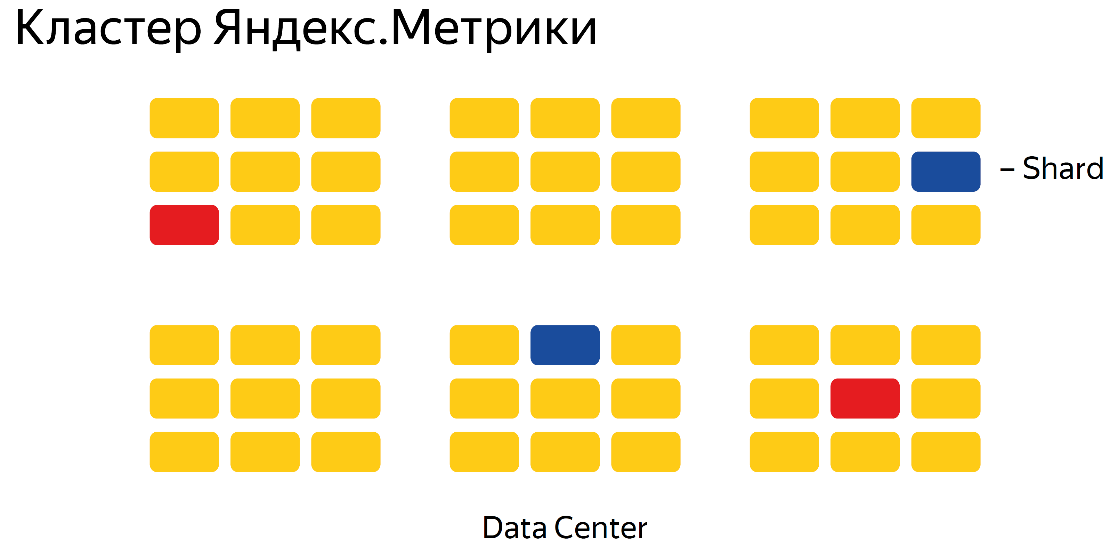
High availability means that your data, and in general a cluster, both for reading and writing, will always be available. In this sense, ClickHouse is such a constructor - you can build a cluster with any guarantees you need. If you want to withstand a datacenter drop, you typically set up a cluster in the three datacenters with a replication factor of x2. If you want to build a solution - a cluster that withstands the fall of a data center and a single node, this usually means that you need to take the x3 replication factor and build on the basis of at least three data centers. This is a fairly flexible system, you can build any guarantee if you know how.
Data compression. ClickHouse is a column system, which in itself means that data compression works very well. Because the sense of a convoluted solution: data from one column is stored, in fact, in one file on a hard disk and, if there is approximately the same written, then it is compressed very efficiently - and if you store it line by line, then everything goes there and compressed enough badly.
In ClickHouse, a sufficiently large number of optimizations have been applied on this topic, and therefore the data is compressed very well. If you compare it with a regular database, or with Hadoop, or something else - the difference from a dozen to a hundred times is easy. Usually, we have a problem with this: people try ClickHouse, upload data there, look at how many places they are working on and such “it seems I haven’t downloaded everything”, they also looked - everything seemed to load. In fact, very effective compression - people do not expect this.
On the example of the Yandex.Metrica cluster:
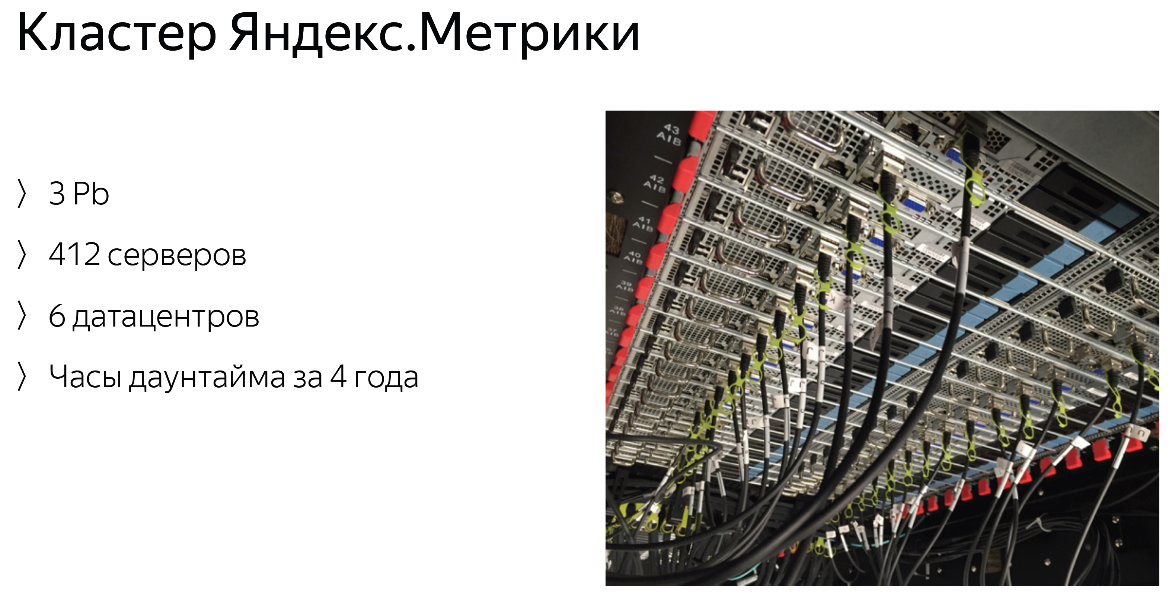
We have several clusters - this is the largest of them. We have 3 petabytes right now, 3.4 or something - the slide is outdated, there are 412 on it, and now there are already 420 servers. We are increasing them slowly. The cluster is spread over six data centers in different countries. Despite the complex configuration, the cluster has some units of downtime hours during the whole period of its existence. This is a very small and incredible number of nines. This is all despite the fact that we post each time the most recent version of ClickHouse, with the largest number of bugs, apparently, but this did not prevent us from providing the required guarantees.
This shows that this solution can work 24/7 without any problems. Yes, Metrika works 24/7, we have no maintenance periods.
Requests
Yes, SQL is supported. SQL is, in fact, the only way to ask ClickHouse anything. Strictly speaking, this is a SQL dialect, because there are some differences from the standard, but in most cases, if you make some kind of SQL query, it will most likely work fine. There are various additional functions for approximate calculations, when you can sacrifice accuracy - but the query will work faster or fit into memory. There are a lot of various functions for different data types, for example, for a URL - there are obviously many URLs in Yandex.Metrica and there is a whole large set of functions for working with URLs: you can pull out a domain, decompose some paths, parameters. For each data type there is a large set of functions. In "Metric", probably, there is a variety of data and most likely, for almost all types of data, there are already all the possibilities.
Out of the box, arrays and tuples are supported . This means that you can create a table in which in one of the columns there is not an column, but an array. This may be just an array, for example, many numbers, and maybe a tuple is an array with a complex structure of several fields. Array support works at the query level — at the base schema level, from top to bottom, and there are many functions for working with arrays that allow you to work with them effectively. You can, for example, propagate the rest of the data on this array, or you can extract any information from the array. There is even a special lambda syntax that can be used to map to an array or filter to an array, such things.
Out of the box, all requests work distributedly, there is no need to change anything, you need to specify another label in which it will be distributed - it will work at the level of the entire cluster.
There is also such a feature as external dictionaries. Such an opportunity, which I would like to say a little separately. When we developed it, in “Metric” it solved the problem well, probably, 80% join. They simply ceased to exist. What's the point? Suppose you have a main data plate, and there are some identifiers in it - suppose this is an identifier of some customer. There is a separate directory that translates this identifier into the name of the client. Enough classic situation. What does it look like on plain SQL?
You do join - correctly, do join of one on another and translate ID in a name if you want to receive as a result a name. In ClickHouse, you can connect this table as an external dictionary using a very simple syntax in the config file - after that, at the query level, you can specify just a function that will translate this identifier into a value, or some other fields that you have in this remote table.
What does this mean? This means that if you make a select from the main table, for example, a set of identifiers, 5 pieces - to translate these identifiers into some kind of decoding question of one function. If you did this through join, then you would have 5-6 join, which looks terrible. In addition, external dictionaries can be connected from any database, from MySQL, from a file — from any database that supports ODBC, for example, from PostgreSQL. This allows these names to somehow be updated, which will immediately pick up at the request level. Incredibly handy feature.
A couple of sample queries:
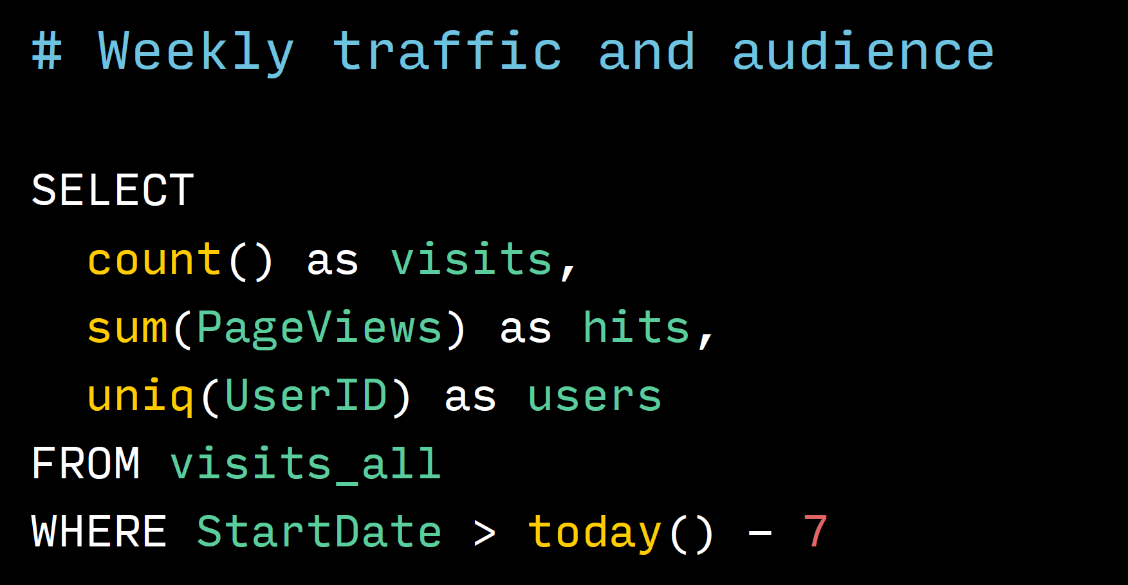
This is a request that takes traffic and audience size, that is, the number of users from the Metrics cluster per week. It can be seen that this query is quite simple, plain SQL. There is nothing special here, only count is written without an asterisk, with an asterisk if anything is possible, but we are used to writing so.
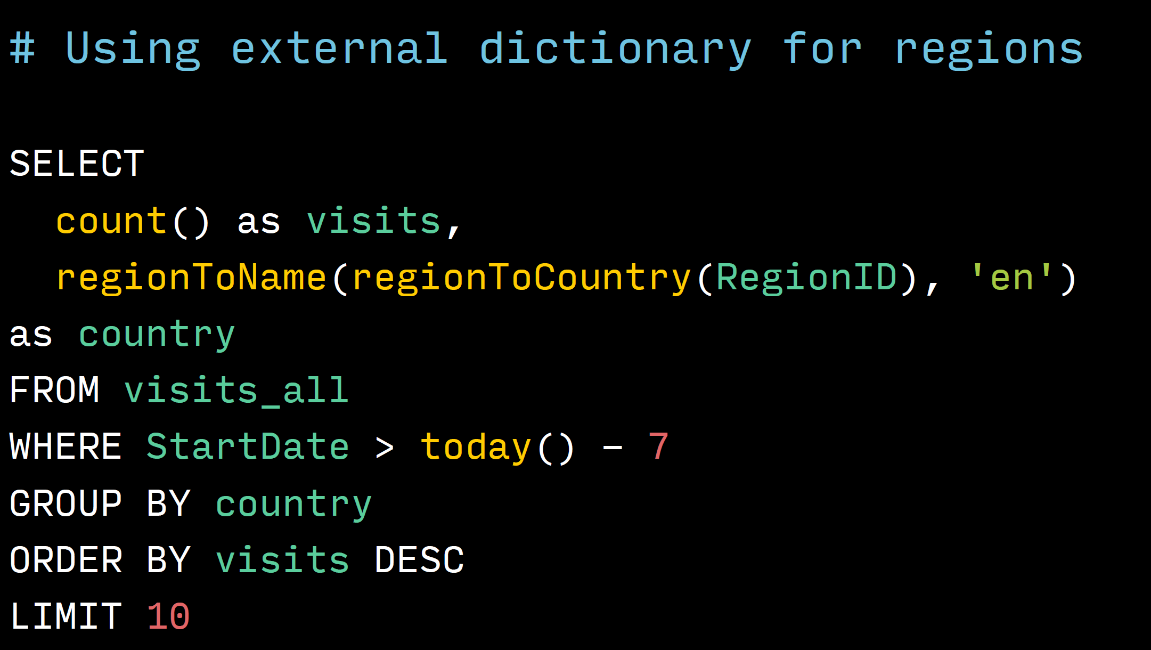
This is an example of using external dictionaries. If you look at where the regionToName line is in this line, we translate the RegionID - the identifier of the region where the person was. First in the country id where it was. We have a directory from the region to the country, and then in the name of the country in English. As you can see, this is a call to two functions, very clear and very simple. On classic SQL, this would be two JOINs and the query would not fit into this slide, and would have had to split it into three slides. Very easy work.
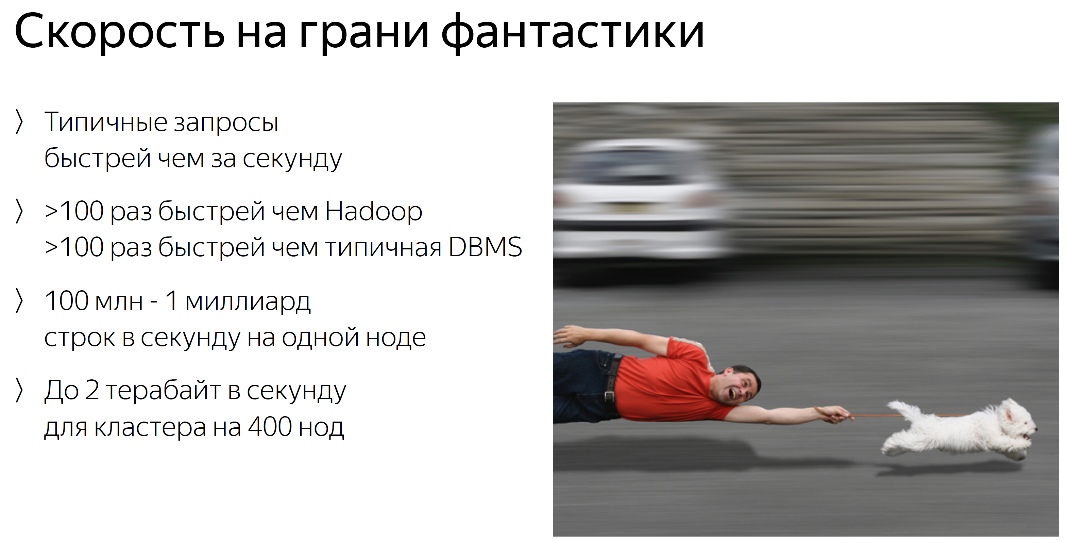
Speed
The most important feature of ClickHouse is speed. The speed is incredible. I think everyone has some expectations on how ClickHouse can work. People come to us with their own expectations - you have any expectations. Most likely, ClickHouse exceeds your expectations - this is the case with all the people who come to us.
Typically, typical queries run faster than in a second, even on the scale of a Metrics cluster, that is, petabytes in less than a second — despite the fact that our data is stored on regular (non-solid-state) hard drives.
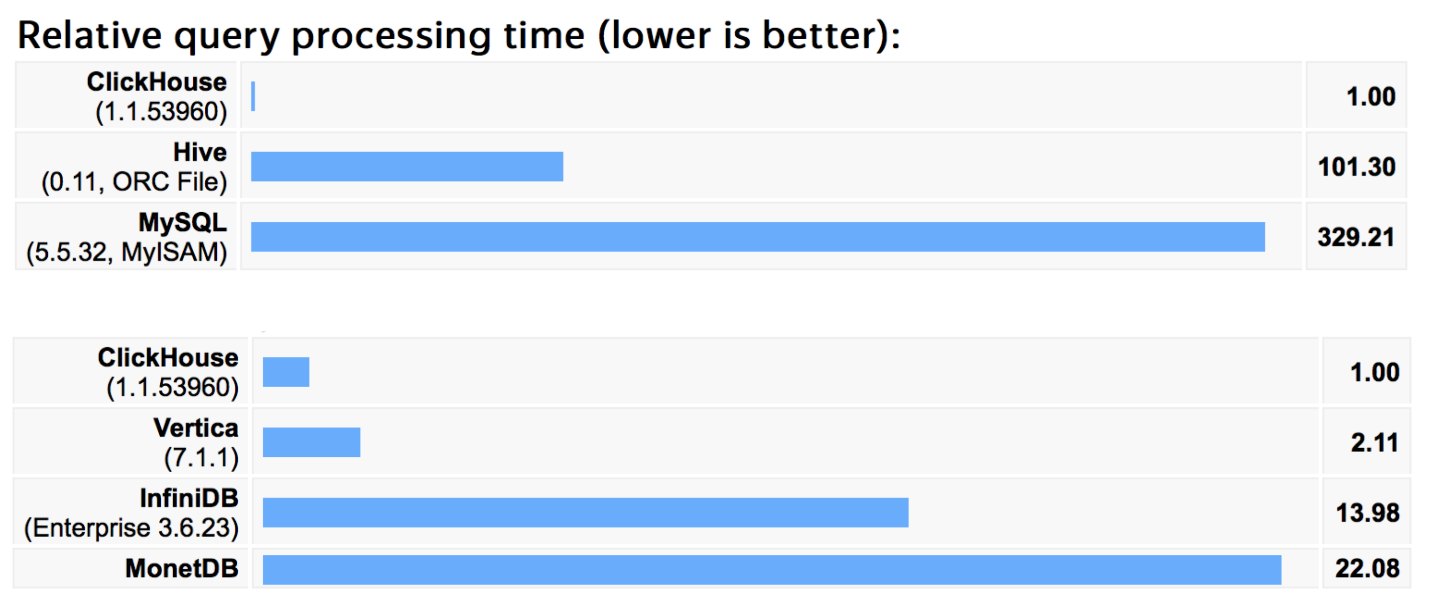
When compared with conventional databases, the gain is hundreds of thousands of times compared to Hadoop, MySQL, PostgreSQL. It will produce results hundreds of thousands of times higher. This is a reality - we have benchmarks, I will show later.
Some cool numbers, up to 1 billion lines per second - ClickHouse can process on one node, which is quite a lot. On the scale of the Metrics cluster, 1 request can handle up to 2 terabytes per second. You can imagine what 2 terabytes are - these are hard disks, now there are only 2 terabytes into it, and they are 4 TB, but less so. And then in the second this amount of information is processed by the cluster "Metrics".
And what's the point? Why this speed is so important
It is important, approximately, that's why:

This changes the approach to work completely. Especially for analysts and people who dig into data science. Here it is fashionable now.
How does it usually work
They make a request to the classical system, to Hadoop, for example, or to a MapReduce of some kind. Make a request, click OK, take a mug and go to the kitchen. And in the kitchen they are there flirting with someone, talking with someone, returning back in half an hour, and the request is still being executed or has already been completed, but only if they are lucky.
In the case of ClickHouse, they start to switch to ClickHouse and it looks like this: type a query, press Enter, take a mug, go and notice that the query has already been completed - and they are “okay, wait a minute”, put a mug and once again make a request some other, because they have already seen that something is wrong there, and it is also executed and they make the request again and again, they are included in the cycle.
This completely changes the approach to working with data, you get the result instantly - well, literally in seconds. This allows you to check a huge number of hypotheses very quickly and look at your data and so, and syak, from one angle, from another angle. Doing research incredibly quickly or investigating any incidents that you have happened very quickly.
We even have a problem with this within the company. Analysts, they try ClickHouse, for example, a cluster of "Metrics" or some other cluster. Then they become infected with some infection, go to Hadoop or some MapReduce and can no longer use it, because it is too slow for them. They already think differently. They go and say to everyone: “We want data in ClickHouse. ClickHouse» .
ClickHouse, , , MapReduce. MapReduce , ClickHouse - , .
, . , , «.». , — . , «», : select group by, , set .
, Hive MySQL — - , , , , .
— , , , , Vertica. Vertica , , - .
ClickHouse , 2 . .
: https://clickhouse.yandex/benchmark.html
— ClickHouse.yandex. — «» .yandex — , , . , .
Interfaces
- ClickHouse. — , . . — HTTP, : , . .
HTTP JDBC , Open Source. Java, Scala — environment. , . , — .
: « ClickHouse ? ? ?» . - , , — . .
- , performance , . ClickHouse — , , . — , . — - , , - SSE--- . .
— , , , , , . Merge Tree , — , , ClickHouse. , - , — . seek- — . ClickHouse , «» , SSD .
. , ClickHouse , - . , , ClickHouse cross-datacenter environment — .
, ClickHouse , .
.
: , , 10 % 1 %. — , 1% , , 100 . Very comfortably.
— - . , — , , .
, ClickHouse , , , - , .
. , - , -. — ClickHouse , , , . .
ZooKeeper , leader election . , ZooKeeper RPS. , , .
«.»:
6 . , , 2 . — . 3, 3 .
. ClickHouse?
, ClickHouse . . ClickHouse OLTP , — - , - , ClickHouse. : PostgreSQL, MySQL, . ClickHouse , - real-time . ClickHouse key-value . , storage - . , - .
ClickHouse — document-oriented , , ClickHouse . create table . , — ClickHouse .
ClickHouse . , — . , ClickHouse — , . — SRDT, , . ClickHouse , , , , , ClickHouse — .
ClickHouse?
ClickHouse, . ClickHouse, , . — .
, , — ClickHouse . «» : , , RPS.
, . «» - 20 . , , . ClickHouse , .
, . , . ClickHouse ( ).
. — , .
access- daemons, , ClickHouse. Everything. , Python Bash, .
? . - - — , DDoS- . select . , . , «» ClickHouse . incident reporting -.
, — Data Warehouse.
- , : Oracle, PostgreSQL, - . , — , . . , Hadoop, , - Hadoop , .
What can be done?
ClickHouse, , — , , ClickHouse , . . , , — . , . . , , - dashboards ClickHouse. , , . . ClickHouse , , , Hadoop.
Where to begin?
tutorial — , , ClickHouse, tutorial - . , , , . . ClickHouse 2 .
, .
GitHub — . , .
Google group . ClickHouse.yandex , , — .
Total
Open Source apache2. .
, . , — ClickHouse.
SQL c .
.
: ClickHouse: .
Source: https://habr.com/ru/post/322724/
All Articles