Visualization of JavaScript exchange sorting algorithms
Good day to all readers and authors habrahabr.ru . Speech in this article will go about the visualization of the simplest sorting algorithms.
I was inspired to do this work by Timo Bingmann - a graduate student from the Institute of Theoretical Informatics and Algorithms at the Karlsruhe Institute of Technology (Germany) [1] . Tim wrote an excellent article where you can read a little about the history of visualization and auditing of algorithms [2]. Programmers, more than anyone else, know how difficult the process of understanding abstract entities is and how much metaphors and visualization methods help. When a real-life object is similarly assigned properties and methods of virtual objects.
Algorithm selection
I admit to the reader that programming today is not my profession. Of course, I already had some acquired skills. This is BASIC in 2007. (then I comprehended the branching, data types, arrays, toughness of the GOTO operator, convenience of subroutines and for the first time wrote a program that emulates an ideal gas in a closed vessel. If you do not know or do not remember, in the standard BASIC package, as a base, there was a program for sorting [3 ] ). Another experience was Pascal in 2012. At the institute, in the framework of studying discrete mathematics (they wrote the Fibonacci sequence, operations with stacks and basic sorts). Based on my experience, it was decided to start with exchange sorts as something familiar and simple. Below I describe a little more, what difficulties I had to face when rendering other types of sorts.
Selection of tools
Below are the tools used to create the visualization of the above algorithms.
The programming language is javascript.
“A rather unusual choice!” - you will say and you will be absolutely right. Indeed, today there are many programming languages and libraries for them that are suitable for the task much better. For example, C ++. With the use of C ++, you can manage memory, as well as draw graphics on the screen using much less computer resources. I will not go deep into the reasons that my life situation requires my quickest retraining from a science researcher to a Web tech. Expert, in whom JavaScript is used everywhere, because the article as a whole will be too sad and will give unnecessary reasons for discussion in comments. It was decided to combine business with pleasure, brush up on their academic knowledge and learn some of the above scripting language for web pages. And yet, for objectivity, we list the positive and negative sides of the choice:
Pros:
- The first and very obvious plus is the interpreter accessible to all users. If to view the work of Timo Bingmann you need to download the executable file on the machine [4. Downloads / Open source section] . That for the execution of the program in JavaScript language is sufficiently installed browser in your electronic device.
- It's easy to share your creativity with friends (just throw them a link to the demo in social networks)
- Easy UI design via HTML5 / CSS3. This bundle quickly and reliably allows you to place the controls of the program.
Minuses:
')
- The first plus carries with it negative traits - the interpretation and execution of the code on the client’s machine leads to a load on the client’s CPU and RAM. For the execution of the program RAM is required not so much (about 1.5 MB). But the CPU i5 from Intel machine of your author, at the highest speed with the tests was loaded by 35%. Consequently, we do not exclude brakes and jams on weak machines and android-devices with low productivity.
- Since CANVAS uses hardware acceleration [5] we do not exclude the load on the GPU.
Visualization and display on the screen - HTML5 element: CANVAS.
CANVAS is a canvas on which you can draw objects using commands from the js script. This method has its drawbacks, such as poor scalability when changing the scale in the browser, in contrast to the vector SVG (which is always perfect at any scale). But since in our case, all the program logic is in the js-file - it is difficult to find an element more suitable for our task. CANVAS also has obvious advantages, for example, scaling through CSS, which automatically also scales the coordinate system, which allows us to perform some adaptability without loss of quality using media queries. Already not bad! Also, the CANVAS element can be saved from the page by clicking on the canvas with the right mouse button and selecting “save” in the context menu. This concludes the conversation about the tools and proceeds, in fact, to the program itself.
Pseudocode of the program:
1. Declare all global variables.
2. Connect CANVAS for visualization.
3. Enable Web Audio API. and AudioContext () for auditing.
4. Get the initial values from the controls in the HTML markup and write them to variables.
5. Based on the initial values, generate an array of elements and wait for commands from the user.
6. When you click the "Reset" button, erase the canvas and count the new array of elements. Display a new array on the screen.
7. When you click the “Play” button, start sorting by the type specified in the settings panel. Change the button to "Pause". When you press the "Pause" button, pause the sorting. And change the button to "Play".
8. When changing the values of the Change Speed slider, change the sorting speed.
9. When changing the sorting type on the settings panel, pause the sorting if the sorting process is initiated.
10. When changing the sorting display type, change the drawing sequence in CANVAS. Without stopping the sorting process.
11. If the sorting is completed, reset all the counters, change the “Pause” button to “Play”, go through the array again in green, visually confirming the completion of the sorting and wait for further actions from the user. (In fact, at this moment the sorting is already completed. This item is made purely for aesthetic reasons and with a discount on human perception)
Ui
As mentioned above, we will use HTML5 and CSS3 to create UI in the browser, we will need the following elements:
- Headline Nuff said [6]
- Control Panel.
A block with settings sliders and a drop-down list for selecting the sorting type will be placed here. We will immediately link the events to our sliders and the list in order to ensure that the necessary functions are invoked in the JavaScript code:HTML<!--settings & ranges --> <div class="settingsPanel"> <form> <label class="label">Chose sort algorithm type:</label><br> <select name = "sortTypeDom" class="softFlowSelect" onchange="changeSortType()"> <option value = "combSort">Comb sort</option> <option value = "bubbleSort">Bubble sort</option> <option value = "cocktailSort">Cocktail sort</option> </select> </form><br> <label class="label">Settings:</label><hr> <div class="settingsRange"> Sphere Radius & Lines height / Brightness<br> <input title="Sphere Radius" class="rangeCSS" type="range" min="30" max="150" step="1" value="75" oninput="changeRadius()" id="sphereRadius"><br> Number of elements<br> <input title="Number of elements" class="rangeCSS" type="range" min="30" max="240" step="1" value="125" oninput="calcNewArray()" id="elementsNumb"><br> Speed<br> <input title="Speed" class="rangeCSS" type="range" min="10" max="200" step="5" value="105" oninput="changeSpeed()" id="codeSpeed"><br> Volume<br> <input title="Volume" class="rangeCSS" type="range" min="0" max="0.05" step="0.0005" value="0.025" id="volume"> </div> </div> - Buttons start, reset and type of display.
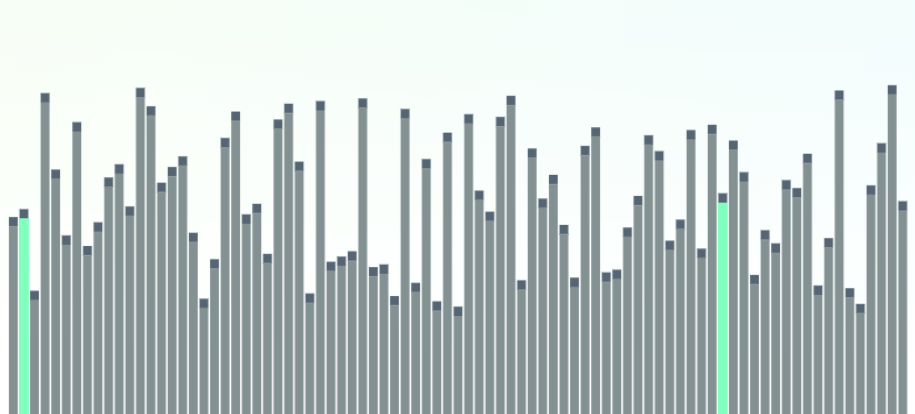
We will use three types of displaying sorting on our canvas, in addition to offsetting the order of columns along the length (which has already become a classic), this will be a gradient from dark to light according to the degree of intensity and a circle with a shift of the order of columns along the length. This will be a small new contribution to the sorting visualization. Obviously, we will need buttons to change the display type, and we will need the “Play” and “Reset” control buttons. Most of the classes in the following code are simply used for styling:HTML<div class="sortButton transition" id = "roundView" onclick="changeSortView('roundView')"> </div> <div class="sortButton transition" id = "classicView" onclick="changeSortView('classicView')"> </div> <div class="sortButton transition" id = "gradientView" onclick="changeSortView('gradientView')"> </div><br> <div class="buttonContainer"> <div class="playButton button transition" id = "firstButton" onmousedown="mouseDown()" onclick="startButton()"> <div class="sprite-play"></div> </div> <div class="resetButton button transition" onclick="calcNewArray()"> <div class="sprite-reset"></div> </div> </div><br>
Transition is a unique property added in CSS3 that allows for smooth change between two element states. I will not describe the obvious design in this article, because it does not represent any interest, focusing only on the transition. The transition class looks like this:.transition { transition: 0.4s; }
Well, from the interesting, this is of course the scaling of the CANVAS canvas in CSS3. As mentioned above, the coordinate system is scaled together with the element, which allows us to create any large or small canvas representations without any problems with quality and coordinates. For example, we will please owners of HD monitors:@media screen and (max-width: 2000px) { canvas { width: 1000px; height: 1000px; } ... }
For the mobile, the canvas size was set to 800px. - Actually, the canvas itself.
<div class="sortPlace"> <canvas id="canvas" width="900" height="900"></canvas> </div> - Basement. Nuff say
Javascript code
Immediately frustrated many readers. I know that on Habrahabr love OOP. However, the program was written in a procedural style, because at the time of writing the visualization, my experience was limited to independent picking in BASIC and solving some problems in discrete mathematics on Pascal. More than ten years ago, I actively used subroutines in BASIC, and two weeks ago, after learning functions in JavaScript, I felt nostalgic. After all, the main tasks of subroutines and functions are very similar, namely, to reduce the amount of code in a program by wrapping a repeating code in a function / subroutine. I don't remember whether it was possible to send arguments to the subroutine, if you remember, be sure to write it in the comments under the article. I first met the OOP style after writing half the code for visualization. I really like this approach. OOP is definitely good, but I’m probably not going to rewrite the code (besides, OOP in JavaScript has its own specifics, who knows, he will understand).
We will begin on the classic with a flowchart to have a general idea of the program architecture:
If Habrahabr does not know how to scale on click - here is a link to the vector and raster .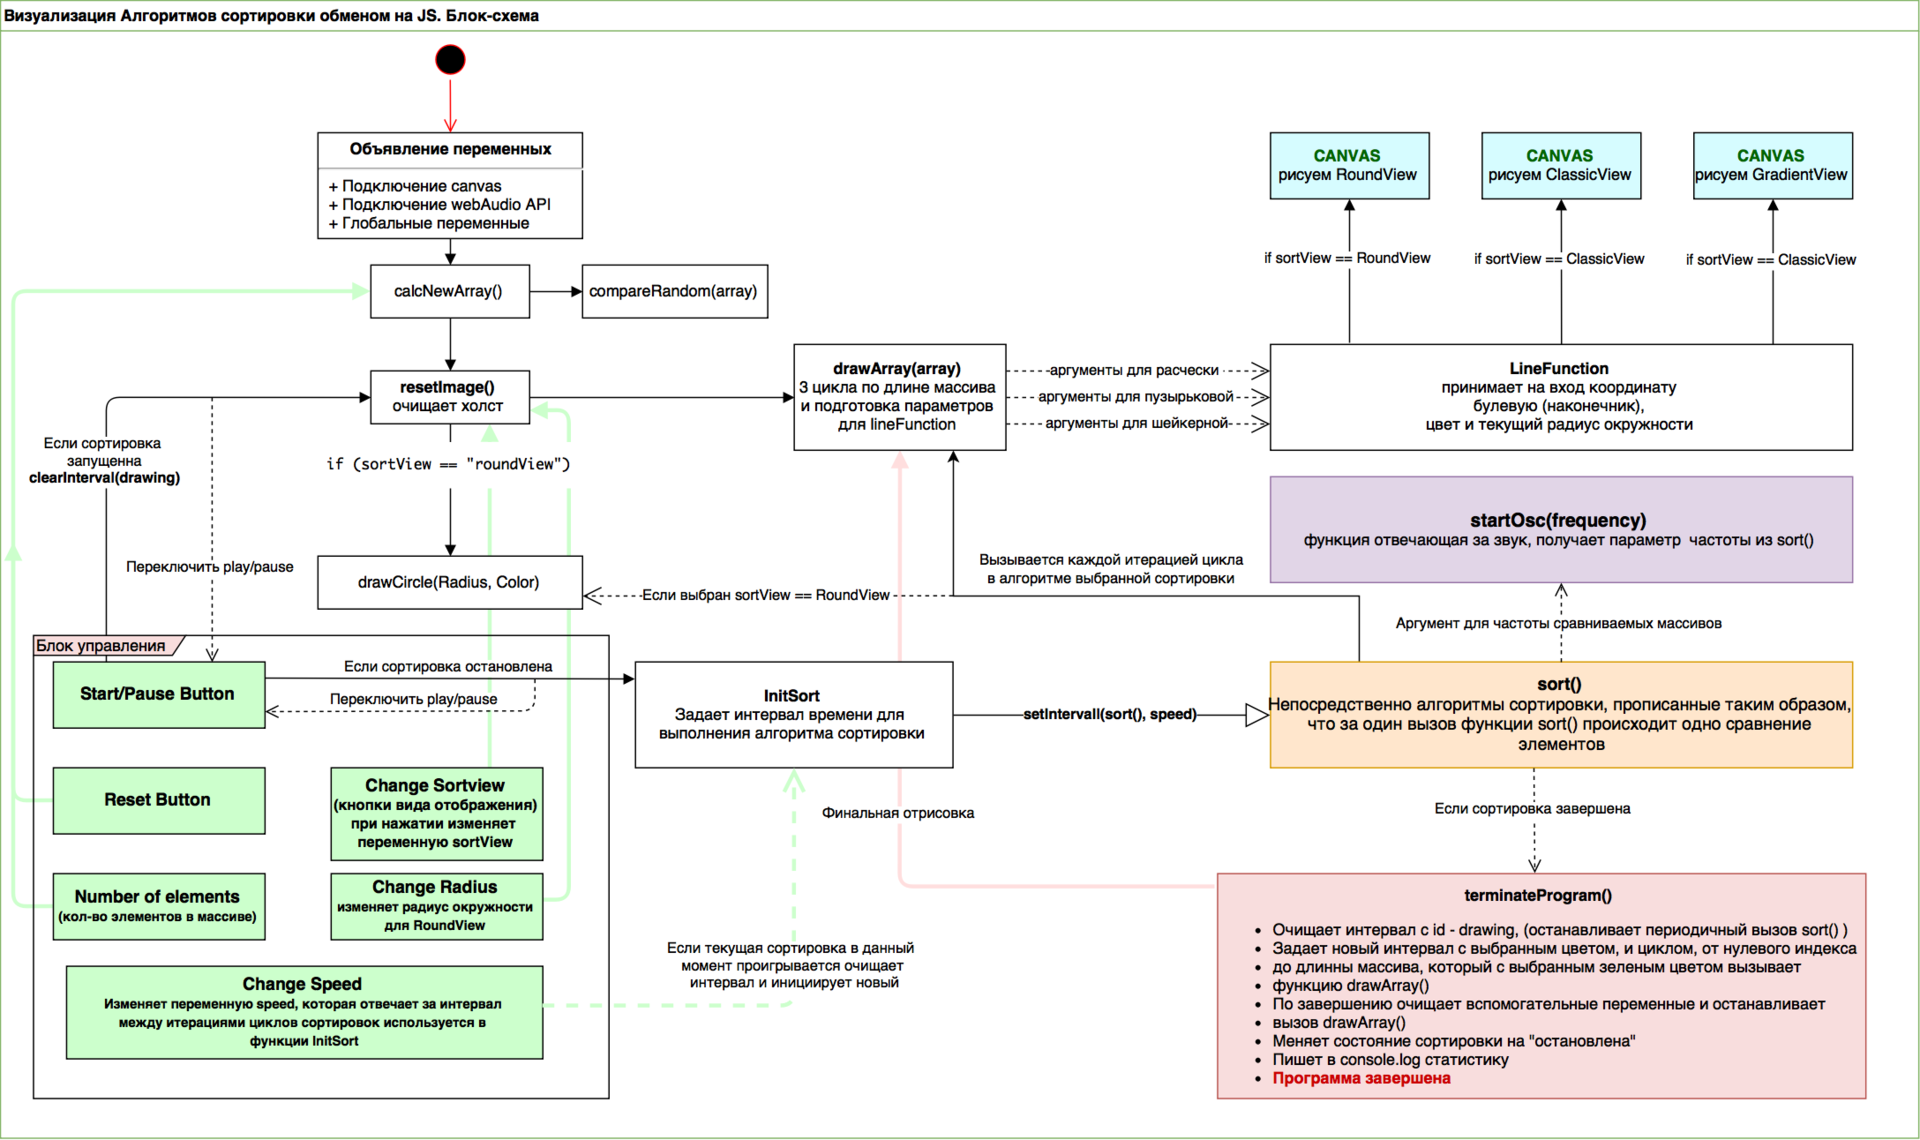
I will not copy here all the code from the program. If it becomes really interesting to someone, look in the repository on GitHub and be terrified already there. Come with you right on the pseudocode:
1. Declare all global variables.
Well, everything is pretty simple. The program contains many functions that often use the same variables. A special feature of JavaScript is that a variable declared inside a function is only available inside the function itself [7] . While the variable declared in global space is visible everywhere. This is the first difficulty I encountered. I had to read a little. Of course, whenever possible we will declare variables inside functions. So, global we will have variables responsible for:
Sorting process (sorting in process / sorting is stopped):
// sort state var playing = false; The value of the radius of the circle when loading the page used for display with a circle (necessary for the function of changing the radius with a joint adjustment of the size of the array element, if this is not done when the radius increases, the bars of the array elements will go beyond the canvas):
//sphere radius global vars for RoundView var radiusValue = +document.getElementById("sphereRadius").value, diffRadiusValue = 0; Hex array of flowers, which we will contact when painting the canvas. It was used to easily adjust nice colors on the canvas, such a palette. Also, the colorPick variable is used to highlight the compared elements when scanning an array. Light green will highlight elements that stand in their places, and light red if elements change places:
var colors = ["#839192", "#80ffbf", "#566573", "#ff8080", "#00cc00", "#006600", "#c2d6d6"], colorPick = 3; 2. Connect CANVAS to the canvas and connect it with HTML markup.
3. Connect Audio API. AudioContext () for auditing.
We will unite these two points of pseudocode, since these variables can be logically declared as a single block. In this block, we immediately set the value of the variable canvasSize (which is involved in generating the length of the array elements, finding the coordinates of the middle of the canvas, drawing the circle with the display with the circle) and we immediately attach the volume control to our volume slider from the markup:
//canvas pics & audio prep. var audio = new AudioContext(), volControl = document.getElementById("volume"), canvas = document.getElementById("canvas"), ctx = canvas.getContext("2d"), canvasSize = 900; Next, we declare an empty array and auxiliary global variables in the code. Which set the starting settings and are used in the sorting functions, for example, the variable responsible for the direction of movement for shaker sorting, the counters that track the completeness of the array and are responsible for completing the sorting, the step for sorting the comb, and so on. 4. Set the initial ones values for controls in HTML markup.
5. Based on the initial values, generate an array of elements and wait for commands from the user.
Function call:
calcNewArray(); All the remaining code in the .js file is a declaration of functions, consider some of them as needed, some obvious ones will get a simple description. If you're interested, you can always see them in the repository .
So, the calcNewArray function that collects a new array takes the value of the number of elements from the slider in the HTML markup, the size of the canvas and the radius of the circle for the corresponding type is subtracted from the maximum size of the elements (so that when the radius changes, the elements do not go beyond the canvas). Unary "+" in front of the values obtained from the sliders in the markup must be set to perform the data type conversion "String" -> "Number". The first for loop fills our array with elements with the maximum allowable length (across the canvas), the second loop evenly distributes the length of the elements. At the end of the function, all additional parameters for sorting are reset and functions that mix the array and update the canvas are called:
function calcNewArray() { array=[]; for (var i = 0; i < +document.getElementById("elementsNumb").value; i++) { array.push(Math.round(( (canvasSize/2) - (+document.getElementById("sphereRadius").value) - 60))); } for (i = 0; i < array.length; i++) { array[i] = array[i] * ((i)*((0.64/array.length))) + 90; } step = array.length-2; time = 0; direction = true; compareRandom(array); resetImage(); } } Initially, I just filled the array with random elements in the range from 50 to the length of the canvas minus the radius, but random generation does not give such a smooth and beautiful array!
Next, we describe the function startOsc responsible for the sound when checking items. The function takes the frequency parameter as an input and is an oscillator connected in series to the gain. So that the sound doesn’t cut the ear when the oscillator is broken, we indicate the rise time (attack) of the sound wave and attenuation.
Anyone who has connected an electric guitar at least once will understand the way WebAudioApi works, those who haven't connected can read about it here [8] and in a simpler language here [9] and for maniacs who want to write music there is the fundamental book “Web audio api »publisher O'Reilly:
function startOsc(freq) { var attack = 25, decay = 60, gain = audio.createGain(), osc = audio.createOscillator(); gain.connect(audio.destination); gain.gain.setValueAtTime(0, audio.currentTime); gain.gain.linearRampToValueAtTime(volControl.value, audio.currentTime + attack / 700); gain.gain.linearRampToValueAtTime(0, audio.currentTime + decay / 700); osc.frequency.value = (freq+100)*1.4; osc.type = "square"; osc.connect(gain); osc.start(0); setTimeout(function() { osc.stop(0); osc.disconnect(gain); gain.disconnect(audio.destination); }, decay); } Next in pseudo-code: 6. When you click the "Reset" button, erase the canvas, count the new array of elements
Everything is quite simple here, in the HTML markup inside the block, we indicate the function call when handling the onclick event:
<div class="resetButton button transition" onclick="resetButton()"> The resetButton () function itself calls the above calcNewArray (), and resetImage (), resetImage () is a function that is responsible for cleaning the canvas and calling the drawArray function, which receives an array on the input and performs the task of drawing an array on the canvas:
function resetImage () { ctx.clearRect(10, 10, canvasSize-20, canvasSize-20); if (sortView == "roundView") { drawCircle(+document.getElementById("sphereRadius").value, colors[6]); } drawArray(array); } drawArray (array) is a function with branching by the number of available types of sorts (in our case, bubble, comb and shaker), with nested loops, which prepares arguments for the lineFunction function (pommel, radCord, color, radius). After the drawArray (array) function is called from the code responsible for the sorting logic itself, the loop preparation process for the lineFunction function is processed depending on the sorting type. Further, by the number of elements in the array, lineFunction is called with arguments: pommel - boolean (the presence or absence of the "tip" of the element), radCord - the ordinal number of the array, color - color, and radius - the current radius of the circle (used only for the view with a circle). Inside lineFunction, branching is similarly carried out, but according to the types of display (in our case, a view with a circle, a classic view, and a gradient). Both functions of the function: drawArray and lineFunction contain a rather large amount of code. For the demonstration, I will show you a code with a branch for bubble sorting, and a classic look:
function drawArray(array) { ctx.lineWidth = 2*Math.PI*(+document.getElementById("sphereRadius").value)/array.length; ... if (sortType === "bubbleSort") { for (var i = 0; i < array.length; i++) { lineFunction(false, i, colors[0], +document.getElementById("sphereRadius").value); lineFunction(false, time-1, colors[colorPick], +document.getElementById("sphereRadius").value); lineFunction(false, time, colors[colorPick], +document.getElementById("sphereRadius").value); lineFunction(true, i, colors[2], +document.getElementById("sphereRadius").value); } } ... } function lineFunction(pommel, radCord, color, radius) { ... if (sortView == "classicView") { ctx.strokeStyle = color; ctx.lineWidth = canvasSize*0.75 / array.length; if (pommel) { ctx.beginPath(); ctx.moveTo(radCord * (canvasSize*0.9 / array.length)+30, canvasSize/2 - array[radCord]); ctx.lineTo(radCord * (canvasSize*0.9 / array.length)+30, canvasSize/2 - array[radCord] - canvasSize*0.8 / array.length); ctx.stroke(); } else { ctx.beginPath(); ctx.moveTo(radCord * (canvasSize*0.9 / array.length)+30, canvasSize/2); ctx.lineTo(radCord * (canvasSize*0.9 / array.length)+30, canvasSize/2 - array[radCord]); ctx.stroke(); } } ... Note that the drawArray function sends two elements with colors [colorPick], to the lineFunction for drawing. The colorPick value is global and is assigned each time in code that is directly responsible for the sorting logic. This is either a light green color if the elements are not interchanged or a light red if the elements are swapped. : ctx.beginPath(); « » moveTo lineTo . , : , . moveTo – «», , . lineTo – «», , . , stroke(); lineWidth strokeStyle, ( , ) . Adobe: Photoshop – Path, . Stroke Path, . . CANVAS Stroke «CANVAS : » [10] [11]
7. «Play» . «Pause». «Pause»
«Reset» , , , initSort() . , :
function startButton() { if (!playing) { playing = true; document.getElementsByClassName("sprite-play")[0].style.backgroundPosition = "-60px -5px"; document.getElementById("firstButton").style.background = "linear-gradient(hsla(0, 64%, 87%, 1), hsla(0, 64%, 57%, 1))"; initSort(); } else { playing = false; document.getElementsByClassName("sprite-play")[0].style.backgroundPosition = "-60px -45px"; document.getElementById("firstButton").style.background = "linear-gradient(hsla(136, 64%, 87%, 1), hsla(136, 64%, 57%, 1))"; clearInterval(drawing); resetImage(); } } 8. «Change Speed» .
, HTML oninput :
function changeSpeed() { if (playing) { clearInterval(drawing); initSort(); } } , . Since initSort(); , .
9. CANVAS .
onclick , c HSLA:
function changeSortView(view) { document.getElementById("roundView").style.backgroundColor=""; document.getElementById("classicView").style.backgroundColor=""; document.getElementById("gradientView").style.backgroundColor=""; sortView = view; if (sortView == "roundView") { document.getElementById("roundView").style.backgroundColor = "hsla(163, 81%, 80%, 1)"; } if (sortView == "classicView") { document.getElementById("classicView").style.backgroundColor = "hsla(163, 81%, 80%, 1)"; } if (sortView == "gradientView") { document.getElementById("gradientView").style.backgroundColor = "hsla(163, 81%, 80%, 1)"; } resetImage(); } sortView lineFunction , , — .10. , , «Pause» . .
. , , . , , , , , . — . , , , , :
function terminateProgram() { clearInterval(drawing); ctx.clearRect(10, 10, canvasSize-20, canvasSize-20); time = 0; colorPick = 3; ctx.lineWidth = 2 * Math.PI * (+document.getElementById("sphereRadius").value) / array.length; for (var i = 0; i < array.length; i++) { lineFunction(false, i, colors[0], +document.getElementById("sphereRadius").value); lineFunction(true, i, colors[2], +document.getElementById("sphereRadius").value); if (sortView == "roundView") { drawCircle(+document.getElementById("sphereRadius").value, colors[6]); } } i = 0; var finishDrawing = setInterval(function() { // Last green-style check if (i < array.length) { startOsc(array[i]); lineFunction(false, i, colors[1], +document.getElementById("sphereRadius").value); lineFunction(true, i, colors[5], +document.getElementById("sphereRadius").value); if (sortView == "roundView") { drawCircle(+document.getElementById("sphereRadius").value); } } else { if (sortView == "roundView") { drawCircle(+document.getElementById("sphereRadius").value, "#b3ffcc"); } clearInterval(finishDrawing); arrayLevel = 0; arrayLevelLow = 0; playing = false; document.getElementsByClassName("sprite-play")[0].style.backgroundPosition = "-60px -45px"; document.getElementById("firstButton").style.background = "linear-gradient(hsla(136, 64%, 87%, 1), hsla(136, 64%, 57%, 1))"; console.log("Array with " + array.length + " elements was completely sorted via " + sortType + " technique!" ); // Program shutdown! } i++; }, Math.abs(+document.getElementById("codeSpeed").value-200)*0.7); } , , .
, , . , , The Art of Computer Programming (TAOCP) [12] , JavaScript
function sort() { ctx.clearRect(10, 10, canvasSize-20, canvasSize-20); // **************// comb sort code & conditions //************************************************// if (sortType === "combSort") { if (array[time] > array[time+step]) { colorPick = 3; } else { colorPick = 1; } drawArray(array); if (sortView == "roundView") { drawCircle(+document.getElementById("sphereRadius").value, colors[6]); } if (time + step >= array.length) { time = 0; step = (step == 1) ? step : Math.floor(step / 1.25); } if (arrayLevel > array.length) { terminateProgram(); } for (var i = 0; i < array.length-1; i++) { if (array[i] <= array[i+step]) { arrayLevel++; } else { arrayLevel=0; } } if (time < array.length-1-arrayLevel) { startOsc(array[time+step]); startOsc(array[time]); if (array[time] > array[time+step]) { var temp = array[time]; array[time] = array[time+step]; array[time+step] = temp; } time++; } else { time = 0;} } // *******// stupid-style bubble sort & conditions //*************// if (sortType === "bubbleSort") { ctx.clearRect(10, 10, canvasSize-20, canvasSize-20); if (array[time] > array[time+1]) { colorPick = 3; } else colorPick = 1; drawArray(array); if (sortView == "roundView") { drawCircle(+document.getElementById("sphereRadius").value, colors[6]); } if (arrayLevel > array.length) { terminateProgram(); } for (var i = 0; i < array.length-1; i++) { if (array[i] <= array[i+1]) { arrayLevel++; } else { arrayLevel=0; } } if (time < array.length-1-arrayLevel) { startOsc(array[time]); startOsc(array[time+1]); if (array[time] > array [time+1]) { var temp = array[time+1]; array[time+1] = array[time]; array[time] = temp; } time++; } else { time = 0;} } // ********************// cocktail shaker sort //*********************************// if (sortType === "cocktailSort") { // if (arrayLevel+arrayLevelLow > array.length) { terminateProgram(); } ctx.clearRect(10, 10, canvasSize-20, canvasSize-20); drawArray(array); if (sortView == "roundView") { drawCircle(+document.getElementById("sphereRadius").value, colors[6]); } if (direction) { for (var i = 0; i < array.length-1; i++) { if (array[i] < array[i+1]) { arrayLevel++; } else { arrayLevel=0; } } } else { for (i = array.length; i > 1; i--) { if (array[i] > array[i-1]) { arrayLevelLow++; } else { arrayLevelLow=0; } } } if (direction) { if (time < array.length-arrayLevel-1) { startOsc(array[time]); startOsc(array[time+1]); if (array[time] > array [time+1]) { var temp = array[time+1]; array[time+1] = array[time]; array[time] = temp; colorPick = 3; } else { colorPick = 1; } time++; } else { direction=false; } } if (!direction) { if (time > arrayLevelLow) { startOsc(array[time]); startOsc(array[time-1]); if (array[time] > array [time+1]) { var temp = array[time+1]; array[time+1] = array[time]; array[time] = temp; colorPick = 3; } else { colorPick = 1; } time--; } else { direction=true; } } } } } , , , , . , , , .
Conclusion
In order to study HTML5, CSS3, JavaScript, the CANVAS element, the WebAudio API, we developed a page that visualizes the simplest sorting algorithms for the exchange. Sorts such as hairbrush, shaker sorting and bubble sorting. During development, the author had a lot of questions, because The author is still inexperienced. The number of lines of the long-suffering code is ≈500. The amount of time spent ≈ 2 weeks at a leisurely pace. The amount of pleasure obtained from the achieved result is not calculated in figures. Thank you for reading my first article.
Link to the demo (free hosting on bitbucket, not sure of the correct operation with a large number of visitors.
YouTube link playlist with visualization demo
References to the used literature and sources indicated in the article.
GitHub | -
[1] GitHub Timo Bingmann
[2]
[3] , BASIC
[4] Timo Bingmann , Downloads / Open source
[5] ixbt , CANVAS / – 2011
[6]
[7] JavaScript / – 2011
[8] Web Audio API
[9] Web Audio API / Boris Smus – 2013
[10] «CANVAS : » / Alexander Shpak – 2011
[11] , CANVAS w3s
[12] «The Art of Computer Programming (TAOCP)» / Donald Knuth – 1968
Source: https://habr.com/ru/post/322618/
All Articles