How much will your mobile game earn?
Development of mobile games is an industry with very high competition. Millions of games on Google Play and the Apple Store, forgotten by users immediately after launch, and rare success stories testify to that. In the next blog post, “Management of online gaming projects”, we translated an article by game developer Ross Przybylski on the calculation of the potential revenue of F2P mobile games. During his ten-year career, Ross managed to gain experience in indie studios (D20Studios) and large AAA companies (EA).

“Let’s release our game - let's get rich!” - game developers often tease each other with this phrase. Millions of dollars is not bad, of course, but in practice most of us would be completely satisfied with the fact that the game entertains a loyal fan base and simply brings enough money so that we can decide on another project.
Regardless of whether you want to earn a lot or to have enough for a living, it is always useful to first prepare an income forecast. A lot of time and money is spent on creating games. Calculation of potential income will help to assess the ratio of risk and profitability of your business plan and will allow you to make the right decisions regarding the product being created.
')
If you are developing a game for mobile platforms, then it would be best to restrict yourself to the F2P (free-to-play) model with SaS (software as service). Of course, paid games can also succeed, but the lion's share of revenues in the mobile market is created by microtransactions. This is explained by the fact that mobile players psychologically prefer short and frequent gaming sessions. A paid game must convince the consumer in advance that it is worth buying, and F2P games prove this during the game. Here are 5 tips to help you determine how much your mobile game can earn.
KPI stands for key performance indicators. These are metrics that allow you to evaluate the effectiveness of a product and its potential return on investment. To determine the prediction of the F2P game, there are two essential KPI standards: DAU and DARPU [approx. Per .: also called ARPDAU].
DAU is the Daily Active User. This is an indicator of unique users playing the game every day. DARPU is the Daily Average Revenue Per User. It is the sum of the average income generated by the game every day, divided by all players. For example, if a game earns $ 4,000 a day and DAU is $ 11,000, then DARPU will be equal to $ 0.36.
If you know your DAU and DARPU, you can calculate the predicted revenue (gross revenue) by multiplying them by the total number of days in the game's life cycle. I use 18 months as a conservative estimate of the life cycle of a game, because most of the income of the total life of the game is usually earned during this period.
Creating a forecast is easy if you know your DAU and DARPU, but what if you don’t know them? Having worked in the gaming industry of AAA-class mobile games, I realized that these values usually correspond to the game genre. For example, niche / hardcore games like RPG (Summoners War), collectible card games (Hearthstone) and strategy games usually have lower DAUs and increased DARPU, while casual / mass games like physics puzzles (Angry Birds), logical puzzles and Three-in-a-row puzzles (Candy Crush Saga) usually have a larger DAU and a smaller DARPU.
DARPU grade by genre
Casual / Mass: $ 0.02-0.06
Genres of medium difficulty (non-combat city-building games, simulators): $ 0.10-0.20
Niche / hardcore genres (combat construction, collectible card games): $ 0.30-0.40
Here are the DAU / DARPU indicators of two contrasting genres with a projected income of $ 1.08 million for 18 months:
Niche / hardcore: DAU 10 000, DARPU $ 0.35, $ 3500 / day
Casual / Mass: DAU 175,000, DARPU $ 0.02, $ 3.5 / day
Looks logical, right? Hardcore players usually spend more time and money on their favorite game, but the number of players in them is much less than in games designed for a mass audience.
The more detailed you describe the audience that likes the game, the more accurate the forecast will be. For example, if your game is liked by players of all ages from 8 to 80, then it is not clear how it will generate revenue. Be specific. "I create a game for men from 25 to 34 years old living in North America who are married with children who like games like Dungeons and Dragons and Magic the Gathering ."
A good way to assess market reach is to create a Facebook advertising campaign. See Facebook’s audience definition in Figure 2. one.
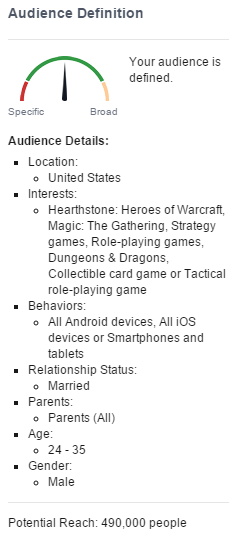
Fig. 1. Define Facebook audience
Now that you have an idea of the size of the audience, you can set the target number of launch installs (game installations at launch). In the case of my game with a market coverage of 500,000 people, I aimed at the installations base of 150,000 per month launch.
Although the goal of F2P is to use your game as a service for 5 years or more, and the user will install it during all this time, installations during the month of launch are important for forecasting. This is the initial cohort of players that most accurately predicts your potential success. Most game installation curves look like this:
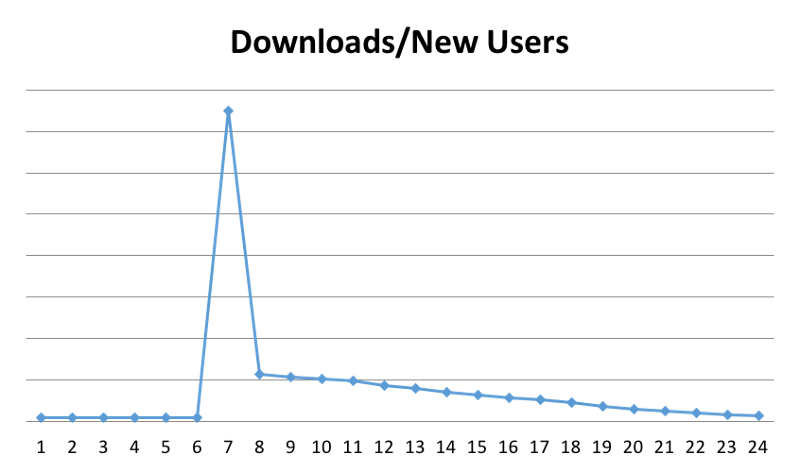
Fig. 2. Standard F2P Mobile Game Installation Curve
In Fig. 2 months from the first to the sixth are soft launch testing, and the seventh month is a launch on the world markets. Notice how much the curve jumps and falls. This is what a standard F2P game launch looks like (it is assumed that no content is added to the game, which can lead to peaks / waves on a curve).
The base of the initial installations is called the “golden cohort” - these are the players with the highest potential of turning into buyers, into real masters of the game and into its long-term fans. For an indie game, the number of installations per month of launch can be 40% of all installations during the life of the game. If you know the target number of installations after starting the game and “retention of players” (retention), then DAU can be predicted.
Retention is a KPI metric that allows you to evaluate the fun of the game. It is indicated as a percentage. For a given cohort (a group of players who installed the game on a particular day) retention is the percentage of players returning to the game. The “Big Three” of measured days are retention: D1, or the percentage of players returning to the game the day after installation, D7 (players returning after a week) and D30, or the percentage of players still playing the game a month after downloading.
D1 usually reflects the effectiveness of the original UX. Is management effective? Did the players understand the purpose of the game? Was the player interesting enough to return to the game again? If you can ensure that 50% of the players who download the game return the next day, then by industry standards this is good. D1 is important because it determines the maximum number of players who will switch to long-term gameplay.
D30 reflects the percentage of users who are passionate about long-term gaming. Here, a very good indicator is considered to be 8 percent or more. Knowing the number of installations in the first month, the retention rate and the statistical distribution, we can predict the DAU. Let us put aside the calculations that are difficult to explain, and assume that the approximate estimate is equal to:
For example, if my game received 150,000 installations in the first 30 days, and the retention of D30 is 8%, then we can predict that the average DAU will be close to 12,000 players per day.
I explained above that:
DARPU evaluation can be difficult if you do not know the internal industry subtleties of game genres. This indicator turns out to be rather an average, rather than a real shopping scenario that can be presented mentally. When you talk about shopping in mobile games (for example, Hearthstone), you usually don’t think: “I spend an average of 36 cents a day.” Rather, you think: “If I make a purchase, I will purchase 15 sets of cards for $ 20. Would this be a good choice? ”Let's imagine that all Hearthstone players talk about purchases in the same way. In this case, $ 20 will be the exact value of the DARPS metric (Daily Average Revenue Per Spender, daily average income from the buyer. [Note lane: Also called Daily ARPPU])
I love making predictions with DARPS, not DARPU, and for good reason. It's easier to evaluate how monetization will work. To do this, simply take the DAU and multiply by Spender Conversion (the percentage of DAU players who made the purchase decision on a particular day) to get the average number of buyers per day. Conversion for F2P is low, usually less than 1%, but higher in niche / hardcore games, 2.5% -4%. So you just need to take the average daily number of buyers and multiply it by the “magic average amount” that you think they will spend to get an average daily income.
As before, you can multiply the average daily income by the predicted number of months (I use 18 months) to get a revenue forecast:
This way you can estimate the maximum potential of the revenue generated by your product over the entire life cycle. But remember that for F2P games released in mobile app stores, the platform takes 30% of the total of all transactions. The online service also has a COG (Cost of Goods Sold, Cost of Goods Sold) associated with data costs and a server, which varies depending on the DAU. Therefore, let's take this into account:
For example, in my forecast with a target DAU of 11,000 users, a conversion of 2.5% and an average purchase of $ 15, my game could potentially receive 4,000 per day or 2.2 million over the entire life cycle. After deducting the app store's share and paying the cost of processing the COG data, net income will be approximately 1.5 million.
So should I risk investing in my game making business? We calculated only net income without the cost of production: how much will the development of the game cost? In addition, how can I be sure that I will achieve the projected goals? And what will happen if this does not happen?
These are topics for future articles, but now we have already taken one step towards realistic business forecasting of revenue from your mobile game.
Free lectures on the gaming industry are currently taking place at VSBI. We chose those that might be of interest to indie developers and creators of mobile games:
March 01: Features of localization of games of domestic developers to other countries
and General open day at VSBI
March 02: Separate open day of the program "Management of game projects"
March 15: Managing a team in the gaming industry
March 22: Game graphics: basic principles and tools
See you at events!
“Let’s release our game - let's get rich!” - game developers often tease each other with this phrase. Millions of dollars is not bad, of course, but in practice most of us would be completely satisfied with the fact that the game entertains a loyal fan base and simply brings enough money so that we can decide on another project.
Regardless of whether you want to earn a lot or to have enough for a living, it is always useful to first prepare an income forecast. A lot of time and money is spent on creating games. Calculation of potential income will help to assess the ratio of risk and profitability of your business plan and will allow you to make the right decisions regarding the product being created.
')
If you are developing a game for mobile platforms, then it would be best to restrict yourself to the F2P (free-to-play) model with SaS (software as service). Of course, paid games can also succeed, but the lion's share of revenues in the mobile market is created by microtransactions. This is explained by the fact that mobile players psychologically prefer short and frequent gaming sessions. A paid game must convince the consumer in advance that it is worth buying, and F2P games prove this during the game. Here are 5 tips to help you determine how much your mobile game can earn.
1. Know your KPI
KPI stands for key performance indicators. These are metrics that allow you to evaluate the effectiveness of a product and its potential return on investment. To determine the prediction of the F2P game, there are two essential KPI standards: DAU and DARPU [approx. Per .: also called ARPDAU].
DAU is the Daily Active User. This is an indicator of unique users playing the game every day. DARPU is the Daily Average Revenue Per User. It is the sum of the average income generated by the game every day, divided by all players. For example, if a game earns $ 4,000 a day and DAU is $ 11,000, then DARPU will be equal to $ 0.36.
If you know your DAU and DARPU, you can calculate the predicted revenue (gross revenue) by multiplying them by the total number of days in the game's life cycle. I use 18 months as a conservative estimate of the life cycle of a game, because most of the income of the total life of the game is usually earned during this period.
F2P = DAU * DARPU * 30 * 182. Use to assess income genre market segments.
Creating a forecast is easy if you know your DAU and DARPU, but what if you don’t know them? Having worked in the gaming industry of AAA-class mobile games, I realized that these values usually correspond to the game genre. For example, niche / hardcore games like RPG (Summoners War), collectible card games (Hearthstone) and strategy games usually have lower DAUs and increased DARPU, while casual / mass games like physics puzzles (Angry Birds), logical puzzles and Three-in-a-row puzzles (Candy Crush Saga) usually have a larger DAU and a smaller DARPU.
DARPU grade by genre
Casual / Mass: $ 0.02-0.06
Genres of medium difficulty (non-combat city-building games, simulators): $ 0.10-0.20
Niche / hardcore genres (combat construction, collectible card games): $ 0.30-0.40
Here are the DAU / DARPU indicators of two contrasting genres with a projected income of $ 1.08 million for 18 months:
Niche / hardcore: DAU 10 000, DARPU $ 0.35, $ 3500 / day
Casual / Mass: DAU 175,000, DARPU $ 0.02, $ 3.5 / day
Looks logical, right? Hardcore players usually spend more time and money on their favorite game, but the number of players in them is much less than in games designed for a mass audience.
3. Create an advertising campaign on Facebook to assess market coverage.
The more detailed you describe the audience that likes the game, the more accurate the forecast will be. For example, if your game is liked by players of all ages from 8 to 80, then it is not clear how it will generate revenue. Be specific. "I create a game for men from 25 to 34 years old living in North America who are married with children who like games like Dungeons and Dragons and Magic the Gathering ."
A good way to assess market reach is to create a Facebook advertising campaign. See Facebook’s audience definition in Figure 2. one.
Fig. 1. Define Facebook audience
Now that you have an idea of the size of the audience, you can set the target number of launch installs (game installations at launch). In the case of my game with a market coverage of 500,000 people, I aimed at the installations base of 150,000 per month launch.
Although the goal of F2P is to use your game as a service for 5 years or more, and the user will install it during all this time, installations during the month of launch are important for forecasting. This is the initial cohort of players that most accurately predicts your potential success. Most game installation curves look like this:
Fig. 2. Standard F2P Mobile Game Installation Curve
In Fig. 2 months from the first to the sixth are soft launch testing, and the seventh month is a launch on the world markets. Notice how much the curve jumps and falls. This is what a standard F2P game launch looks like (it is assumed that no content is added to the game, which can lead to peaks / waves on a curve).
The base of the initial installations is called the “golden cohort” - these are the players with the highest potential of turning into buyers, into real masters of the game and into its long-term fans. For an indie game, the number of installations per month of launch can be 40% of all installations during the life of the game. If you know the target number of installations after starting the game and “retention of players” (retention), then DAU can be predicted.
4. Use data from Retention and Startup Settings to predict DAUs.
Retention is a KPI metric that allows you to evaluate the fun of the game. It is indicated as a percentage. For a given cohort (a group of players who installed the game on a particular day) retention is the percentage of players returning to the game. The “Big Three” of measured days are retention: D1, or the percentage of players returning to the game the day after installation, D7 (players returning after a week) and D30, or the percentage of players still playing the game a month after downloading.
D1 usually reflects the effectiveness of the original UX. Is management effective? Did the players understand the purpose of the game? Was the player interesting enough to return to the game again? If you can ensure that 50% of the players who download the game return the next day, then by industry standards this is good. D1 is important because it determines the maximum number of players who will switch to long-term gameplay.
D30 reflects the percentage of users who are passionate about long-term gaming. Here, a very good indicator is considered to be 8 percent or more. Knowing the number of installations in the first month, the retention rate and the statistical distribution, we can predict the DAU. Let us put aside the calculations that are difficult to explain, and assume that the approximate estimate is equal to:
DAU ~= * retention D30For example, if my game received 150,000 installations in the first 30 days, and the retention of D30 is 8%, then we can predict that the average DAU will be close to 12,000 players per day.
5. Use customer psychology to deal with daily income.
I explained above that:
= DAU * DARPUDARPU evaluation can be difficult if you do not know the internal industry subtleties of game genres. This indicator turns out to be rather an average, rather than a real shopping scenario that can be presented mentally. When you talk about shopping in mobile games (for example, Hearthstone), you usually don’t think: “I spend an average of 36 cents a day.” Rather, you think: “If I make a purchase, I will purchase 15 sets of cards for $ 20. Would this be a good choice? ”Let's imagine that all Hearthstone players talk about purchases in the same way. In this case, $ 20 will be the exact value of the DARPS metric (Daily Average Revenue Per Spender, daily average income from the buyer. [Note lane: Also called Daily ARPPU])
I love making predictions with DARPS, not DARPU, and for good reason. It's easier to evaluate how monetization will work. To do this, simply take the DAU and multiply by Spender Conversion (the percentage of DAU players who made the purchase decision on a particular day) to get the average number of buyers per day. Conversion for F2P is low, usually less than 1%, but higher in niche / hardcore games, 2.5% -4%. So you just need to take the average daily number of buyers and multiply it by the “magic average amount” that you think they will spend to get an average daily income.
= DAU * * DARPSAs before, you can multiply the average daily income by the predicted number of months (I use 18 months) to get a revenue forecast:
= * 18 * 30This way you can estimate the maximum potential of the revenue generated by your product over the entire life cycle. But remember that for F2P games released in mobile app stores, the platform takes 30% of the total of all transactions. The online service also has a COG (Cost of Goods Sold, Cost of Goods Sold) associated with data costs and a server, which varies depending on the DAU. Therefore, let's take this into account:
COG (Cost of Goods Sold) = (DAU * 18 * 30) * @(0,006/ DAU)= ( * 70%) - COGFor example, in my forecast with a target DAU of 11,000 users, a conversion of 2.5% and an average purchase of $ 15, my game could potentially receive 4,000 per day or 2.2 million over the entire life cycle. After deducting the app store's share and paying the cost of processing the COG data, net income will be approximately 1.5 million.
So should I risk investing in my game making business? We calculated only net income without the cost of production: how much will the development of the game cost? In addition, how can I be sure that I will achieve the projected goals? And what will happen if this does not happen?
These are topics for future articles, but now we have already taken one step towards realistic business forecasting of revenue from your mobile game.
Free lectures on the gaming industry are currently taking place at VSBI. We chose those that might be of interest to indie developers and creators of mobile games:
March 01: Features of localization of games of domestic developers to other countries
and General open day at VSBI
March 02: Separate open day of the program "Management of game projects"
March 15: Managing a team in the gaming industry
March 22: Game graphics: basic principles and tools
See you at events!
Source: https://habr.com/ru/post/322552/
All Articles