Generation of polygonal maps for games
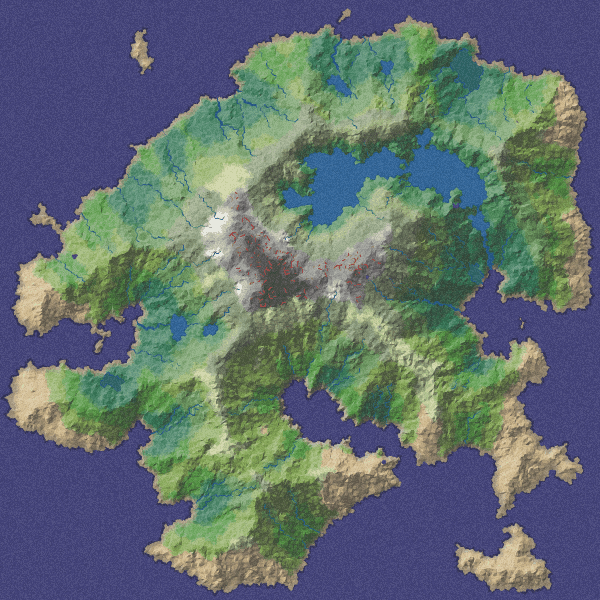
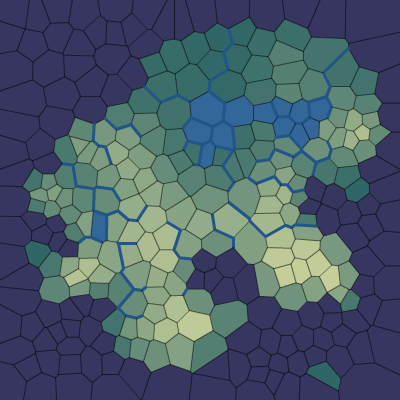
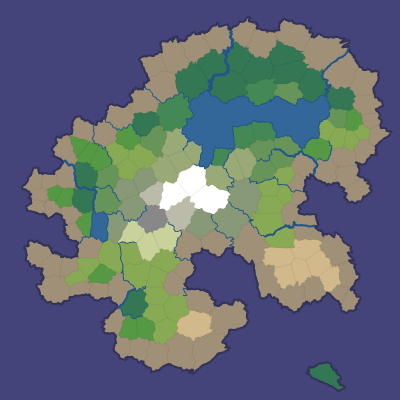
I wanted to learn how to generate interesting game cards that would not necessarily be realistic, and also to try techniques that I hadn’t worked with before. I usually create maps with a different structure. What can be done with a thousand polygons instead of a million tiles? Distinctly distinguishable areas for a player can be useful for gameplay: locations of cities, places of quests, areas for capturing or colonizing, landmarks, points for finding a path, zones with varying difficulty, etc. I generated maps using polygons, and then rasterized them into such maps:
Many procedural map generators, including some of my previous projects, use noise functions (midpoint displacement, fractals, diamond-square, Perlin noise, etc.) to generate the height map. I did not use them here. Instead, I used a graph structure to simulate the elements determined by gameplay restrictions (height, roads, river flow, quests, monster types) and noise functions to simulate what is not limited to gameplay (coastal shape, location of rivers and trees).
In this project I wanted to achieve three main indicators: good coastlines, mountains and rivers. For the coast, I wanted to create island maps surrounded by the ocean, so as not to handle the behavior of characters walking along the edge of the map. For the mountains, I started with a simple one: the mountains I have are the farthest from the coastline, so you can always go up to reach the top. I also started working with rivers from simple: I drew the rivers from the coast to the mountains, so that you could always walk along the rivers to the coast.
')
First see the demo ! (Flash) Read how it works, or open source code. Here is a description of the process:
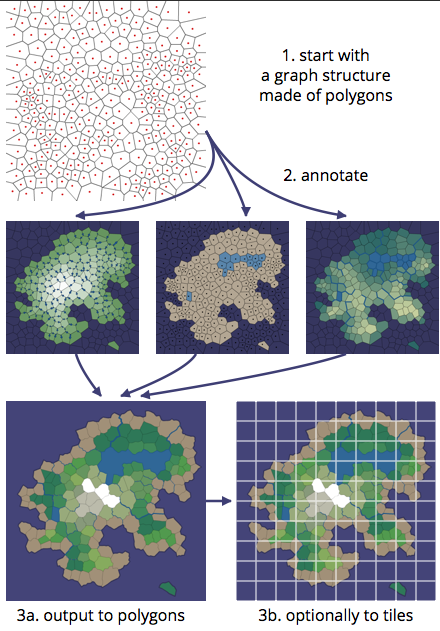
1. We start with the structure of graphs created from polygons. 2. Mark it up. 3a. Output to polygons. 3b. If necessary, output to the tiles.
Each project has its own gameplay restrictions. For this project, restrictions are partly taken from the Realm of the Mad God . This is a multiplayer RPG in which players start the game alone on the coast, and then team up on top of a mountain to fight the bosses. The height is directly related to the complexity and should monotonously increase. And this is a key design constraint. On the other hand, the height in Minecraft is not limited in this way, so the noise function is suitable for this game. In the multiplayer age of empires, the location of resources is limited so that there is a balance between the players. In Minecraft, resource allocation is unlimited. When creating your own map generator, think about which aspects of your map should be set deliberately and which should be different on different maps. All the information presented in this article can be used together or separately for your own project generator.
The first step is to generate the polygons. The easiest way to do this is to use a grid of hexagons and slightly distort it so that it looks unusual. This approach works (and the techniques from this article will work if you use a distorted grid), but I wanted to use something else more unusual, so I picked random points and generated Voronoi polygons , which are used in many cases , including to create maps. Wiki on the Voronoi diagram is incomplete, but it has useful information. I use the as3delaunay nodename library , which has a Forchun algorithm implementation.
Here is an example of random points (red) and polygons created on their basis:
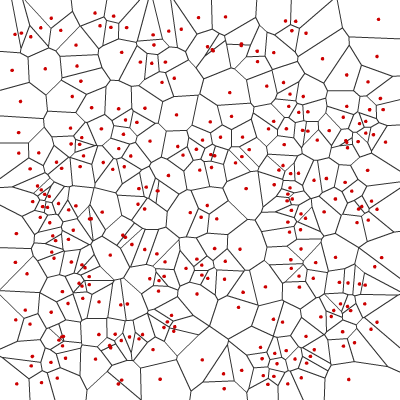
The shapes and sizes of polygons are quite uneven. Random numbers are more “clumsy” than people normally expect. I wanted to achieve something closer to half-random "blue noise" or to pseudo-randomness , and not to random points. I approached the desired result using a variant of the Lloyd algorithm , which is a fairly simple way to more evenly distribute random points. Lloyd’s algorithm replaces each point with a centroid of a polygon. In my code, I barely average the corners (see
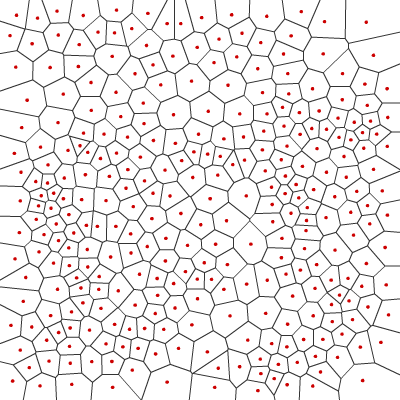
Compare with one and fifty runs of the algorithm. The more iterations, the more uniform the polygons become. Two runs allow me to get good results while maintaining variability in each game.
The sizes of polygons are improved by moving the centers of polygons. The same approach is applicable to improve the length of the ribs. By moving the corners by averaging the nearby centers, we get more uniform lengths of the edges, but this degrades the size of the polygons. See the
Using Voronoi diagrams adds complexity, so if you want to start with something simpler, try a grid of squares or hexagons (they are in the demo). The rest of the techniques of this article will work for grid-based maps. You can also accidentally shift the vertices of the grid so that it looks a bit more natural.
I present the map in the form of two connected graphs : nodes and edges. The first graph contains the nodes of each polygon and edges between adjacent polygons. It is a Delone triangulation , useful when working with neighboring points (for example, when finding a path). The second graph contains the nodes of the corners of each polygon and the edges between the corners. It contains the shapes of the Voronoi polygons. This graph is useful for everything related to forms (for example, for rendering borders).
Two graphs are connected. Each triangle in the Delaunay triangulation corresponds to the angle of the polygon in the Voronoi diagram. Each polygon in the Voronoi diagram corresponds to the angle in the Delone triangle. Each edge in the Delone graph corresponds to an edge in the Voronoi graph. This can be seen from the following diagram:
Polygons
In the Delaunay triangulation, the triangle
This duality means that you can represent both graphs together. There are different approaches to combining these two graphs. In particular, the edges may be common . Each edge in a normal graph leads to two nodes. Instead of representing two edges separately in two graphs, I created edge points to four nodes: two polygon centers and two corners. This turned out to be very convenient for combining two graphs into one.
In the combined view, you can apply information from the Relationships Between Grid Parts sections of my article about grids . I do not use grids, so I don’t assign grid coordinates, but many algorithms that apply grids are also applicable here (for either of the two graphs).
In the code, the
The next step is drawing the shoreline. The borders of the map should be water, but other polygons can be marked as water or land using any method you choose. The condition of the coastline is the proximity of land and water.
Here is an example of the division of the world into land and water:
In the source code,
You can use any shape, ( even fat stains on the pizza box ). In the future version of this project, I hope to add a drawing tool that allows you to create your own forms.
The code sets the land / water value for both the centers and the corners of the polygons:
It would be most realistic to first determine the heights and then define the coastline as the boundary where the height reaches sea level. Instead, I'll start in the reverse order. Take a good coastline, and I will begin to build on it. I will define altitude as the distance from the coast . Initially, I tried to make heights in the centers of polygons, but setting heights in the corners was more convenient. The edges connecting the corners can serve as valleys and ridges. After calculating the height of the corners (
For water polygons the distance is not calculated. Firstly, because I wanted the lakes to be flat, not sloping, and secondly, this is how valleys are formed around the lakes, which helps direct the rivers to the lakes.

There was one problem with this simple definition: some islands had too many mountains, while others had too few. To correct this, I redistributed the heights so that they corresponded to the desired distribution, at which there would be more land with a small height (coast) than with a large height (mountains). First, I sorted the angles by height, and then dropped the
When moving from any point downwards, we will definitely come to the ocean. This diagram shows the direction of the steepest descent from each corner, stored in

Following the down arrow, we will gradually come to the ocean. This will be useful for rivers, but may also be useful for calculating watersheds and other characteristics.
My height serves two main purposes:
In addition, in games you can find your own application of data about heights. For example, in Realm of the Mad God heights are used to distribute monsters.
This calculation of heights is suitable for simple islands, this is exactly what I needed for Realm of the Mad God. To generate continents, you will need to change this step to generate one or more mountain ranges that are not necessarily located in the center, as well as individual volcanoes.
I wanted to use two sources of fresh water: rivers and lakes. The most realistic would be to determine the humidity depending on wind, cloudiness, dampness and precipitation, and then calculate the locations of rivers and lakes. Instead, I start again from the end, that is, from good rivers, and go back.
The shape of the island determines the location of areas of water and land. Lakes are polygons of water that are not oceans. Rivers use the descent directions shown above. I chose random locations of corners in the mountains, and then went down the
I tried to allow both between the centers and between the corners of the polygons, but I found out that the graph of angles creates much more beautiful rivers. In addition, the lakes remain flat, so that the heights near the lakes are usually smaller. Therefore, rivers naturally flow in and out of lakes. Several rivers may have a common mouth. Each time a river flows across the edge, I increase the volume of water stored in
Since I am performing the process in the opposite direction, I do not need the humidity to determine the presence of rivers. However, humidity can be useful in distinguishing between biomes (deserts, swamps, forests, etc.). Since rivers and lakes should be formed in areas of high humidity, I decided that humidity would decrease with increasing distance to fresh water .
As in the case of heights, I redistributed the humidity to match the desired distribution. In this case, I wanted to have approximately the same amount of dry and wet areas. The desired distribution function is
In this map generator, humidity is used only for biomes. However, in games you can find humidity data for other uses. For example, in Realm of the Mad God, humidity and altitude are used to distribute vegetation and monsters.
Altitudes and humidity together provide good variability for assigning biome types. I use altitude as a substitute for temperature. If I made a generator of continents, then latitude could influence the temperature. In addition, wind, evaporation, and rain shadow areas could be used to carry moisture like damp. However, for this generator, I took a simple principle. First, biomes depend on where they are located, in water or on land:
For all landforms, I started with the Whittaker diagram and adapted it to fit my needs:
Here is the result:
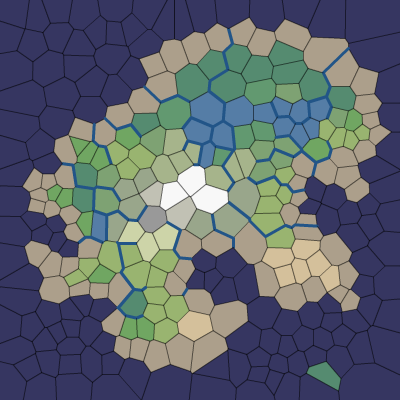
These biomes look good in the demo, but each game will have its own needs. For example, in the Realm of the Mad God, these biomes are ignored and their own biomes are used (based on height and humidity).
For some games, polygonal maps are enough. However, in others the polygonal structure needs to be hidden. The main way to do this is to replace the borders of the polygons with a noisy line. Why did I create a polygonal structure if I am going to hide it? I think the mechanics of the game and the algorithm for finding ways will benefit from having an internal structure.
Recall that earlier we had two graphs: one for the Voronoi corners (
I wanted to make both types of lines noisy so that they would not cross lines from other polygons. In addition, I wanted them to be noisy and believable. I realized that points
I divided the quadrilateral into four quadrilaterals. Two could be used for the red rib (Delone), and two for the blue rib (Voronoi). Since the lines remain in their allocated space and are connected in the center, they will never intersect. So we have limited them. Note that a quadrilateral may not be convex. To divide it correctly, I divided it from the middle of the Voronoi rib instead of dividing at the intersection of the Voronoi and Delone edges.
The whole map can be divided into areas of quadrangles between which there will be no empty space:
This ensures that noisy lines will not be unnecessarily restricted. (I wonder if these quadrangles can be useful in game mechanics?)
You can use any noisy line algorithm that satisfies these limitations. I decided to recursively subdivide the quadrilaterals and connect the line segments in small quadrilaterals into a full edge. The algorithm is in
You can adjust the noise in three places:
It turned out that noisy ribs strongly influence the appearance of the map, especially rivers and coastlines.
I usually like the noise in the game art , and I wanted to add some more noise to the maps. In a real game map, noise may reflect vegetation or slight variations in topography. In the demo (
Here is the result of rendering with 16,000 polygons, noisy edges, superimposed noisy texture and simple lighting:
Another way to mix biomes at the boundaries of polygons is to create gradients based on the height and humidity of each corner with the pixel-like biome assignment:
If the game does not require the entire polygon to belong to the same biome, then this approach may be useful for creating more interesting boundaries.
Another way to make the map less polygonal is to distort the height and humidity maps:
Here is an example of how this can be achieved:

Adding noise to the height and humidity creates "fluctuations" in the areas near the transitions. Sampling nearby points using noise distorts the shape of the borders.
To study the generated maps, I wrote a demo in Flash:

Try the demo !
I posted the sources on Actionscript under the MIT license, they are available on github .If you can read Java or Javascript, then I think you can figure it out with Actionscript. I do not expect that the code will immediately become useful for everyone, but it can be a good starting point if you want to use these techniques to create your own game maps.
The diagrams in this article are created from 300 polygons, by default, the demo uses 2000 with a maximum of 8000. Some of the code for creating diagrams was not checked, because it is “fast and dirty” code written only for the diagrams of this article and is otherwise useless.
If the code or my thoughts seem useful to you, I will be glad to know about it.
This map generator was not intended for direct use, but in Welsh Piper ( monster encounter tables , Minocra ), Kingdoms in Trevail , Cresta, and other ( 1 , 2 , 3 , 4 , 5 , 6 ) games, the map generator is used to create maps . Click the “export PNG” button to export a 2048x2048 PNG file, which you can then adapt to Photoshop for color, style, and markup.
I tried to structure the presentation of the maps so that the modules could mark them without creating dependencies on the code. The GUI module
Where the base code of the card can refer to
I have three modules: Roads, Lava, and NoisyEdges.
Realm of the Mad God does not use most of the functions of this map generator, but for it I created a road generator. I noticed that in the game, users naturally explore the rivers. Rivers lead players to the mountains where they die. I wanted to build roads at right angles to the rivers.
I calculated the contour lines along the corners. Where the contour level changes, there is a road. This is a fairly simple algorithm, which is suitable in most cases, but sometimes creates small loops:

As the rivers meander along the Voronoi ribs (the blue lines in the diagram above), the roads run along Delaunay ribs (red lines). Roads are not handled by noise. Instead, they are drawn by splines between the midpoints of the edges:

Most landfills have two “neighbors” with roads. For them, the usual spline is used, connecting the two midpoints of the edges. For polygons that have more than two “neighbors” with roads, I draw an intersection with splines from all midpoints of the edges to the center of the polygon. In the diagram above, the lower left polygon has an intersection, and the upper right polygon has an ordinary spline.
Lava and the river follow the same paths. Lava faults occur in high dry areas and are assigned to a subset of edges. In the game, lava and water, of course, will be different, but they differ only in color and location. Lava edges processed by noise:
The map should correctly display the relevant parts of the world, not all the details. In this project, I generate maps with a certain level of detail, but I don’t get to the detail of vegetation or cities, although maps are not completely abstract at the same time. It may be possible to render more abstract maps in the style of maps of Middle-earth (like this ). I wrote notes about what I wanted to see in the game cards .
Following the down arrows (see the description in the section on heights), you can always find a path along the edges from any angle of the polygon to the coast. I use them to mark the places where water should flow into the ocean. All corners with the same source location can be considered part of the same watershed.
The watershed code is incomplete. There is a watershed mode in the demo, but I don't like it. I tried to use the centers and corners of polygons as watershed boundaries, and in both cases the results were not good enough. I decided to postpone the calculations of the watersheds until they are needed.
I think that the watersheds could be useful to give names to large areas.. In the demo on the map about 1000 polygons of land. For a game map, it would be nice to have fewer areas with names than polygons grouped together. For example, XYZ mountains can be located above the XYZ valley, through which the XYZ river can flow. Players will be able to understand that all these toponyms are related. In this project, I did not advance much, but sooner or later I can return to it.
In my map generator, all boundaries between polygons are the same. Between them there are smooth transitions. It may be interesting to make some edges intermittent, so we can create rocks, abysses, plateaus and other abrupt changes in elevation. See this article for how the Voronoi areas can be interesting for the gameplay.
On polygonal maps, the search for paths must be fairly fast, and it can be used for the analysis of the relief. For example, if two points are spatially close, but the path between them is long, this may mean that there is a bay or a mountain on the way, and that this will be a good place for a tunnel or bridge. The pathfinding algorithm can also find places where bridges to the nearest islands are required. Path polygons may strategically be more valuable than polygons rarely used for paths.
As I mentioned in the section on watersheds, I want to give names to different areas of the map. Combining this function with the analysis of the relief, you can give names to rivers, mountains, lakes, groups of landfills, coastlines, oceans, forests, peninsulas, valleys, etc. Names in one area may be related. I did not work on this part, because I think that it is useful only in a particular game, and not in the general map generator. With the theme of the game should be associated not only the names, it may be objects, quests and elements of the plot. For example, the XYZ sword can only be found in the XYZ valley.
You can use the Forchun algorithm to subdivide a polygon into smaller polygons. A map on which most of the world is roughly outlined, and some areas more detailed, may look interesting. As an alternative approach, we can arrange initial points with variable density, so that in some areas there are more polygons than in others. For example, instead of using the Lloyd algorithm, you can apply an excess sampling of anti-aliasing .
I implemented a very simple noisy rib system with jagged lines. When you increase the map angles are very noticeable. You can improve the system with the help of spline curves or fractal expansion, which will look more detailed when scaled.
This article was first three posts: part 1 on landfills, map views, islands, oceans, lakes, beaches and land; part 2 about altitudes, rivers, humidity and biomes; Part 3 about rendering, demo and source code.
If anyone is interested in how I came to this, then here is a brief history:
Why am I tracking all this? Because I'm trying to improve the process of working with such small (1-3 months) projects. Here is what I want to remind:
I will take these lessons into account when working on new projects.
I thank the Dungeon League blog for the excellent series of procedural map generation posts, the Procedural Content Generation wiki for ideas on generating maps , the incomplete Voronoi wiki for useful resources about Voronoi diagrams.
Thanks
Delaunay triangulation andVoronoi polygons are studied in many graphics courses. For example, see Stanford CS 368 (PDF). I also studied relative adjacency graphs and Gabriel graphs , but did not use them.
Delaunay triangulation can be used for cards in the form of a triangulated irregular structure . Voronoi diagrams are also used to create maps.
The Forchun algorithm is one of the algorithms capable of turning a set of points into Voronoi polygons. This is implemented in
The Relief Shading website has images of relief shading maps , as well as instructions for shading and coloring design. It is sad that I did not have enough time to apply these techniques. I also studied the Bing and Google maps to understand how various features are drawn in them; see this article , my blog post and this article .
The Whittaker Chart is one way to predict common biomes with a given climate. Wikipedia has a page withbiome classification schemes and different biomes .
Also in Wikipedia there is a good list of landforms that you can try to generate with the help of a game map generator. For my project, I have not studied this list.
Ken Perlin (Ken Perlin) - master of work with noise, he came up with the noise of Perlin. He also created a lesser-known simplex noise (PDF). In my project, I used Perlin's noise to create the overall shape of the island. Joe Slayton has a page on how to turn Perlin’s noise into islands . I was looking for information about blue noise and, before I found Lloyd’s algorithm for improving the distribution of random points, I came across an article by Dunbar and Humphreys about noise generation., as well as on Van's recursive tiles . I also looked at the textures of Craig Reynold (Craig Reynold) , but did not have time to apply them anywhere.
It is also interesting to show these articles of generating world , nature map generator Gozzy , the world generator donjon , an article on procedural generation roads , an article on procedural generation cities . It seems that direct skeletons can be useful for defining mountain ranges, but as soon as I saw how well the “distance from the coast” approach works, I didn't need anything else. Quite interesting is the generation of 3d-cards in Dwarf Fortress .
Many procedural map generators, including some of my previous projects, use noise functions (midpoint displacement, fractals, diamond-square, Perlin noise, etc.) to generate the height map. I did not use them here. Instead, I used a graph structure to simulate the elements determined by gameplay restrictions (height, roads, river flow, quests, monster types) and noise functions to simulate what is not limited to gameplay (coastal shape, location of rivers and trees).
In this project I wanted to achieve three main indicators: good coastlines, mountains and rivers. For the coast, I wanted to create island maps surrounded by the ocean, so as not to handle the behavior of characters walking along the edge of the map. For the mountains, I started with a simple one: the mountains I have are the farthest from the coastline, so you can always go up to reach the top. I also started working with rivers from simple: I drew the rivers from the coast to the mountains, so that you could always walk along the rivers to the coast.
')
First see the demo ! (Flash) Read how it works, or open source code. Here is a description of the process:
1. We start with the structure of graphs created from polygons. 2. Mark it up. 3a. Output to polygons. 3b. If necessary, output to the tiles.
Each project has its own gameplay restrictions. For this project, restrictions are partly taken from the Realm of the Mad God . This is a multiplayer RPG in which players start the game alone on the coast, and then team up on top of a mountain to fight the bosses. The height is directly related to the complexity and should monotonously increase. And this is a key design constraint. On the other hand, the height in Minecraft is not limited in this way, so the noise function is suitable for this game. In the multiplayer age of empires, the location of resources is limited so that there is a balance between the players. In Minecraft, resource allocation is unlimited. When creating your own map generator, think about which aspects of your map should be set deliberately and which should be different on different maps. All the information presented in this article can be used together or separately for your own project generator.
Polygons
The first step is to generate the polygons. The easiest way to do this is to use a grid of hexagons and slightly distort it so that it looks unusual. This approach works (and the techniques from this article will work if you use a distorted grid), but I wanted to use something else more unusual, so I picked random points and generated Voronoi polygons , which are used in many cases , including to create maps. Wiki on the Voronoi diagram is incomplete, but it has useful information. I use the as3delaunay nodename library , which has a Forchun algorithm implementation.
Here is an example of random points (red) and polygons created on their basis:
The shapes and sizes of polygons are quite uneven. Random numbers are more “clumsy” than people normally expect. I wanted to achieve something closer to half-random "blue noise" or to pseudo-randomness , and not to random points. I approached the desired result using a variant of the Lloyd algorithm , which is a fairly simple way to more evenly distribute random points. Lloyd’s algorithm replaces each point with a centroid of a polygon. In my code, I barely average the corners (see
improveRandomPoints ). Here is the result of the dual use of approximation by the Lloyd algorithm:Compare with one and fifty runs of the algorithm. The more iterations, the more uniform the polygons become. Two runs allow me to get good results while maintaining variability in each game.
The sizes of polygons are improved by moving the centers of polygons. The same approach is applicable to improve the length of the ribs. By moving the corners by averaging the nearby centers, we get more uniform lengths of the edges, but this degrades the size of the polygons. See the
improveCorners function in the code. However, the moved angles lose the properties of the Voronoi diagram. These properties are not used in my map generator, but do not forget about it if you want to use them in the game. You can either improve the length of the edges, or maintain the properties of the Voronoi distances.Using Voronoi diagrams adds complexity, so if you want to start with something simpler, try a grid of squares or hexagons (they are in the demo). The rest of the techniques of this article will work for grid-based maps. You can also accidentally shift the vertices of the grid so that it looks a bit more natural.
Map presentation
I present the map in the form of two connected graphs : nodes and edges. The first graph contains the nodes of each polygon and edges between adjacent polygons. It is a Delone triangulation , useful when working with neighboring points (for example, when finding a path). The second graph contains the nodes of the corners of each polygon and the edges between the corners. It contains the shapes of the Voronoi polygons. This graph is useful for everything related to forms (for example, for rendering borders).
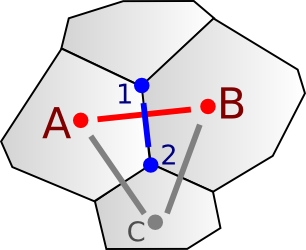
Two graphs are connected. Each triangle in the Delaunay triangulation corresponds to the angle of the polygon in the Voronoi diagram. Each polygon in the Voronoi diagram corresponds to the angle in the Delone triangle. Each edge in the Delone graph corresponds to an edge in the Voronoi graph. This can be seen from the following diagram:
Polygons
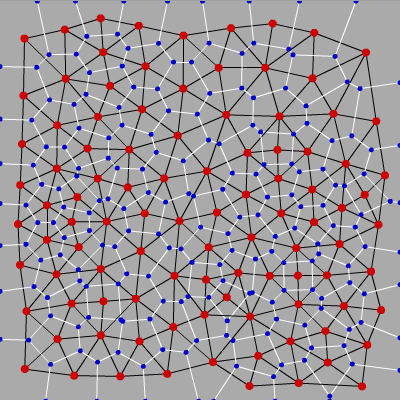
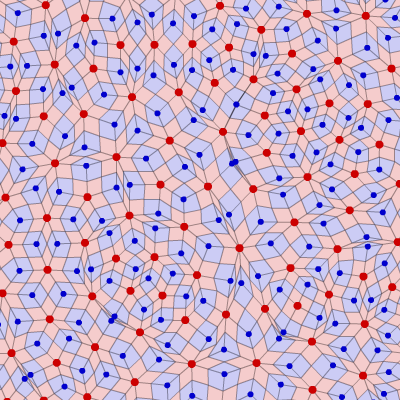
A and B adjacent, so the adjacency graph has a (red) edge between A and B So that they are adjacent, there must be a polygon edge between them. The (blue) edge of the polygon connects angles 1 and 2 in the Voronoi form graph. Each edge in an adjacency graph corresponds to exactly one edge in a form graph.In the Delaunay triangulation, the triangle
A - B - C connects three polygons, and can be represented by an angle of 2 . Therefore, the angles of Delaunay triangulation are polygons in the Voronoi diagram, and vice versa. Here is a larger example showing the relationship: the centers of the Voronoi polygons are shown in red and the corners in blue, the Voronoi edges in white, and the Delaunay triangulation in black:This duality means that you can represent both graphs together. There are different approaches to combining these two graphs. In particular, the edges may be common . Each edge in a normal graph leads to two nodes. Instead of representing two edges separately in two graphs, I created edge points to four nodes: two polygon centers and two corners. This turned out to be very convenient for combining two graphs into one.
In the combined view, you can apply information from the Relationships Between Grid Parts sections of my article about grids . I do not use grids, so I don’t assign grid coordinates, but many algorithms that apply grids are also applicable here (for either of the two graphs).
In the code, the
graph/ directory contains three classes: Center , Corner and Edge :Center.neighborsis a set of adjacent polygons.Center.borders- many bordering edgesCenter.corners- many polygon cornersEdge.d0andEdge.d1- polygons connected by the Delone edgeEdge.v0andEdge.v1- angles connected by a Voronoi edgeCorner.touches- many polygons related to this angleCorner.protrudes- many edges related to the angleCorner.adjacentis the set of angles connected to this angle.
Islands
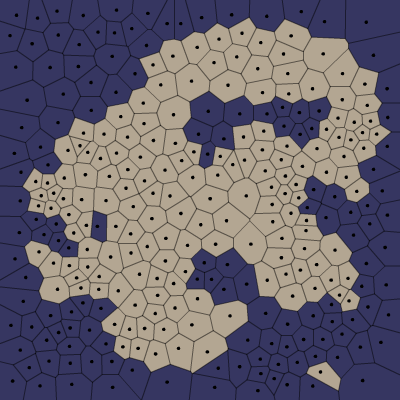
The next step is drawing the shoreline. The borders of the map should be water, but other polygons can be marked as water or land using any method you choose. The condition of the coastline is the proximity of land and water.
Here is an example of the division of the world into land and water:
In the source code,
Map.as contains the base code for generating the map. The IslandFunction code returns True if the position is land, and False if IslandFunction water. The demo includes four functions of the island:Radialuses sine waves to create a round island.PerlinusesPerlinnoise to control the shapeSquarefills the entire map landBlobdraws my logo .
You can use any shape, ( even fat stains on the pizza box ). In the future version of this project, I hope to add a drawing tool that allows you to create your own forms.
The code sets the land / water value for both the centers and the corners of the polygons:
- Assign water / land for corners by installing
Corner.waterbased onIslandFunction. - We assign water / land to polygons by installing
Center.water, if some of the corners have a set of.
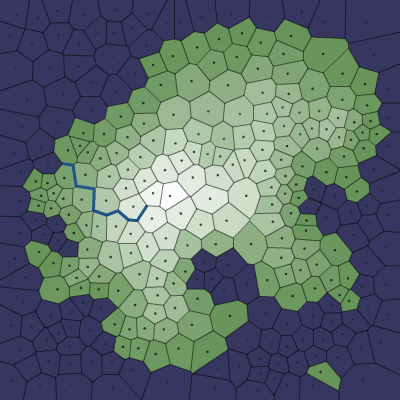
A simple fill, starting from the border of the map, can determine which areas of the water are oceans (connected to borders) and lakes (surrounded by land):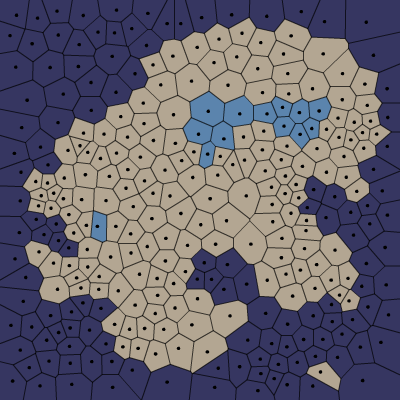
In the code, the fill is performed at the centers of the polygons, and then we decide what should happen to the corners:
- Set
Center.oceanfor any polygon connected to the map boundaries through water polygons. IfCenter.waterinstalled, and.oceanis not, then the area is a lake. - Set
Center.coastif the landfill is land but has a border with the ocean. Coastal areas will later be drawn as beaches. - Set the
Corner.oceanif the corner is surrounded by polygons of the ocean. - Set the
Corner.coastif the angle concerns the landfills of the ocean and land. - We
Corner.waterto maintain integrity with the surrounding area.
Height
It would be most realistic to first determine the heights and then define the coastline as the boundary where the height reaches sea level. Instead, I'll start in the reverse order. Take a good coastline, and I will begin to build on it. I will define altitude as the distance from the coast . Initially, I tried to make heights in the centers of polygons, but setting heights in the corners was more convenient. The edges connecting the corners can serve as valleys and ridges. After calculating the height of the corners (
Corner.elevation ), the height of the polygon ( Center.elevation ) is calculated as the average of the height of the corners. See the Map.assignCornerElevations and Map.assignPolygonElevations .For water polygons the distance is not calculated. Firstly, because I wanted the lakes to be flat, not sloping, and secondly, this is how valleys are formed around the lakes, which helps direct the rivers to the lakes.
There was one problem with this simple definition: some islands had too many mountains, while others had too few. To correct this, I redistributed the heights so that they corresponded to the desired distribution, at which there would be more land with a small height (coast) than with a large height (mountains). First, I sorted the angles by height, and then dropped the
x heights of each of them to match the desired distribution function: y(x) = 1 - (1-x)^2 . In Map.redistributeElevations , the y coordinate is the position in the sorted list, and x is the desired height. Using the formula for the roots of a quadratic equation, we can calculate the value of x . At the same time, order is maintained, i.e. elevation always increases when moving from shore to mountains.When moving from any point downwards, we will definitely come to the ocean. This diagram shows the direction of the steepest descent from each corner, stored in
Corner.downslope :Following the down arrow, we will gradually come to the ocean. This will be useful for rivers, but may also be useful for calculating watersheds and other characteristics.
My height serves two main purposes:
- Types of biomes : great heights become snowy, stony or tundra. The average heights are shrubbery, deserts, forests or meadows. Small heights become rain forests, meadows and beaches.
- Rivers flow from areas with high altitudes to the coast. Our heights always increase with distance from the coast, that is, there are no local minima that complicate the generation of rivers.
In addition, in games you can find your own application of data about heights. For example, in Realm of the Mad God heights are used to distribute monsters.
This calculation of heights is suitable for simple islands, this is exactly what I needed for Realm of the Mad God. To generate continents, you will need to change this step to generate one or more mountain ranges that are not necessarily located in the center, as well as individual volcanoes.
Rivers
I wanted to use two sources of fresh water: rivers and lakes. The most realistic would be to determine the humidity depending on wind, cloudiness, dampness and precipitation, and then calculate the locations of rivers and lakes. Instead, I start again from the end, that is, from good rivers, and go back.
The shape of the island determines the location of areas of water and land. Lakes are polygons of water that are not oceans. Rivers use the descent directions shown above. I chose random locations of corners in the mountains, and then went down the
Corner.downslope to the ocean. The river flows from corner to corner:I tried to allow both between the centers and between the corners of the polygons, but I found out that the graph of angles creates much more beautiful rivers. In addition, the lakes remain flat, so that the heights near the lakes are usually smaller. Therefore, rivers naturally flow in and out of lakes. Several rivers may have a common mouth. Each time a river flows across the edge, I increase the volume of water stored in
Edge.river by 1. During rendering, the width of the river is the square root of the volume. This approach is simple and works well.Humidity
Since I am performing the process in the opposite direction, I do not need the humidity to determine the presence of rivers. However, humidity can be useful in distinguishing between biomes (deserts, swamps, forests, etc.). Since rivers and lakes should be formed in areas of high humidity, I decided that humidity would decrease with increasing distance to fresh water .
Corner.moisture defined as a^k , where a <1 (for example, 0.95), and k is the distance. Unfortunately, in Map.assignCornerMoisture there are settings that I had to adjust to make the maps look convincing:As in the case of heights, I redistributed the humidity to match the desired distribution. In this case, I wanted to have approximately the same amount of dry and wet areas. The desired distribution function is
y(x) = x , so the redistribution code is very simple. I sort the corners by humidity, and then assign the humidity of each corner angle position in the sorted list. See code in Map.redistributeMoisture .In this map generator, humidity is used only for biomes. However, in games you can find humidity data for other uses. For example, in Realm of the Mad God, humidity and altitude are used to distribute vegetation and monsters.
Biomes
Altitudes and humidity together provide good variability for assigning biome types. I use altitude as a substitute for temperature. If I made a generator of continents, then latitude could influence the temperature. In addition, wind, evaporation, and rain shadow areas could be used to carry moisture like damp. However, for this generator, I took a simple principle. First, biomes depend on where they are located, in water or on land:
- this is any polygon of water, connected to the border of the map- any polygon of water not connected to the border of the map.Lake is a lake at high altitude (low temperature).- low-altitude lake- any land plot near the ocean
For all landforms, I started with the Whittaker diagram and adapted it to fit my needs:
| Zone heights | Humidity zone | |||||
|---|---|---|---|---|---|---|
| 6 (wet) | five | four | 3 | 2 | one (dry) | |
| four (high) | | | | | ||
| 3 | | | | |||
| 2 | | | | | ||
| one (low) | | | | | ||
These biomes look good in the demo, but each game will have its own needs. For example, in the Realm of the Mad God, these biomes are ignored and their own biomes are used (based on height and humidity).
Noisy ribs
For some games, polygonal maps are enough. However, in others the polygonal structure needs to be hidden. The main way to do this is to replace the borders of the polygons with a noisy line. Why did I create a polygonal structure if I am going to hide it? I think the mechanics of the game and the algorithm for finding ways will benefit from having an internal structure.
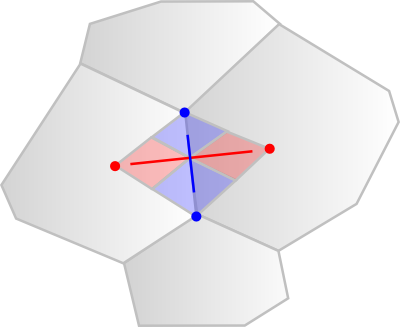
Recall that earlier we had two graphs: one for the Voronoi corners (
1 , 2 in the diagram below) and edges (blue lines), and the other for the centers of polygons ( A , B ) and Delone edges (red lines) between them:I wanted to make both types of lines noisy so that they would not cross lines from other polygons. In addition, I wanted them to be noisy and believable. I realized that points
A , 1 , B and 2 form a quadrilateral, and it is possible to limit the deviations of a line segment by this quadrilateral:I divided the quadrilateral into four quadrilaterals. Two could be used for the red rib (Delone), and two for the blue rib (Voronoi). Since the lines remain in their allocated space and are connected in the center, they will never intersect. So we have limited them. Note that a quadrilateral may not be convex. To divide it correctly, I divided it from the middle of the Voronoi rib instead of dividing at the intersection of the Voronoi and Delone edges.
The whole map can be divided into areas of quadrangles between which there will be no empty space:
This ensures that noisy lines will not be unnecessarily restricted. (I wonder if these quadrangles can be useful in game mechanics?)
You can use any noisy line algorithm that satisfies these limitations. I decided to recursively subdivide the quadrilaterals and connect the line segments in small quadrilaterals into a full edge. The algorithm is in
NoisyEdges.as , the buildNoisyLineSegments function. As a result, the edges of the polygons become curved:You can adjust the noise in three places:
- The results of the recursive function become segments smaller than a certain length. I have an example of the length of segment 7 , the length of segment 4 and the length of segment 1 . In the demo maps, I used the size of the segment 1 for rivers and coasts, 3 in places of meeting biomes, and 10 in all other cases.
- There is a ratio between what space is given under the red quadrilaterals (Delone edges) and the blue quadrilaterals (Voronoi edges). I chose a ratio of 0.5 in
NoisyEdges.NOISY_LINE_TRADEOFF. - In
NoisyEdges.subdividethere is a range of random numbers. In my demo, the selected range is 0.2-0.8, but it can be in the range of 0.0–1.0. In addition, random numbers do not have to be linear. More visual noise is obtained by avoiding a gap of about 0.5.
It turned out that noisy ribs strongly influence the appearance of the map, especially rivers and coastlines.
More noise
I usually like the noise in the game art , and I wanted to add some more noise to the maps. In a real game map, noise may reflect vegetation or slight variations in topography. In the demo (
mapgen2.as ), I filled the screen with a random noise texture, placing a noisy bitmap over the map. I also smoothed the boundaries between neighboring polygons, gradually mixing colors:Here is the result of rendering with 16,000 polygons, noisy edges, superimposed noisy texture and simple lighting:
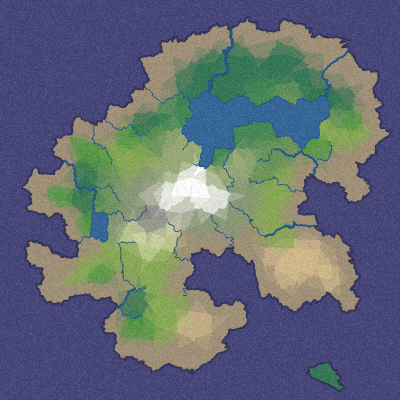
Smooth transitions between biomes
Another way to mix biomes at the boundaries of polygons is to create gradients based on the height and humidity of each corner with the pixel-like biome assignment:
If the game does not require the entire polygon to belong to the same biome, then this approach may be useful for creating more interesting boundaries.
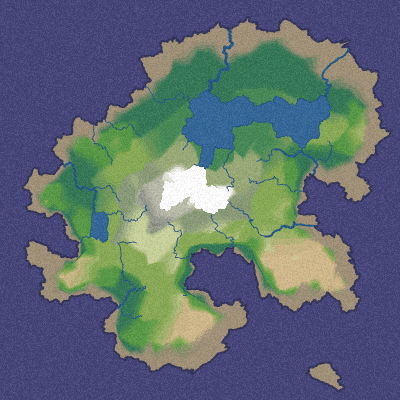
Distorted Biome Transitions
Another way to make the map less polygonal is to distort the height and humidity maps:
- Add Pearlin noise or random noise to the height and humidity of each pixel.
- Sample nearest points using Perlin or random noise to change coordinates.
Here is an example of how this can be achieved:
Adding noise to the height and humidity creates "fluctuations" in the areas near the transitions. Sampling nearby points using noise distorts the shape of the borders.
Demo
To study the generated maps, I wrote a demo in Flash:
Try the demo !
Source
I posted the sources on Actionscript under the MIT license, they are available on github .If you can read Java or Javascript, then I think you can figure it out with Actionscript. I do not expect that the code will immediately become useful for everyone, but it can be a good starting point if you want to use these techniques to create your own game maps.
Map.as- this is the basic card generation systemgraph/*.as- graph representation (polygons, edges, angles)mapgen2.as- demo with rendering and GUIRoads.as- module adding roads along contour linesLava.as- module that adds rifts with lava on the ribs with high altitudeNoisyEdges.asused in the demo to create noisy edges
The diagrams in this article are created from 300 polygons, by default, the demo uses 2000 with a maximum of 8000. Some of the code for creating diagrams was not checked, because it is “fast and dirty” code written only for the diagrams of this article and is otherwise useless.
If the code or my thoughts seem useful to you, I will be glad to know about it.
Projects investigating other algorithms
- Andy Gainey experimented with Voronoi diagrams on the sphere and decided instead to create a map of subdivided icosahedra with tectonic plates, air currents, temperature, humidity and biomes. I was asked how to expand my map generator to create continents: it’s worth exploring the Andy project.
- ' (Martin O'Leary) , , , /, . (Scott Turner) , , 2016 . (Ryan Guy) .
- (Miguel Cepero) Voxel Farm , .
- (Tommy Waters) . , , , .
- ylcorcronlth
- (Cory Lee) .
- (Jesse Morgan) , ( )
- Sword & Scroll ( )
- (Phill Spiess) , .
- (Christophe Le Besnerais) Javascript- . luckylooke Phaser.io .
- (Kaelan Cooter) , , , , .
- (Richard Janicek) Haxe- , Javascript+Canvas . Javascript- .
- (Jeff Terrace) XML COLLADA , COLLADA WebGL.
- (Alex Schröder) Perl- , SVG.
- (Christopher Garrett) Voronoi/Delaunay iOS .
- (Adam Martin) Voronoi/Delaunay Unity , (Julian Ceipek) .
- (Christophe Guebert) Java+Processing .
- (Baran Kahyaoglu) C#/.NET ( ), abhimir Unity- , (Chris Herborth) .
- (Tommy Waters) Javascript- .
- Haxe/NME .
- (Connor Clark) Java- .
- Kylepixel Javascript , .
- Nuclear Horse Studios C#/Unity ( MIT).
- (Stafford Williams) C#/Unity ( MIT).
- (Gareth Higgins) C# .
- (Martín Candela Calabuig) C++ .
- (Tobias) C++
- (Spencer Judge) C++ .
- BitAlchemists Dart .
- . (Thomas R. Koll) Lua , Autonomous Planetary Research Individual 50 .
- Island — Scala, , .
- PtolemyJS — Javascript .
- (Jay Stevens) C++ Unreal 4 ( MIT).
Other projects
- PolyWorld Java- Terasology (. ).
- Conquest .
- Besiege .
- TerraFirmaCraft 2 .
This map generator was not intended for direct use, but in Welsh Piper ( monster encounter tables , Minocra ), Kingdoms in Trevail , Cresta, and other ( 1 , 2 , 3 , 4 , 5 , 6 ) games, the map generator is used to create maps . Click the “export PNG” button to export a 2048x2048 PNG file, which you can then adapt to Photoshop for color, style, and markup.
Appendix: Additional map features
Modules
I tried to structure the presentation of the maps so that the modules could mark them without creating dependencies on the code. The GUI module
mapgen2.asdepends on Map.as(base module) and Roads.as(side module), but Maps.as does not depend on Roads.as. Each polygon, edge, and angle in a graph have an index that can be used as a key in an external table. In Roads.asthere is an array roadindexed by the index of the ribs.Where the base code of the card can refer to
edge.riveras the base to the field, the module cannot do this. Instead, the module refers to a local variable road[edge.index]. This works for both centers and polygon corners. In this case, the base code remains clean.I have three modules: Roads, Lava, and NoisyEdges.
Roads
Realm of the Mad God does not use most of the functions of this map generator, but for it I created a road generator. I noticed that in the game, users naturally explore the rivers. Rivers lead players to the mountains where they die. I wanted to build roads at right angles to the rivers.
I calculated the contour lines along the corners. Where the contour level changes, there is a road. This is a fairly simple algorithm, which is suitable in most cases, but sometimes creates small loops:
As the rivers meander along the Voronoi ribs (the blue lines in the diagram above), the roads run along Delaunay ribs (red lines). Roads are not handled by noise. Instead, they are drawn by splines between the midpoints of the edges:
Most landfills have two “neighbors” with roads. For them, the usual spline is used, connecting the two midpoints of the edges. For polygons that have more than two “neighbors” with roads, I draw an intersection with splines from all midpoints of the edges to the center of the polygon. In the diagram above, the lower left polygon has an intersection, and the upper right polygon has an ordinary spline.
Lava
Lava and the river follow the same paths. Lava faults occur in high dry areas and are assigned to a subset of edges. In the game, lava and water, of course, will be different, but they differ only in color and location. Lava edges processed by noise:
Appendix: Opportunities for Improvement
Abstract rendering
The map should correctly display the relevant parts of the world, not all the details. In this project, I generate maps with a certain level of detail, but I don’t get to the detail of vegetation or cities, although maps are not completely abstract at the same time. It may be possible to render more abstract maps in the style of maps of Middle-earth (like this ). I wrote notes about what I wanted to see in the game cards .
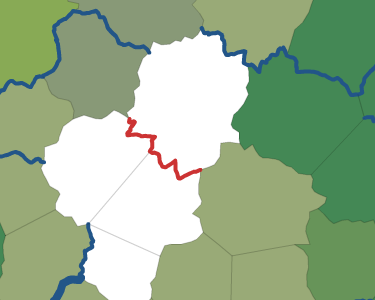
Watersheds
Following the down arrows (see the description in the section on heights), you can always find a path along the edges from any angle of the polygon to the coast. I use them to mark the places where water should flow into the ocean. All corners with the same source location can be considered part of the same watershed.
The watershed code is incomplete. There is a watershed mode in the demo, but I don't like it. I tried to use the centers and corners of polygons as watershed boundaries, and in both cases the results were not good enough. I decided to postpone the calculations of the watersheds until they are needed.
I think that the watersheds could be useful to give names to large areas.. In the demo on the map about 1000 polygons of land. For a game map, it would be nice to have fewer areas with names than polygons grouped together. For example, XYZ mountains can be located above the XYZ valley, through which the XYZ river can flow. Players will be able to understand that all these toponyms are related. In this project, I did not advance much, but sooner or later I can return to it.
Impassable boundaries
In my map generator, all boundaries between polygons are the same. Between them there are smooth transitions. It may be interesting to make some edges intermittent, so we can create rocks, abysses, plateaus and other abrupt changes in elevation. See this article for how the Voronoi areas can be interesting for the gameplay.
Relief analysis
On polygonal maps, the search for paths must be fairly fast, and it can be used for the analysis of the relief. For example, if two points are spatially close, but the path between them is long, this may mean that there is a bay or a mountain on the way, and that this will be a good place for a tunnel or bridge. The pathfinding algorithm can also find places where bridges to the nearest islands are required. Path polygons may strategically be more valuable than polygons rarely used for paths.
Named areas
As I mentioned in the section on watersheds, I want to give names to different areas of the map. Combining this function with the analysis of the relief, you can give names to rivers, mountains, lakes, groups of landfills, coastlines, oceans, forests, peninsulas, valleys, etc. Names in one area may be related. I did not work on this part, because I think that it is useful only in a particular game, and not in the general map generator. With the theme of the game should be associated not only the names, it may be objects, quests and elements of the plot. For example, the XYZ sword can only be found in the XYZ valley.
Variable density
You can use the Forchun algorithm to subdivide a polygon into smaller polygons. A map on which most of the world is roughly outlined, and some areas more detailed, may look interesting. As an alternative approach, we can arrange initial points with variable density, so that in some areas there are more polygons than in others. For example, instead of using the Lloyd algorithm, you can apply an excess sampling of anti-aliasing .
Improving Noisy Ribs
I implemented a very simple noisy rib system with jagged lines. When you increase the map angles are very noticeable. You can improve the system with the help of spline curves or fractal expansion, which will look more detailed when scaled.
Appendix: Process Improvement
This article was first three posts: part 1 on landfills, map views, islands, oceans, lakes, beaches and land; part 2 about altitudes, rivers, humidity and biomes; Part 3 about rendering, demo and source code.
If anyone is interested in how I came to this, then here is a brief history:
- 2009 Wild Shadow Studios , . , , . , . , , . , — , , , AI NPC ..
- 2010 . , . , , , , , , - . . . , , . , , . , .
- , . 4 , . , , , , , , . . ! ó .
- , . , , . , UI . UI , . , .
- By the end of August, I realized that I was working only on minor improvements, and decided that the project was ready for winding up. I spent a long weekend in honor of Labor Day, writing down the results in this article (and posts). It took a lot of time to create high-quality diagrams. The diagrams revealed new bugs, so I switched to eliminating them, significantly simplifying one function (redistributing heights) and implementing a new one (redistributing humidity). In addition, I renamed and commented on the code to make it easier to explain.
Why am I tracking all this? Because I'm trying to improve the process of working with such small (1-3 months) projects. Here is what I want to remind:
- , . , , . . , …
- , . , . .
- . , . .
- . . .
- , . , .
- . . , , , , git .
- , . , . .
- , . . , .
- Great help was given by writing blog posts . They made me understand all parts of the system, look at all the data, and ensure that all the code is understandable. The posts forced me to check every step of the map generation and improve those that are difficult to explain. You need to start writing blog posts much earlier in the process. Explanation is a good way to learn.
I will take these lessons into account when working on new projects.
Appendix: Links
I thank the Dungeon League blog for the excellent series of procedural map generation posts, the Procedural Content Generation wiki for ideas on generating maps , the incomplete Voronoi wiki for useful resources about Voronoi diagrams.
Thanks
nodenamefor as3delaunay . This is an Actionscript 3 library for generating Voronoi and Delone graphs. Also, thank you very much polygonalfor PM_PRNG , a library of random numbers, which allowed me to use and change the seed value to reproduce sets of pseudo-random numbers. I used the OptiPNG library to optimize the PNG images of this article.Delaunay triangulation andVoronoi polygons are studied in many graphics courses. For example, see Stanford CS 368 (PDF). I also studied relative adjacency graphs and Gabriel graphs , but did not use them.
Delaunay triangulation can be used for cards in the form of a triangulated irregular structure . Voronoi diagrams are also used to create maps.
The Forchun algorithm is one of the algorithms capable of turning a set of points into Voronoi polygons. This is implemented in
as3delaunay. Lloyd's algorithm is used to improve the distribution of random points. It reduces the irregularity of the Voronoi polygons. On the Voronoi wiki there is incomplete information on the presentation of graphsand the presentation of the ribs , as well as two pages that helped me in generating the rivers: rivers and watersheds and the crust and skeleton .The Relief Shading website has images of relief shading maps , as well as instructions for shading and coloring design. It is sad that I did not have enough time to apply these techniques. I also studied the Bing and Google maps to understand how various features are drawn in them; see this article , my blog post and this article .
The Whittaker Chart is one way to predict common biomes with a given climate. Wikipedia has a page withbiome classification schemes and different biomes .
Also in Wikipedia there is a good list of landforms that you can try to generate with the help of a game map generator. For my project, I have not studied this list.
Ken Perlin (Ken Perlin) - master of work with noise, he came up with the noise of Perlin. He also created a lesser-known simplex noise (PDF). In my project, I used Perlin's noise to create the overall shape of the island. Joe Slayton has a page on how to turn Perlin’s noise into islands . I was looking for information about blue noise and, before I found Lloyd’s algorithm for improving the distribution of random points, I came across an article by Dunbar and Humphreys about noise generation., as well as on Van's recursive tiles . I also looked at the textures of Craig Reynold (Craig Reynold) , but did not have time to apply them anywhere.
It is also interesting to show these articles of generating world , nature map generator Gozzy , the world generator donjon , an article on procedural generation roads , an article on procedural generation cities . It seems that direct skeletons can be useful for defining mountain ranges, but as soon as I saw how well the “distance from the coast” approach works, I didn't need anything else. Quite interesting is the generation of 3d-cards in Dwarf Fortress .
Source: https://habr.com/ru/post/322504/
All Articles