Escape analysis and scalarization: let GC rest
This time we decided to diversify the flow of technical interviews with real hardness and prepared a material based on the report of Ruslan cheremin Cheremin (Deutsche Bank) about the analysis of the work of the pair Escape Analysis and Scalar Replacement, made by him at JPoint 2016 last April.
Video of the report in front of you:
')
And under the cut, we have laid out the full text decoding with separate slides.
Let's start with a small lyrical digression concerning terminology.
Escape analysis is a code analysis technique that allows you to statically (at compile time) determine the reachable area for an object to reference. Roughly speaking, there is an instruction that allocates an object, and in the course of the analysis we are trying to figure out whether another instruction can somehow get a link to the created object.
Escape analysis is not an optimization in itself, it is just an analysis, but its results can be used for subsequent optimizations. Usually, of course, we are interested in reachability not up to the instruction, but something like “whether an object created in some method is reachable is outside this method”. And as part of the optimization task, we are most interested in situations where the answer is “no, outside the method the object is not reachable”.
Scalarization (Scalar Replacement). Scalarization is the replacement of an object that exists only within a method with local variables. We take an object (in fact it is not there yet - it will be created when the program is executed) and we say that we do not need to create it: we can put all its fields into local variables, transform the code so that it accesses these fields, and from the code to erase.
I like the metaphor that EA / SR is such a static garbage collector. Normal (dynamic) GC runs in runtime, scans the object graph and performs reachability analysis — it finds the objects that are no longer reachable and frees the memory they use. The “escape analysis - scalarization” pair does the same thing during the JIT compilation. Escape-analysis also looks at the code and says: “The object created here after this instruction is no longer reachable, therefore, under certain conditions, we can not create it at all”.
A pair of Escape Analysis and Scalar Replacement appeared in Java for quite some time, in 2009, first as an experimental option, and from 2010 it was enabled by default.
Are there any results? In the narrow circles at Deutsche Bank, a real fragment of the garbage collector loading schedule, made in 2010, runs. The picture illustrates that sometimes for optimization you can do nothing at all, but just wait for the next Java update.
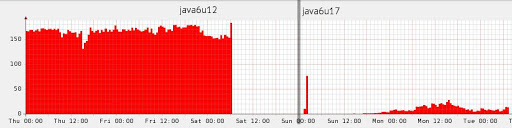
Source: dolzhenko.blogspot.ru
Of course, this is very rare, this is an exceptional case. In more realistic examples, according to different data in an average application, escape analysis is able to eliminate about 15% of allocations, well, and if you are very lucky, then up to 70%.
When this tool was released in 2010, I was, frankly, very inspired by it. I then just finished the project, where there were many pseudoscientific calculations, in particular, we actively juggled with all sorts of vectors. And we had a lot of objects that live from the previous instructions to the next. When I looked at it, I had a seditious thought in my head that it would be better on C here. And after reading about this optimization, I realized that she could solve such problems. However, Sun in the release had a very modest example of its work, so I waited for some more extensive description (in which situations it works, in which it does not; what is needed for this to work). And I waited for quite a long time.
Unfortunately, in 7 years I have only mentioned three cases of use, one of which was an example of the Sun itself. The problem with all the examples was that the articles cited a piece of code with a comment: “this is how it works.” And if I rearrange the instructions, does the scalarization break it? And if instead of ArrayList I take LinkedList, will it work? It was not clear to me. In the end, I decided that I would not wait for someone else's research, i.e. This work will have to do yourself.
What did I want to get? First of all, I wanted some kind of intuitive understanding. Clearly, JIT compilation in general is a very complex thing, and it depends on many things. To understand it in detail, you need to work in Oracle. I had no such task. I need some kind of intuitive understanding so that I look at the code and appreciate that here, almost certainly yes, and here, almost certainly not, but here it is possible (it is necessary to investigate, it can be possible to make this particular allocation scalarize ). And for this you need a set of examples on which you can see when it works, when it does not work. And a framework to make it easy to write these examples.
Before we proceed to the experiments themselves, there is still a small theoretical digression. It is important to understand that escape analysis and scalarization are only part of a large set of optimizations that are in the server compiler. In very general terms, the C2 optimization process is presented in the figure.
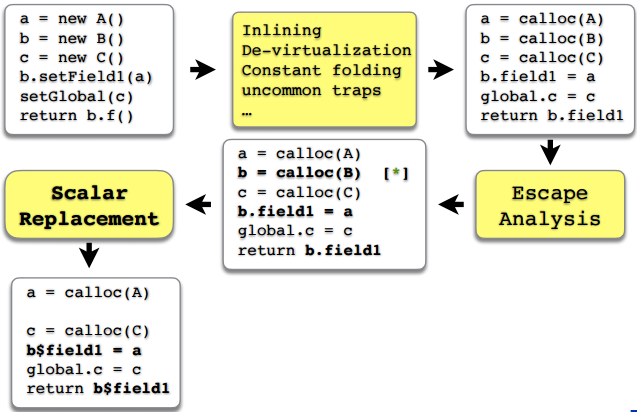
The important thing is that even before the escape analysis, other optimization tools take over. For example, inlining, devirtualization, folding constants and allocating frequent or non-frequent routes (in fact, there are much more of them, but here I have indicated those that most often affect the escape analysis). And so that, according to the results of the escape analysis, some objects would be scalarized, it is necessary that all previous links of the chain, previous optimizations, should work well before the escape analysis and scalarization. And something can break, it can not happen at any stage, but, as we will see, most often something breaks just before the escape analysis. And only in some cases, it is the very escape analysis that does not cope with the task.
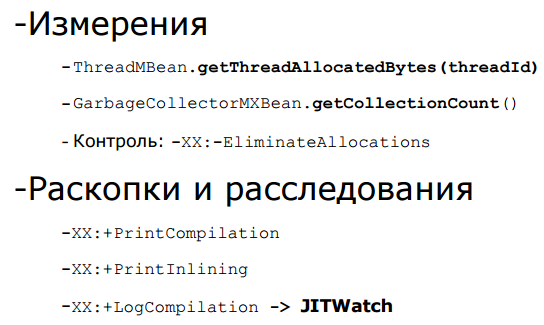
A few years ago, trying to experiment with scalarization, I mainly relied on
If the test result surprises us, there are the keys PrintCompilation and PrintInlining, which allow us to get more information. There is also a third key, LogCompilation, which gives all the same, only much more, and in the xml format - you can feed its output to the JITWatch utility, which will present you everything in a beautiful UI.
The logical question is: why not use JMH? JMH can really do this. It has a profiler,
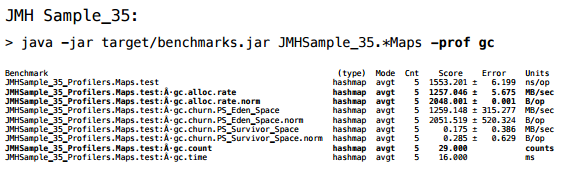
And at first I tried to come in from this side. But the fact is that JMH is primarily focused on a performance that doesn’t really interest me. I don't care how much time it took for me to iterate; I’m wondering if a specific optimization worked there, in other words, I need a trigger response. And there is a lot of information that I did not immediately find how to remove. And in the end I decided for myself that if I want to get the result within half an hour today, it’s easier to write myself. Therefore, I have my own "bicycle". But if someone wants to continue these experiments or make some of their own, I highly recommend taking the standard tool, as the standard is usually better.
Let's start with a simple test: similar to the example in the Sun release.
We have a simple Vector2D class. We create three random vectors with randomness and perform some operation with them (we add and calculate the scalar product). If we run this in a modern JVM, how many objects will be created here?
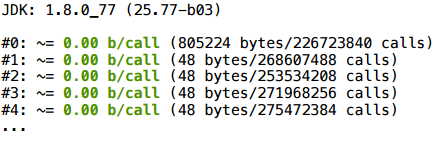
As a result, at the beginning something is allocated (not yet compiled), well, then everything is very clean - 0 bytes per call.
This is a canonical example, so it’s not surprising that it works.
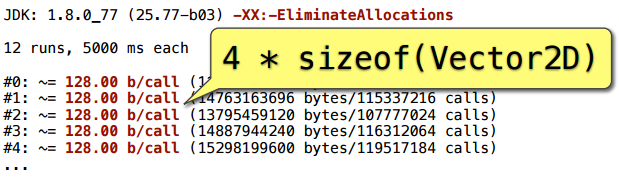
To control, we add a key that turns off erasing of allocations - and we get 128 bytes per call. These are just four Vector2D objects: three were clearly created, and another appeared in the course of addition.
Add a loop to the previous example.
We start a battery vector, to which we will add vectors inside the cycle.
In this scenario, everything is fine too (for any
This time, we will do the multiplication by a constant - by double, and write the result to the same variable. In fact, this is the same battery, only here we multiply the vector by some number.
Unexpectedly, but the scalarization did not work here (2080 bytes = 32 * (SIZE + 1)).
Before finding out why, consider a couple of examples.
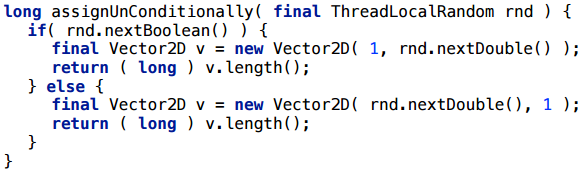
A simpler example: we do not have a cycle, there is a conditional transition. We randomly select a coordinate and create a Vector2D.
And here scalarization does not help: one vector is created all the time - the same 32 bytes.
Let's try to change this example a little. I will simply bring the creation of the vector into both branches:
And here everything is perfectly scalarized.
The picture begins to emerge - what is happening here?
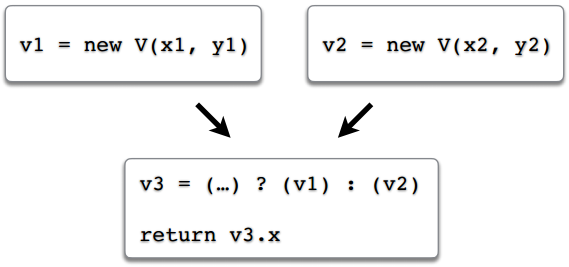
Imagine that we have a flow of execution in the program. There is one branch in which we created an object v1, and a second branch in which we created an object v2. In the third variable, v3, we write the link either to the first object, or to the second, depending on which route we followed. At the end we return some field via the link v3. Suppose that a scalarization has occurred and the fields v1.x, v1.y, v2.x, v2.y have become local variables, for example, v1 $ x, v1 $ y, v2 $ x, v2 $ y. And what to do with the link v3? Or rather: what should the appeal to the field v3.x turn into?
This is a question. In some simple examples, like here, or in example 1.4, the solution is intuitively clear: if this code is all we have, then you just need to return the return conditions inside, there will be two return ones, one for each branch , and each will return its value. But the cases are more complex, and as a result, the JVM developers decided that they simply would not optimize this scenario, because In the general case, to do this — to figure out which object field should be used — turned out to be too difficult (see, for example, bug JDK-6853701, or the corresponding comments in the source code of the JVM).
Summing up this example, there will be no scalarization if:
If you want to increase the chances of scalarization, then one link should point to one object. Even if it always points to the same object, but in different execution scenarios it can be different objects - even this is confusing escape analysis.
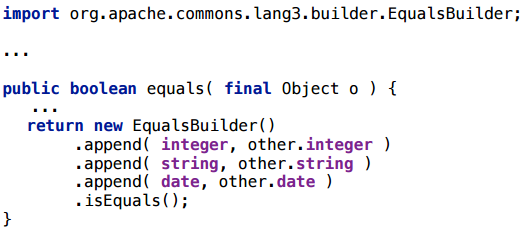
This is a class from commons.lang, the idea of which is that you can generate equals in this way by adding the fields of your class in Builder. Honestly, I don’t use it myself, I just needed an example of some Builder, and it came to hand. A real example is usually better than a synthetic one.
Of course, it would be nice if this thing would be scalarized, because creating objects for each equals call is not a good idea.
I wrote a simple piece of code - only two ints that were written out explicitly (but even if there were fields there, it wouldn’t change the essence).
Quite expectedly, this situation will be scalar.
Let's slightly change the example: instead of two ints we put two lines.
As a result, scalarization does not work.
Let's not climb into the .append (...) method for now. For a start, we have keys that at least briefly tell what happens in the compiler.
It turns out that the append method did not zalinilitsya, respectively, the escape analysis can not understand: here is the link to the builder, which went into the .append () method like this - what happens to it, inside the method? This is unknown (because the compiler does not look inside the .append method - JIT does not do inter-procedural optimization). Maybe it was assigned to a global variable there. And in such situations, escape analysis is dealt.
What does the “hot method too big” diagnosis mean? It means that the method is hot, i.e. it was called quite a few times, and the size of its bytecode is larger than a certain limit, the inlining threshold (the limit is for frequent methods). This limit is set by the key FreqInlineSize, and by default it is 325. And in the diagnostics we see 327 - that is, we missed only 2 bytes.
Here is the contents of the method - it is easy to believe that there are 327 bytes:
How can we test our hypothesis? We can add the key FreqInlineSize, and increase the inline threshold, say, to 328:
In the compilation profile, we see that .append () is now inline, and everything is well scalarized:
I will clarify: when I change the JVM flags here, and the JIT compilation options, I do this not to correct the situation, but to test the hypothesis. I would not recommend playing with JIT compilation options, since they are selected by specially trained people. Of course, you can try, but the effect is difficult to predict - each such parameter affects not one specific method in which you want to scalar something, but the entire program as a whole.
Write short methods. In particular, in the example with .append () there is a large sheet that works with arrays - trying to make a comparison of arrays. If you simply put it into a separate method, then everything is perfectly inline and scalarized (I tried). This is such a black (although it may be white) move for this heuristic of inlining: the method of 328 bytes is not inline, but it’s broken into two methods of 200 bytes — it is perfectly inline because each method separately crawls under the threshold.
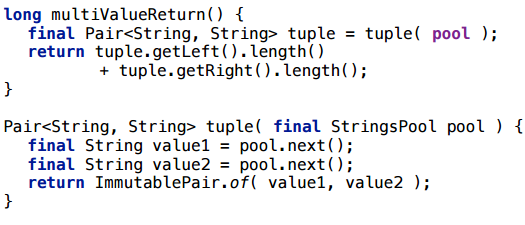
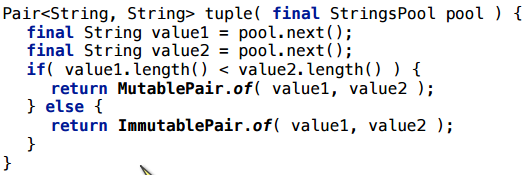
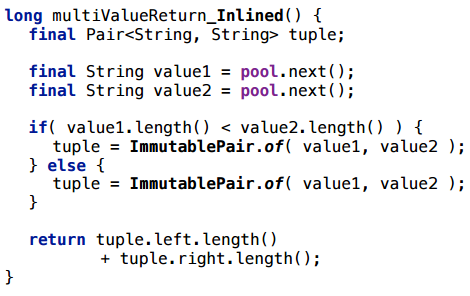
Consider returning a tuple from a tuple method — several values at a time.
Take some simple object, such as Pair, and a completely trivial example: we return a couple of rows randomly selected from some pre-filled pool. To prevent the compiler from throwing out this code at all, I will bring in some side effect: I will count something with these type lines, and return the result.
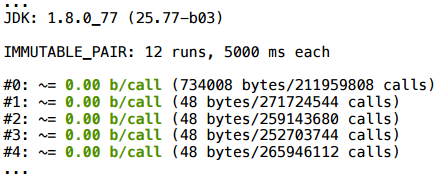
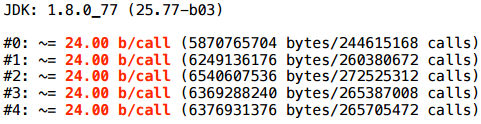
This script is scalarized. And this is quite a working example, you can use it: if the method is hot and inline, such multi-value return will be perfectly scalarized.
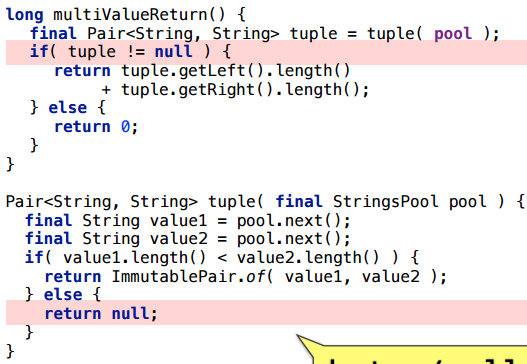
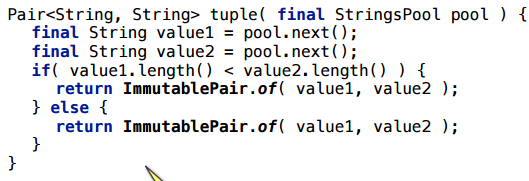
Let's slightly change the example: under some circumstances, return null.
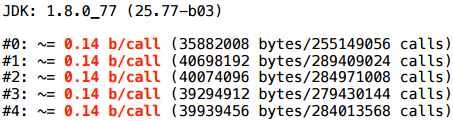
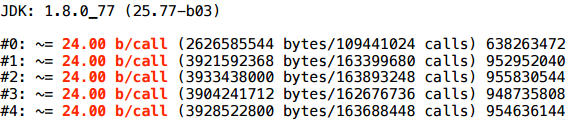
As you can see, the allocation will remain (the average number of bytes per call is not integer, because sometimes null is returned, which costs nothing).
A more complicated example: we have an interface-pair and 2 implementations of this interface. Depending on the artificial condition, we return either that implementation or another.
Here, too, is the allocation:
Honestly, initially I was sure that it was precisely in different types, and I believed in it for a long time, until I made the following example with the same types, which also does not scalar.
What's going on here? Well, if we try using handles to inline all the methods, we will see the same scenario with merge points (= the link can come in two ways) as in our very first experiment:
Keep it simple: fewer branches - less likely to confuse escape analysis
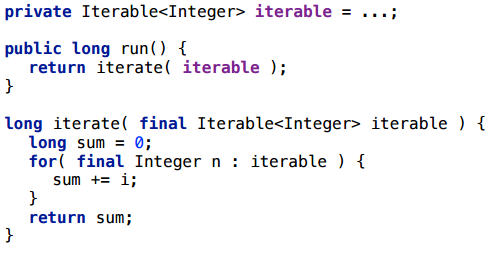
Another frequent pattern and very often an intermediate object, the creation of which I would like to avoid.
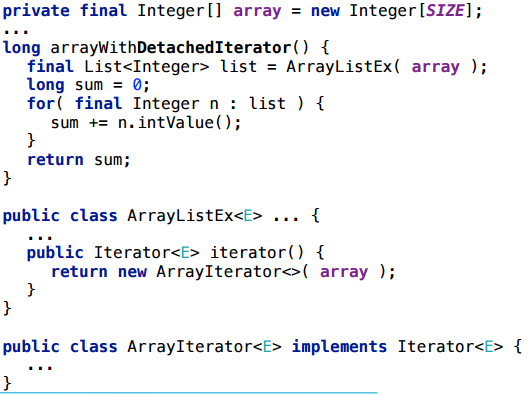
Here is a very simple scenario with iteration through the collection. We create a collection once, we do not re-create it for each iteration, but we re-create an iterator: at each method start we run through the collection as an iterator, we consider some side effect (just so that the compiler does not throw out this piece).
Consider this scenario for different collections. Suppose first for ArrayList
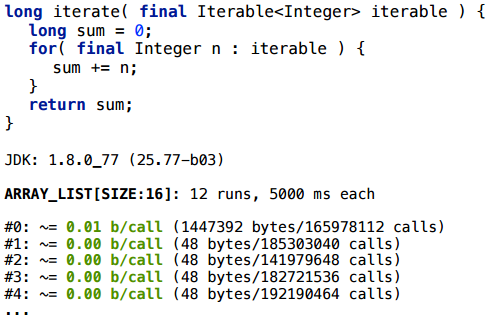
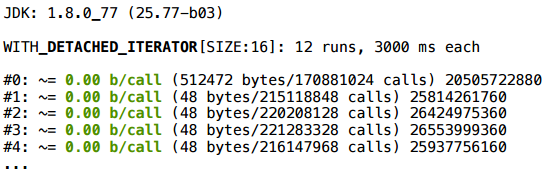
For ArrayList, the iterator really scalars (the size of SIZE here is conditional: as a rule, it works stably for a wide range of SIZE). For LinkedList this also works. I will not go through all the options for a long time - here is a summary table of those collections that I tried:
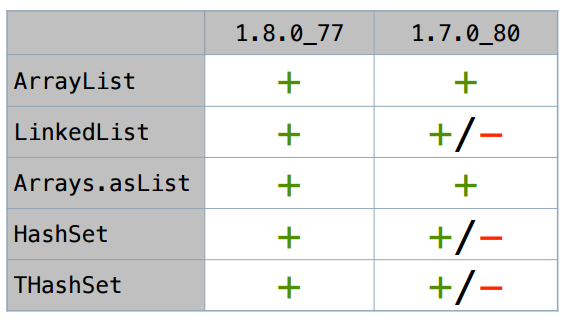
In Java 8, all these iterators (at least in simple scripts) are scalarized.
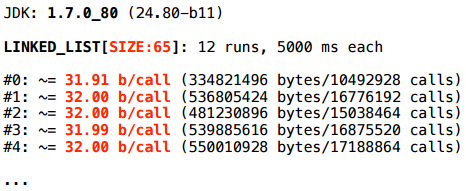
But in the freshest update Java 7 all smarter. Let's take a closer look at it (everyone knows that 1.7 is already the end of life, 1.7.0_80 is the last update that is).
For LinkedList with size 2, everything is fine:
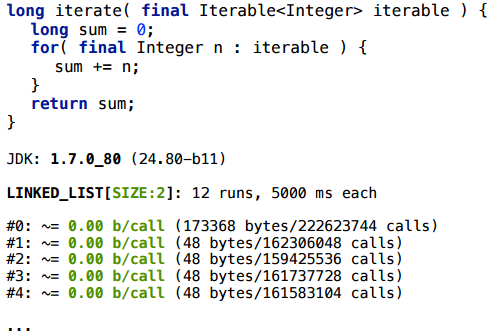
But for LinkedList with a size of 65 - no.
What's happening?
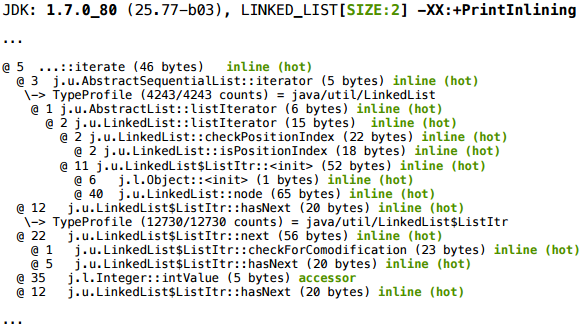
We take the magic keys, and for size 2 we get such a piece of inline log:
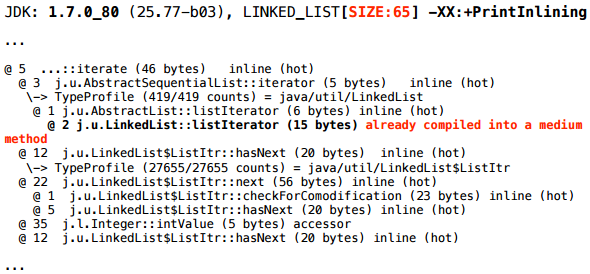
And for size 65:
Closer to the beginning of the same log you can find another such additional fragment of the picture:
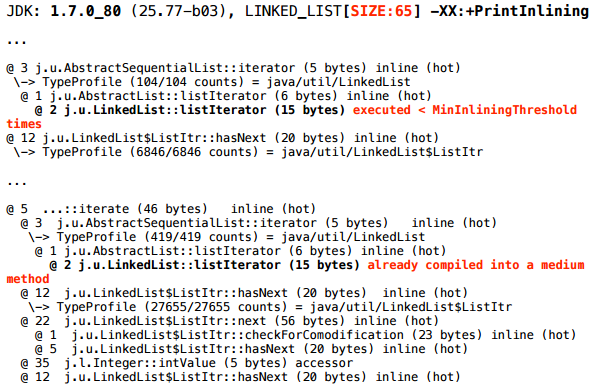
The following happens: at the very beginning the method we are profiling went to compile - JIT put it in a queue. JIT works asynchronously, i.e. it has a queue, compilation tasks are dropped there, and it in a separate stream (or even several streams) with some speed scoops them out of the queue, and compiles. That is, between the moment when he was assigned the task, and the moment when the new code will be optimized, some time passes.
And now our
Yes, but what exactly do diagnostics mean:
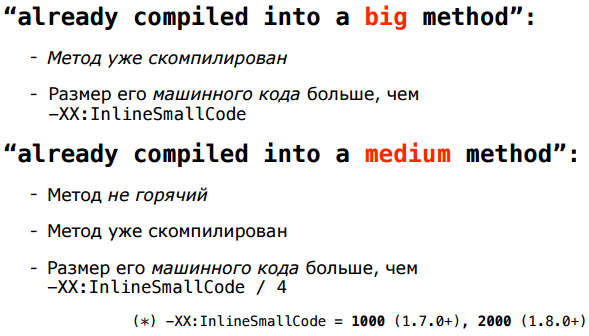
They mean that, estimating the size of already compiled methods, we look at their machine code, and not byte code (since this is a more adequate metric). And these two heuristics - in terms of bytecode and machine code - are not necessarily consistent. A method of just five bytecodes can invoke several other methods that will be pasted in and increase the size of its machine code above thresholds. With this mismatch, nothing can be done cardinally, just adjusting more or less the thresholds of different heuristics, and hopefully, on average, everything will be more or less good.
Thresholds - in particular, InlineSmallCode - differ in different versions. InlineKmallCode is 8 times larger in an 8-key, so this script works successfully in Java 8: the methods inline and the iterator scalars - and in 7-ke it does not.
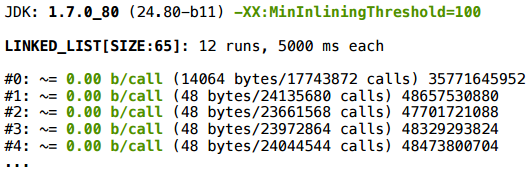
In this example, it is important that it is unstable. You must be (un) lucky so that the compilation tasks go in that order. If at the time of the second recompilation, the
We can test this hypothesis of ours: play around with thresholds. Indeed, when fitted, the scalarization starts to work:
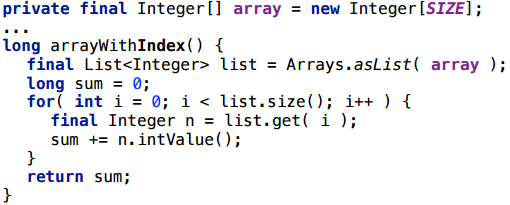
There is a separate interesting collection option - a wrapper around an array, Arrays.asList (). I would like this wrapper to be worth nothing so that JIT would scalar it.
I will start here with a rather strange scenario - I will make a list from an array, and then go through the list, as if by an array, with an index:
Everything here works, the creation of the wrapper is scalarized.
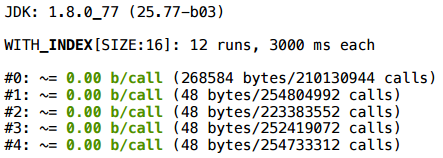
And now let's go back to the iterator - there is no special sense to wrap an array in a list, then to go through the list, like in an array:
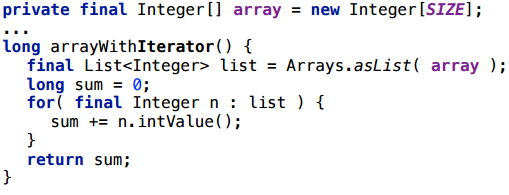
Alas, even in the latest version of java, the location remains.
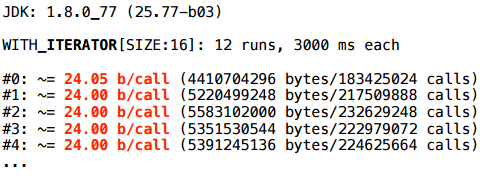
At the same time, we don’t see anything special in PrintInlining.
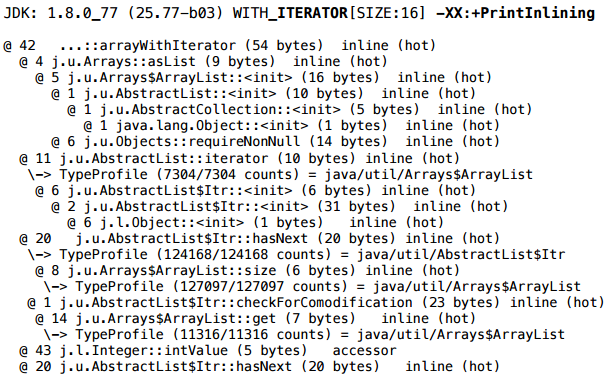
But if you look more closely, you will notice that the iterator in Arrays $ ArrayList is not your own - its implementation is inherited entirely from AbstractList:

And AbstractList $ Itr is an inner class, a non-static inner class. And the fact that it is non-static - for some reason, prevents scalarization. If you rewrite the iterator class (i.e., copy the whole Arrays $ ArrayList class to yourself and modify it), make the iterator untied, an array is passed to the iterator, and the iterator no longer contains a reference to the list object — then in this scenario it will successfully scalar as allocate the iterator and the allocation of the Arrays $ ArrayList wrapper itself.
This is a rather mysterious case, and it seems that this is a bug in the JIT , but to this day the moral is this: nested objects confuse scalarization.
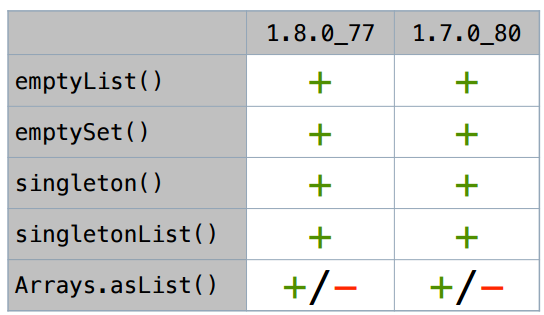
We still have some of these singleton collections, and all of them, and their iterators, are successfully scalarized both in the current and in the previous java versions, except for the above-mentioned Arrays.asList.
Nested objects do not scalar very well.
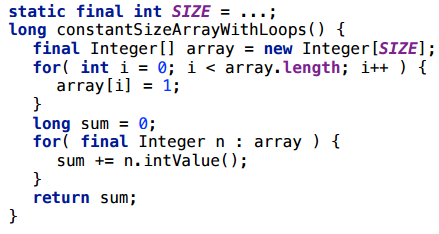
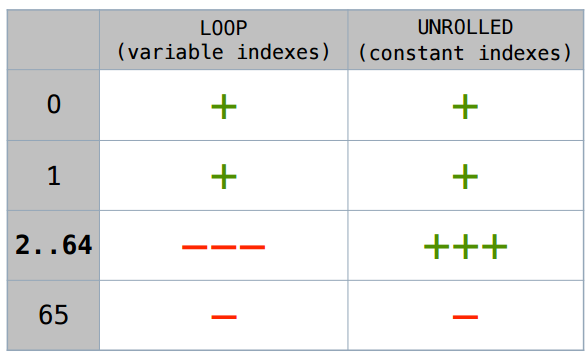
I’ll clarify right away that you don’t even hope for the scalarization of arrays of variable size (that is, a size that JIT cannot predict). We work with arrays of constant length.
Consider this example: we take an array, write something there in cells, then read something from there.
For size 1, everything is fine.
And for size 2 - nothing happens.
Let's try a slightly different access: take the same size 2 and just simply unroll the loop with the handles - take and turn on the explicit index:
In this case, oddly enough, the scalarization will work.
I will not argue long - below is the summary table. This case with a manually deployed cycle will be scalar up to size 64. If there is any variable index, sizes 1 and 2 will be more scalarized, then no.
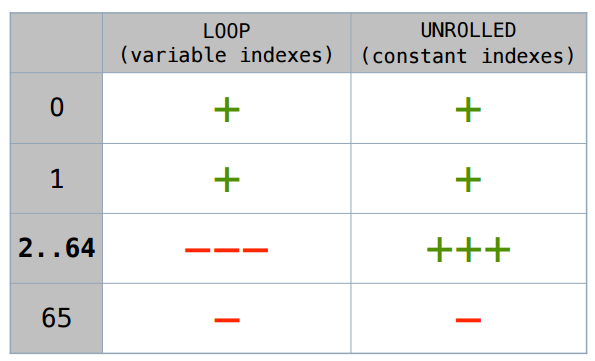
As someone wrote to me in a blog, in “JVM for everything there is a key”. This upper threshold (-XX: EliminateAllocationArraySizeLimit = 64) can also be set, although it seems to me that this does not make sense. In the limiting case there will be 64 additional local variables, which is too much.
Exactly the same code, only with an array of primitive types - int-th, short-th ...
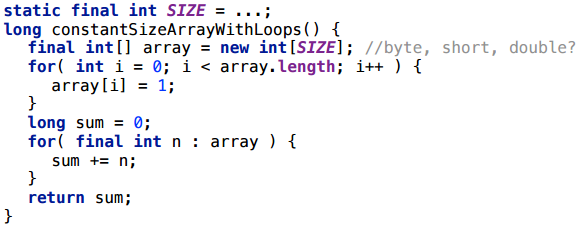
Everything works exactly in the same cases as for objects.
Why is it impossible to scalarize an array that we loop through? Because it is not clear which index is hiding behind i. If you have an array [2] type in the code, then JIT can turn this into a local variable of type array $ 2. And what does array [i] turn into? You need to know what exactly i is. In some special cases, in the case of short arrays, JIT can “guess” this, in general - no.
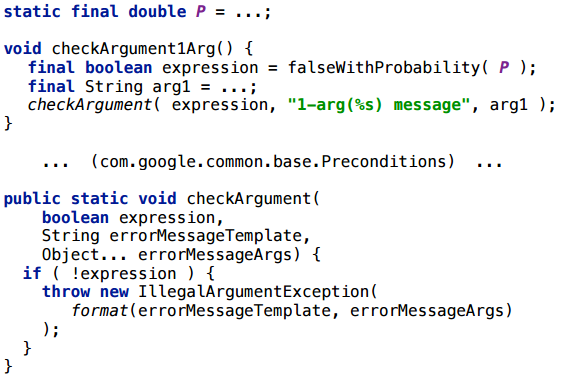
In the guava library, there is such a wonderful method, like
, expression . : vararg , expression false?
— 10 -7 :
.
10 -9 , , , , - .
, - :
… .
, — checkArguments, vararg — , , , expression false. checkArguments, expression false, - , - . , , , false , vararg , .
: ( JVM). , , . . - , .
— :
– JPoint 2017 (7-8 ) JBreak 2017 (4 ) . , – , .
Video of the report in front of you:
')
And under the cut, we have laid out the full text decoding with separate slides.
Let's start with a small lyrical digression concerning terminology.
Escape analysis and its place in optimization
Escape analysis is a code analysis technique that allows you to statically (at compile time) determine the reachable area for an object to reference. Roughly speaking, there is an instruction that allocates an object, and in the course of the analysis we are trying to figure out whether another instruction can somehow get a link to the created object.
Escape analysis is not an optimization in itself, it is just an analysis, but its results can be used for subsequent optimizations. Usually, of course, we are interested in reachability not up to the instruction, but something like “whether an object created in some method is reachable is outside this method”. And as part of the optimization task, we are most interested in situations where the answer is “no, outside the method the object is not reachable”.
Scalarization (Scalar Replacement). Scalarization is the replacement of an object that exists only within a method with local variables. We take an object (in fact it is not there yet - it will be created when the program is executed) and we say that we do not need to create it: we can put all its fields into local variables, transform the code so that it accesses these fields, and from the code to erase.
I like the metaphor that EA / SR is such a static garbage collector. Normal (dynamic) GC runs in runtime, scans the object graph and performs reachability analysis — it finds the objects that are no longer reachable and frees the memory they use. The “escape analysis - scalarization” pair does the same thing during the JIT compilation. Escape-analysis also looks at the code and says: “The object created here after this instruction is no longer reachable, therefore, under certain conditions, we can not create it at all”.
A pair of Escape Analysis and Scalar Replacement appeared in Java for quite some time, in 2009, first as an experimental option, and from 2010 it was enabled by default.
Are there any results? In the narrow circles at Deutsche Bank, a real fragment of the garbage collector loading schedule, made in 2010, runs. The picture illustrates that sometimes for optimization you can do nothing at all, but just wait for the next Java update.
Source: dolzhenko.blogspot.ru
Of course, this is very rare, this is an exceptional case. In more realistic examples, according to different data in an average application, escape analysis is able to eliminate about 15% of allocations, well, and if you are very lucky, then up to 70%.
When this tool was released in 2010, I was, frankly, very inspired by it. I then just finished the project, where there were many pseudoscientific calculations, in particular, we actively juggled with all sorts of vectors. And we had a lot of objects that live from the previous instructions to the next. When I looked at it, I had a seditious thought in my head that it would be better on C here. And after reading about this optimization, I realized that she could solve such problems. However, Sun in the release had a very modest example of its work, so I waited for some more extensive description (in which situations it works, in which it does not; what is needed for this to work). And I waited for quite a long time.
Unfortunately, in 7 years I have only mentioned three cases of use, one of which was an example of the Sun itself. The problem with all the examples was that the articles cited a piece of code with a comment: “this is how it works.” And if I rearrange the instructions, does the scalarization break it? And if instead of ArrayList I take LinkedList, will it work? It was not clear to me. In the end, I decided that I would not wait for someone else's research, i.e. This work will have to do yourself.
Experiment Path
What did I want to get? First of all, I wanted some kind of intuitive understanding. Clearly, JIT compilation in general is a very complex thing, and it depends on many things. To understand it in detail, you need to work in Oracle. I had no such task. I need some kind of intuitive understanding so that I look at the code and appreciate that here, almost certainly yes, and here, almost certainly not, but here it is possible (it is necessary to investigate, it can be possible to make this particular allocation scalarize ). And for this you need a set of examples on which you can see when it works, when it does not work. And a framework to make it easy to write these examples.
My task was experimental: let's say I have a JDK on my computer - what information about the principles of the work of the escape analysis can I pull out without addressing questions to the authorities? That is, it is such a natural science approach: we have an almost black box in which we “poke” and watch how it will work.
Before we proceed to the experiments themselves, there is still a small theoretical digression. It is important to understand that escape analysis and scalarization are only part of a large set of optimizations that are in the server compiler. In very general terms, the C2 optimization process is presented in the figure.
The important thing is that even before the escape analysis, other optimization tools take over. For example, inlining, devirtualization, folding constants and allocating frequent or non-frequent routes (in fact, there are much more of them, but here I have indicated those that most often affect the escape analysis). And so that, according to the results of the escape analysis, some objects would be scalarized, it is necessary that all previous links of the chain, previous optimizations, should work well before the escape analysis and scalarization. And something can break, it can not happen at any stage, but, as we will see, most often something breaks just before the escape analysis. And only in some cases, it is the very escape analysis that does not cope with the task.
Tools
A few years ago, trying to experiment with scalarization, I mainly relied on
GarbageCollectorMXBean.getCollectionCount() . This is a rather rough metric. But now we have a clearer Meric - ThreadMBean.getThreadAllocatedBytes(threadId) , which directly on the thread ID tells how many bytes were allocated by this particular thread. For experimentation, nothing more is needed, but I used the first, old metric at first to verify the results. Another way to control is to disable scalarization with the corresponding key ( -XX:-EliminateAllocations ) and see if the observed effect is really determined by the escape analysis.If the test result surprises us, there are the keys PrintCompilation and PrintInlining, which allow us to get more information. There is also a third key, LogCompilation, which gives all the same, only much more, and in the xml format - you can feed its output to the JITWatch utility, which will present you everything in a beautiful UI.
The logical question is: why not use JMH? JMH can really do this. It has a profiler,
-prof gc , which displays the same allocations, and even normalized to one iteration.And at first I tried to come in from this side. But the fact is that JMH is primarily focused on a performance that doesn’t really interest me. I don't care how much time it took for me to iterate; I’m wondering if a specific optimization worked there, in other words, I need a trigger response. And there is a lot of information that I did not immediately find how to remove. And in the end I decided for myself that if I want to get the result within half an hour today, it’s easier to write myself. Therefore, I have my own "bicycle". But if someone wants to continue these experiments or make some of their own, I highly recommend taking the standard tool, as the standard is usually better.
Part 1. Basics
Example 1.1. Basic
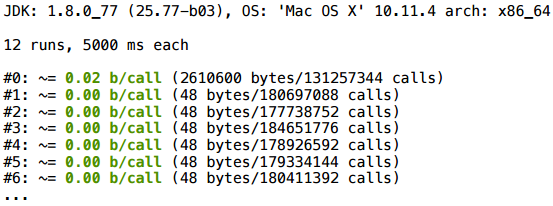
Let's start with a simple test: similar to the example in the Sun release.
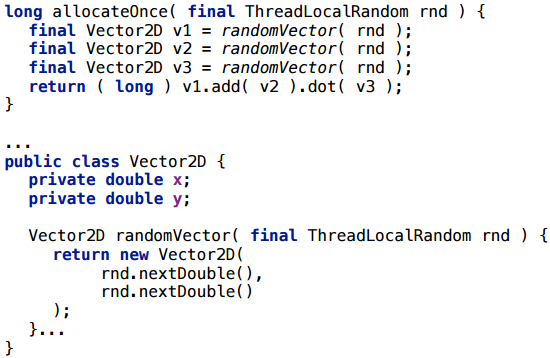
We have a simple Vector2D class. We create three random vectors with randomness and perform some operation with them (we add and calculate the scalar product). If we run this in a modern JVM, how many objects will be created here?
As a result, at the beginning something is allocated (not yet compiled), well, then everything is very clean - 0 bytes per call.
This is a canonical example, so it’s not surprising that it works.
To control, we add a key that turns off erasing of allocations - and we get 128 bytes per call. These are just four Vector2D objects: three were clearly created, and another appeared in the course of addition.
Example 1.2. Loop accumulate
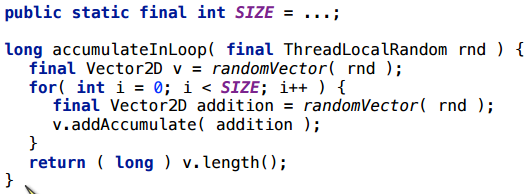
Add a loop to the previous example.
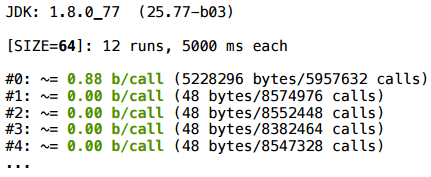
We start a battery vector, to which we will add vectors inside the cycle.
In this scenario, everything is fine too (for any
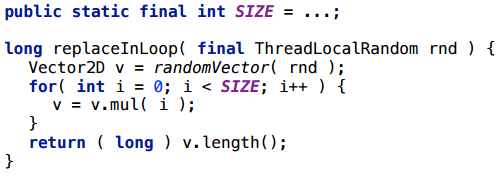
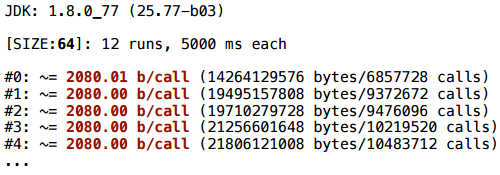
SIZE value that I researched).Example 1.3. Replace in loop
This time, we will do the multiplication by a constant - by double, and write the result to the same variable. In fact, this is the same battery, only here we multiply the vector by some number.
Unexpectedly, but the scalarization did not work here (2080 bytes = 32 * (SIZE + 1)).
Before finding out why, consider a couple of examples.
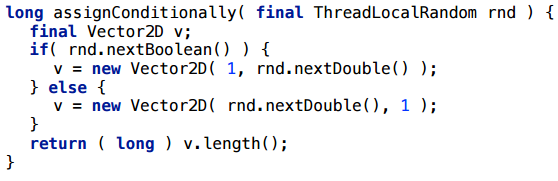
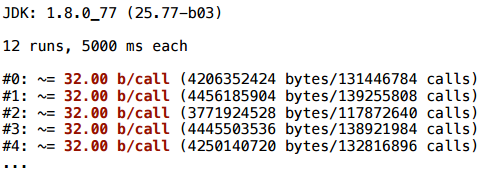
Example 1.4. Control flow
A simpler example: we do not have a cycle, there is a conditional transition. We randomly select a coordinate and create a Vector2D.
And here scalarization does not help: one vector is created all the time - the same 32 bytes.
Example 1.5. Control flow
Let's try to change this example a little. I will simply bring the creation of the vector into both branches:
And here everything is perfectly scalarized.
The picture begins to emerge - what is happening here?
"Merge points"
Imagine that we have a flow of execution in the program. There is one branch in which we created an object v1, and a second branch in which we created an object v2. In the third variable, v3, we write the link either to the first object, or to the second, depending on which route we followed. At the end we return some field via the link v3. Suppose that a scalarization has occurred and the fields v1.x, v1.y, v2.x, v2.y have become local variables, for example, v1 $ x, v1 $ y, v2 $ x, v2 $ y. And what to do with the link v3? Or rather: what should the appeal to the field v3.x turn into?
This is a question. In some simple examples, like here, or in example 1.4, the solution is intuitively clear: if this code is all we have, then you just need to return the return conditions inside, there will be two return ones, one for each branch , and each will return its value. But the cases are more complex, and as a result, the JVM developers decided that they simply would not optimize this scenario, because In the general case, to do this — to figure out which object field should be used — turned out to be too difficult (see, for example, bug JDK-6853701, or the corresponding comments in the source code of the JVM).
Summing up this example, there will be no scalarization if:
- the reference variable can point to more than one object;
- even if this can happen in different execution scenarios.
If you want to increase the chances of scalarization, then one link should point to one object. Even if it always points to the same object, but in different execution scenarios it can be different objects - even this is confusing escape analysis.
Part 2. EqualsBuilder
This is a class from commons.lang, the idea of which is that you can generate equals in this way by adding the fields of your class in Builder. Honestly, I don’t use it myself, I just needed an example of some Builder, and it came to hand. A real example is usually better than a synthetic one.
Of course, it would be nice if this thing would be scalarized, because creating objects for each equals call is not a good idea.
Example 2.1. Equalsbuilder
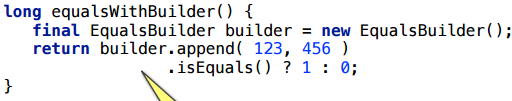
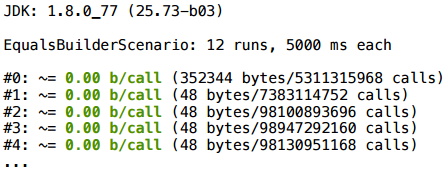
I wrote a simple piece of code - only two ints that were written out explicitly (but even if there were fields there, it wouldn’t change the essence).
Quite expectedly, this situation will be scalar.
Example 2.2. Equalsbuilder
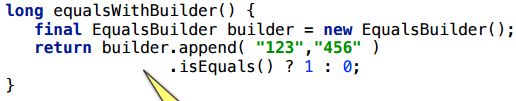
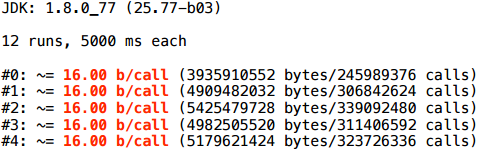
Let's slightly change the example: instead of two ints we put two lines.
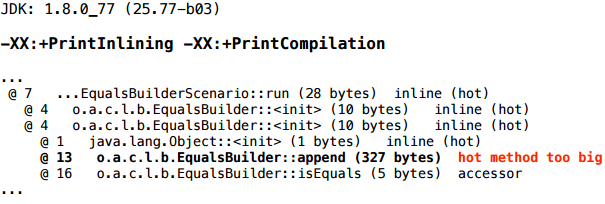
As a result, scalarization does not work.
Let's not climb into the .append (...) method for now. For a start, we have keys that at least briefly tell what happens in the compiler.
It turns out that the append method did not zalinilitsya, respectively, the escape analysis can not understand: here is the link to the builder, which went into the .append () method like this - what happens to it, inside the method? This is unknown (because the compiler does not look inside the .append method - JIT does not do inter-procedural optimization). Maybe it was assigned to a global variable there. And in such situations, escape analysis is dealt.
What does the “hot method too big” diagnosis mean? It means that the method is hot, i.e. it was called quite a few times, and the size of its bytecode is larger than a certain limit, the inlining threshold (the limit is for frequent methods). This limit is set by the key FreqInlineSize, and by default it is 325. And in the diagnostics we see 327 - that is, we missed only 2 bytes.
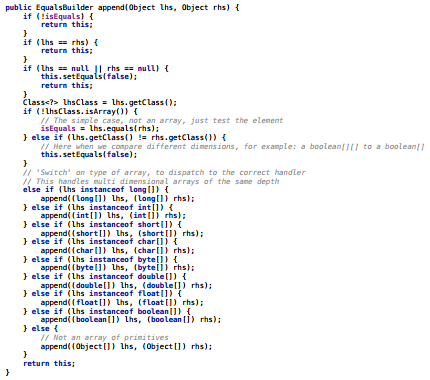
Here is the contents of the method - it is easy to believe that there are 327 bytes:
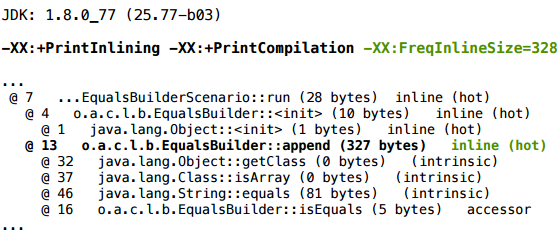
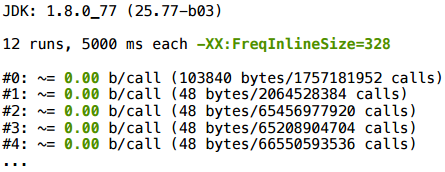
How can we test our hypothesis? We can add the key FreqInlineSize, and increase the inline threshold, say, to 328:
In the compilation profile, we see that .append () is now inline, and everything is well scalarized:
I will clarify: when I change the JVM flags here, and the JIT compilation options, I do this not to correct the situation, but to test the hypothesis. I would not recommend playing with JIT compilation options, since they are selected by specially trained people. Of course, you can try, but the effect is difficult to predict - each such parameter affects not one specific method in which you want to scalar something, but the entire program as a whole.
Conclusion 2.
- Inline is the best friend of adaptive runtimes.
- shortness helps him a lot.
Write short methods. In particular, in the example with .append () there is a large sheet that works with arrays - trying to make a comparison of arrays. If you simply put it into a separate method, then everything is perfectly inline and scalarized (I tried). This is such a black (although it may be white) move for this heuristic of inlining: the method of 328 bytes is not inline, but it’s broken into two methods of 200 bytes — it is perfectly inline because each method separately crawls under the threshold.
Part 3. Multi-values return
Consider returning a tuple from a tuple method — several values at a time.
Take some simple object, such as Pair, and a completely trivial example: we return a couple of rows randomly selected from some pre-filled pool. To prevent the compiler from throwing out this code at all, I will bring in some side effect: I will count something with these type lines, and return the result.
This script is scalarized. And this is quite a working example, you can use it: if the method is hot and inline, such multi-value return will be perfectly scalarized.
Example 3.1. value or null
Let's slightly change the example: under some circumstances, return null.
As you can see, the allocation will remain (the average number of bytes per call is not integer, because sometimes null is returned, which costs nothing).
Example 3.2. Mixed types?
A more complicated example: we have an interface-pair and 2 implementations of this interface. Depending on the artificial condition, we return either that implementation or another.
Here, too, is the allocation:
Honestly, initially I was sure that it was precisely in different types, and I believed in it for a long time, until I made the following example with the same types, which also does not scalar.
What's going on here? Well, if we try using handles to inline all the methods, we will see the same scenario with merge points (= the link can come in two ways) as in our very first experiment:
Conclusion 3:
Keep it simple: fewer branches - less likely to confuse escape analysis
Example 4. Iterators
Another frequent pattern and very often an intermediate object, the creation of which I would like to avoid.
Here is a very simple scenario with iteration through the collection. We create a collection once, we do not re-create it for each iteration, but we re-create an iterator: at each method start we run through the collection as an iterator, we consider some side effect (just so that the compiler does not throw out this piece).
Consider this scenario for different collections. Suppose first for ArrayList
Example 4.1. ArrayList.iterator
For ArrayList, the iterator really scalars (the size of SIZE here is conditional: as a rule, it works stably for a wide range of SIZE). For LinkedList this also works. I will not go through all the options for a long time - here is a summary table of those collections that I tried:
In Java 8, all these iterators (at least in simple scripts) are scalarized.
But in the freshest update Java 7 all smarter. Let's take a closer look at it (everyone knows that 1.7 is already the end of life, 1.7.0_80 is the last update that is).
For LinkedList with size 2, everything is fine:
But for LinkedList with a size of 65 - no.
What's happening?
We take the magic keys, and for size 2 we get such a piece of inline log:
And for size 65:
Closer to the beginning of the same log you can find another such additional fragment of the picture:
The following happens: at the very beginning the method we are profiling went to compile - JIT put it in a queue. JIT works asynchronously, i.e. it has a queue, compilation tasks are dropped there, and it in a separate stream (or even several streams) with some speed scoops them out of the queue, and compiles. That is, between the moment when he was assigned the task, and the moment when the new code will be optimized, some time passes.
And now our
iterate() method went to compile for the first time, during which it was discovered that the LinkedList.listIterator() method inside it was still too little to execute. I didn’t yet work to make it zainlaynit ( MinInliningThreshold = 250 calls). When, some time later, the call to iterate() went to recompilation , it turned out that the compiled (machine) code LinkedList.listIterator() too large.Yes, but what exactly do diagnostics mean:
They mean that, estimating the size of already compiled methods, we look at their machine code, and not byte code (since this is a more adequate metric). And these two heuristics - in terms of bytecode and machine code - are not necessarily consistent. A method of just five bytecodes can invoke several other methods that will be pasted in and increase the size of its machine code above thresholds. With this mismatch, nothing can be done cardinally, just adjusting more or less the thresholds of different heuristics, and hopefully, on average, everything will be more or less good.
Thresholds - in particular, InlineSmallCode - differ in different versions. InlineKmallCode is 8 times larger in an 8-key, so this script works successfully in Java 8: the methods inline and the iterator scalars - and in 7-ke it does not.
In this example, it is important that it is unstable. You must be (un) lucky so that the compilation tasks go in that order. If at the time of the second recompilation, the
LinkedList.listIterator() method would not have been compiled independently, it would have no machine code, and it would pass by the bytecode size criterion and successfully zainlinilitsya. That is why the result depends on the size of the list — how quickly different methods will be sent for compilation depends on the number of iterations inside the loop.We can test this hypothesis of ours: play around with thresholds. Indeed, when fitted, the scalarization starts to work:
Conclusion 4:
- JVM first freshness is better than no first freshness;
- -XX: + PrintInlining - a very good diagnosis, one of the main ones, which allows you to understand what is happening with scalarization;
- Test on real data - I mean, you don’t need to test on size 2 if you expect 150. Test it on 150 and you can see the differences;
- ArrayList again furnished LinkedList!
Dynamic runtime is a roulette. JIT compilation is non-deterministic, inevitable. In the newer versions (8-ke), the parameters of the heuristics are slightly better coordinated with each other, but this does not cancel non-determinism, it is just harder to catch.
Example 4.4. Arrays.asList ()
There is a separate interesting collection option - a wrapper around an array, Arrays.asList (). I would like this wrapper to be worth nothing so that JIT would scalar it.
I will start here with a rather strange scenario - I will make a list from an array, and then go through the list, as if by an array, with an index:
Everything here works, the creation of the wrapper is scalarized.
And now let's go back to the iterator - there is no special sense to wrap an array in a list, then to go through the list, like in an array:
Alas, even in the latest version of java, the location remains.
At the same time, we don’t see anything special in PrintInlining.
But if you look more closely, you will notice that the iterator in Arrays $ ArrayList is not your own - its implementation is inherited entirely from AbstractList:
And AbstractList $ Itr is an inner class, a non-static inner class. And the fact that it is non-static - for some reason, prevents scalarization. If you rewrite the iterator class (i.e., copy the whole Arrays $ ArrayList class to yourself and modify it), make the iterator untied, an array is passed to the iterator, and the iterator no longer contains a reference to the list object — then in this scenario it will successfully scalar as allocate the iterator and the allocation of the Arrays $ ArrayList wrapper itself.
This is a rather mysterious case, and it seems that this is a bug in the JIT , but to this day the moral is this: nested objects confuse scalarization.
Example 4.4. Collections. *
We still have some of these singleton collections, and all of them, and their iterators, are successfully scalarized both in the current and in the previous java versions, except for the above-mentioned Arrays.asList.
Conclusion 4.4.
Nested objects do not scalar very well.
- iteration over wrappers from Collections. * scalars
- ... In addition to Arrays.asList ();
- nested objects are not scalarized (including inner classes);
- -XX: + PrintInlining continues to help in trouble.
Example 5. Constant size arrays
I’ll clarify right away that you don’t even hope for the scalarization of arrays of variable size (that is, a size that JIT cannot predict). We work with arrays of constant length.
Example 5.1. Variable index
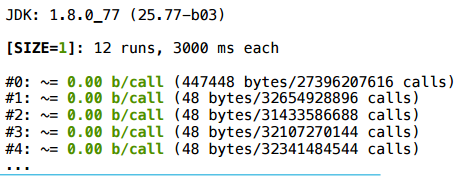
Consider this example: we take an array, write something there in cells, then read something from there.
For size 1, everything is fine.
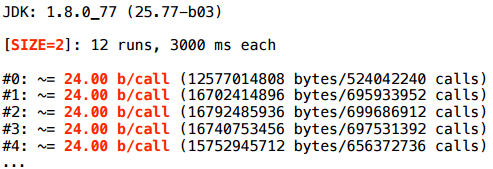
And for size 2 - nothing happens.
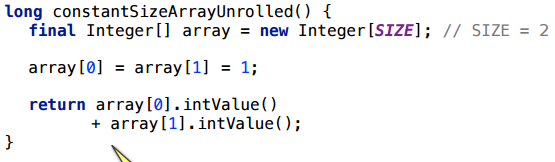
Example 5.2. Constant index
Let's try a slightly different access: take the same size 2 and just simply unroll the loop with the handles - take and turn on the explicit index:
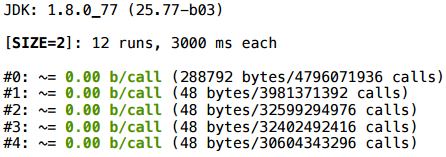
In this case, oddly enough, the scalarization will work.
I will not argue long - below is the summary table. This case with a manually deployed cycle will be scalar up to size 64. If there is any variable index, sizes 1 and 2 will be more scalarized, then no.
As someone wrote to me in a blog, in “JVM for everything there is a key”. This upper threshold (-XX: EliminateAllocationArraySizeLimit = 64) can also be set, although it seems to me that this does not make sense. In the limiting case there will be 64 additional local variables, which is too much.
Example 5.3. Primitive arrays
Exactly the same code, only with an array of primitive types - int-th, short-th ...
Everything works exactly in the same cases as for objects.
Why is it impossible to scalarize an array that we loop through? Because it is not clear which index is hiding behind i. If you have an array [2] type in the code, then JIT can turn this into a local variable of type array $ 2. And what does array [i] turn into? You need to know what exactly i is. In some special cases, in the case of short arrays, JIT can “guess” this, in general - no.
Example 5.4. Preconditions
In the guava library, there is such a wonderful method, like
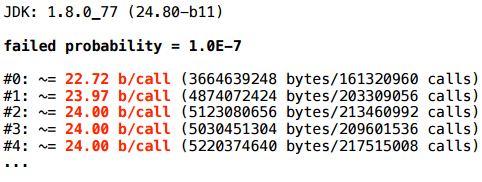
checkArguments(expression, errorMessageTemplate, args...) , which checks expression, and throws an exception with a formatted message if expression == false. — vararg, , . , checkArguments expressions == false, ., expression . : vararg , expression false?
— 10 -7 :
.
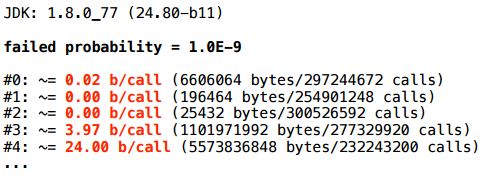
10 -9 , , , , - .
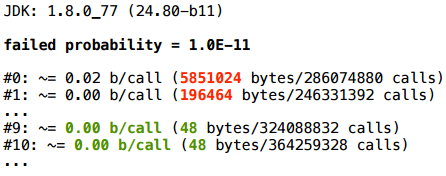
, - :
… .
, — checkArguments, vararg — , , , expression false. checkArguments, expression false, - , - . , , , false , vararg , .
Total
- , ( );
- , (.. , , : - , );
- JVM .
: ( JVM). , , . . - , .
— :
- JVM;
- ( );
- ( , 1; 2-3 — , , , );
- ;
- null — ;
- — , , , ;
- .
– JPoint 2017 (7-8 ) JBreak 2017 (4 ) . , – , .
Source: https://habr.com/ru/post/322348/
All Articles