Aytreking in UX research

Dali by kristina323
Hi, Habr! My name is Natalia Sprogis, I lead the direction of UX-research in Mail.Ru Group and continue the cycle of educational articles on UX-research. Today I want to tell about aytreking.
Aytreking, or oculography, is a technology that allows you to capture the movements of a person’s gaze. When I first started using it in UX research, I was very excited and expected incredible results and revelations about user behavior. And after several months of work, she was slightly disappointed. That did not work out to build beautiful heat maps, it did not work out to find new problems. With experience, I understood for what tasks aytreking is good, where are the pitfalls, what is its value, even if it does not add beautiful pictures to the report. This is what I want to tell in this article.
About the method
How our vision works
We are able to see up to 180 ° horizontally and 130 ° vertically, but the main part of this picture falls on peripheral vision. And only in a small area around the point at which we are looking (central vision), we see clearly and contrastly. Outside of central vision, clarity is gradually lost, and the picture becomes blurred. In the peripheral zone, sharp contrasts and movement are best perceived.

We do not control and do not realize how our eyes move. In a reading person, he does not move evenly across the page from one word to another. The movement of the eye occurs in jumps and consists of stops (fixations) and fast movements (saccades). Within a second, the eyes can make three or four fixations, their average duration is 0.1-0.6 seconds. Most often, fixations show the focus of attention of a person, since it is easier for the brain to process what we are looking at (according to the strong eye-mind hypothesis, a hypothesis put forward by Just and Carpenter). There is also the phenomenon of hidden attention, allowing to perceive objects outside the directional view, but in most cases attention corresponds to the area of fixation of the view.
From a practical point of view, it is important to understand that the fixation shows us the object of attention, but says nothing about how the brain processed the object. That is why we can look, but not see. For example, even if during the search task the respondent’s gaze stopped at the desired object, the person could not perceive it as being sought.
How does the tracker
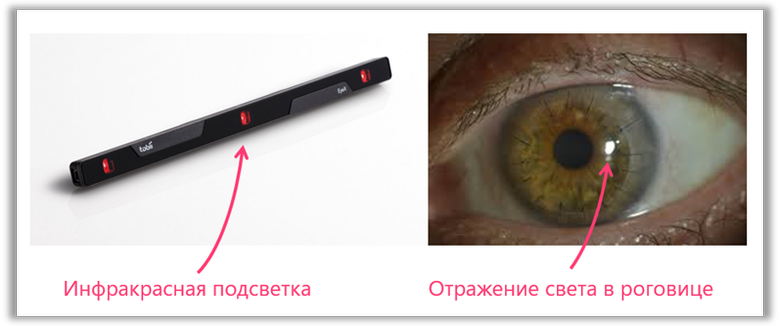
Unlike the first IT tracker, which was a special lens with a hole for the pupil, testing with modern IT trackers is comfortable for the respondent. The direction of view is determined non-contact by the ratio of the center of the pupil and the reflection in the cornea of the infrared illumination built into the eytreker. This ratio changes when you change the direction of your gaze, but remains stable when you move your head. To adjust to each respondent, a simple calibration is carried out before the test. The respondent is asked to look at several points one by one. This allows the eytreker to correlate the direction of gaze with a specific point on the object under study during the study.
What are ytrekery
There are many aytrekerov on the market. They are used not only in marketing and UX research, but also to control gaze in games, to communicate people with disabilities, and even to train athletes. From the point of view of the form factor there are wearable aytrekery (most often it is points) or remote. Wearables are used for environmental studies, terminals, merchandising, and sometimes for testing mobile devices. Remote aytrekery used to test a variety of digital products. They can be attached to the monitor or embedded in it, and also used as part of stands for testing on smartphones or tablets.
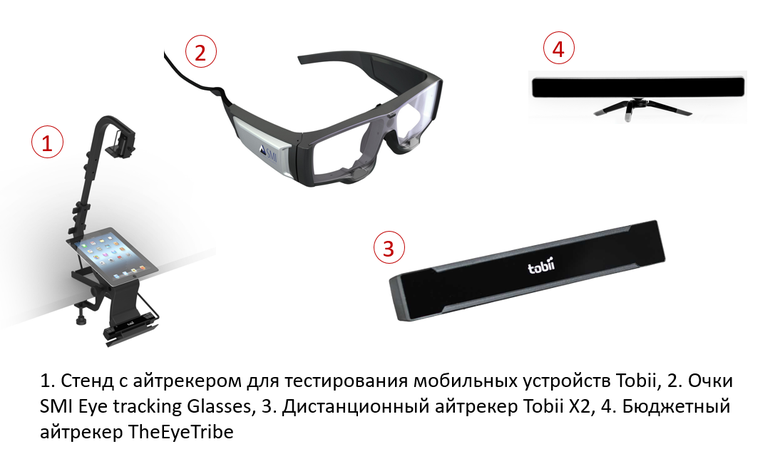
Tobii and SMI are the most popular eytreker companies in large Russian companies. These firms provide accurate hardware and powerful software for processing results, but their products cost tens of thousands of dollars. There are budget models. Earlier, EyeTribe was very popular, which was originally sold for only $ 100. But in December 2016, the project bought Facebook for implementation in Oculus, and the model stopped selling. Of the budget models, there is another GP3 from GazePoint for $ 595 and EyeX from Tobii. Naturally, low-cost models have much more restrictions and are not suitable for every project. A detailed overview of the models presented on the market with comparative tables can be seen in the article by Anatoly Kostin and Maxim Korolev.
What do you get at the exit
The main materials for work on leaving the study with the eytreker are video recording, visualization and statistics. The video shows what happened on the study, and a special marker indicates the movement of a person’s gaze across the object or environment under investigation (mobile phone screen, website, shelf in a store). Video recording allows you to analyze in detail the behavior of the respondent.
Visualizations are used mainly to illustrate the problems found and behavior patterns. The most popular visualizations are heat maps (heatmaps) and gazeplots. On the map, warm colors correspond to places that were looked at frequently (or rarely, but for a long time). Maps are constructed most often by a group of respondents and reflect the overall results. The gaze chart shows the order in which the person studied the page. Graphs are usually used to reflect the behavior of one respondent, since the union of several people on one geyzplot makes the picture difficult to read.

The statistical package allows you to analyze multiple metrics: the time before the first fixation on the target object, the fixation duration, the number of fixations, the number of fixations before the first target fixation or the first click, etc.
Number of respondents
It is a widely held opinion that in order to use eytreking in a study, huge samples of respondents are needed, which increases the time and budgets. This is confirmed by renowned experts. For example, Jacob Nielsen advises to take at least 39 people for stable heat maps.
In practice, the number of respondents depends on many factors. If you use an Aytreker in high-quality usability testing, the purpose of which is to find the problem areas of a product, then you will hardly need much more users than for classical testing (6-12 people). Here, the eytreker simply helps you to better understand the causes of the problems encountered by each respondent.
Large samples are needed in two cases: if you are comparing something or want to build statistical conclusions about patterns of human behavior. That is, if you are going to conduct a quantitative analysis of the results of the eytracking research. An example of such a task is one of the most famous research with 2005 eytracking, which showed that the attention zone of people on the search results page resembles a triangle or the letter F. Although, according to a 2014 Mediative study , the behavior model has changed a lot over the years: “the golden triangle No longer exists.
To determine the number of respondents, you can use a calculator from Blink. It shows very well what parameters the sample size depends on (although I sometimes would take a little less people than the calculator recommends).
For which tasks in UX can I use tracker
In UX research, eytreking is most often used for three types of tasks. To, firstly, find the causes of UX-problems, adding to the classic usability testing. Secondly, to identify features and patterns of user behavior. And thirdly, compare different designs or products in terms of efficiency and attractiveness. Let's take a closer look at how in each of these cases, eytracking can be applied.
1. Causes of UX Problems
Aytreking rarely allows you to find the problems that can not be found by classical methods. But he very well helps with the causes of the difficulties found. For example, seeing which respondent left out any areas of the interface, you understand why he didn’t understand the concept of the product poorly. Or, having discovered the respondent’s confusion at a certain step of filling out a form, you understand the reason: a person rereads the text many times. Best of all, eytreking helps with problems related to the visibility of the elements, focus points, mental stress and distractions.
1.1. Visibility of elements
This task for using the ytreker comes to mind first, because the device makes it easy to identify areas in which the respondent did not look. Take, for example, our experience in testing the account replenishment form in Odnoklassniki. In the old payment, users did not notice that there are different payment methods, and they chose the most disadvantageous option offered by default - payment via telephone. The heat map shows that the link at the top of the screen did not attract the attention of respondents. In the new interface, payments have been resolved. Users saw payment options in the left panel and chose the most convenient for themselves.
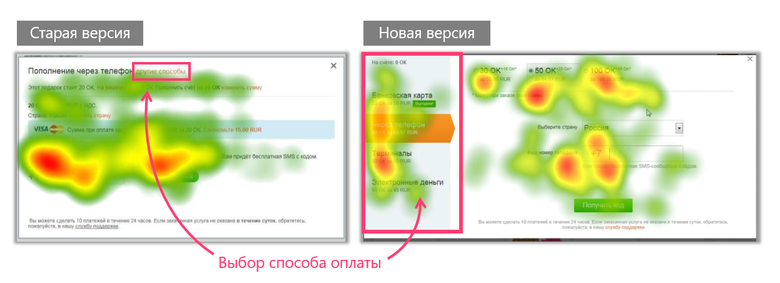
Figure 1. Heat maps of work with two versions of payment in Odnoklassniki
Most often, if the invisibility of an element leads to a usability problem, then the problem can be detected in normal testing. In this study, we saw that users did not change the payment method and could not even answer the question of what other options there are. Aitracking only helped us illustrate this problem.
But there are cases when it is not so easy to understand the visibility of an element. For example, somehow in the same Odnoklassniki, we were faced with the task of testing a prototype of the new notification interface. One of the test questions was this: do users see alerts while doing some kind of activity on the page? We understood: a person may notice that something has appeared in a corner of the screen, but not respond immediately, continuing to perform the current task. And if we (moderators) start discussing alerts, then the respondent will be more attentive to monitor the screen and notice a new window on our tip. So in this situation, eytreking helped us to unambiguously determine whether the respondents noticed alerts without a hint from a moderator.

Figure 2. The schedule of movement of the gaze of the respondent who noticed the alert
The study also showed that the visibility of alerts is a matter of awareness and habit. Seeing once that something was happening on the right side of the screen, users got used to it and did not miss the news in the future.
1.2. Focus of attention of the respondent
Sometimes it is important to understand not only whether the user notices an element, but also how much he focuses on it: reads, skims or almost completely ignores. A good example of this task is hints and tutorials. People usually notice them, but often do not pay them enough attention. Aytreker allows you to understand what exactly gets into the zone of attention, and what is completely ignored. So, we are faced with the fact that in the browser game "Keepers of the Forest", some tips worked worse than others. For example, respondents skipped prompts that suggested performing a game action. They immediately switched to the game, but the hint remained unread. One participant of the test did not understand at all that different texts were written in a series of similar prompts. And I wondered why she was told for the third time how to put three in a row. Tutorials from two steps also worked poorly. If some of the first part is still read, then the second one was missed almost by everyone. In addition, Aytreker helped find tips that did not work, even if they were read. Users simply did not understand which element was being discussed in the tooltip. As a result, many respondents after only a few losses noticed that levels have goals, and the number of moves is limited.
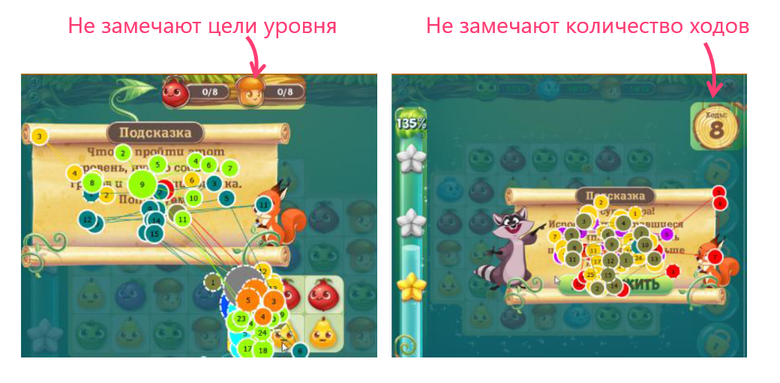
Without an Aytreker, we could find out which clues were poorly learned (users did not understand where to look for the number of moves or the goals of the game). But it would be much more difficult to see the reasons for the poor performance of one or another training window.
1.3. Mental load
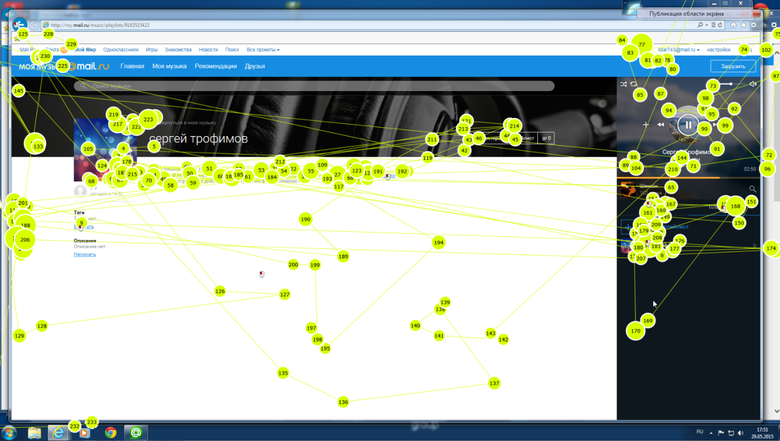
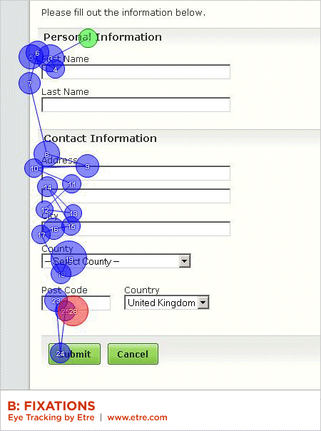
With the help of light tracking, it is easier to detect difficult moments for the user. When the look repeatedly runs across the screen in search or the text is re-read again and again, this most often indicates a problem. Below is an example of the movement of the gaze of a respondent who was looking for an opportunity to create a new playlist. From the picture you can see that the user has viewed the entire screen before he noticed the desired button. You would have found the problem of the non-obvious location of the element even without the eytreker and realized that the person was confused when searching. But the Aytreker makes it clear where exactly the respondent searched for the element in the first place.
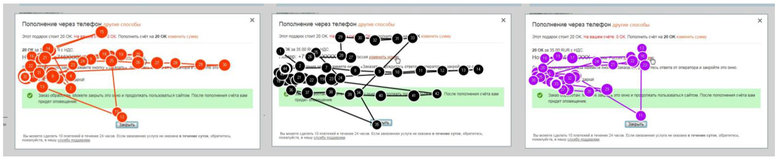
Here is another example, when the Aytreker shows the complexity of the interaction well. The picture below shows the motion graphics of several respondents on the payment confirmation form. An important step: you need to make it clear that everything is fine and the payment was successful. But for this one phrase is enough. The form also contains a lot of irrelevant text that users read, and sometimes several times, looking for confirmation that everything is fine. It is also an example of a problem that, without aytreking, might not have paid attention. After all, none of the respondents complained about this step. They just spent a little more time on the page than they should. That, perhaps, with classical usability testing would be imperceptible.
Another opportunity to study the mental load that lighttracking provides is to analyze the increase / decrease in the diameter of the pupil. This indicator really changes when we are faced with a difficult task. But, unfortunately, other factors, primarily the brightness of the image, affect the diameter of the pupil. Because of this, in practice, obtaining meaningful results when assessing the diameter of the pupil is rather difficult.
1.4. Distractions
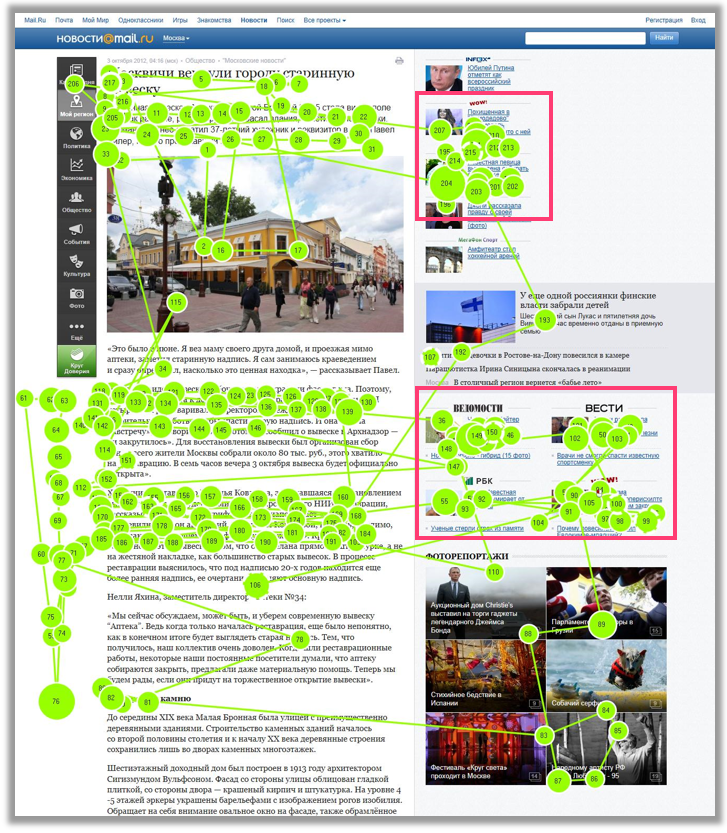
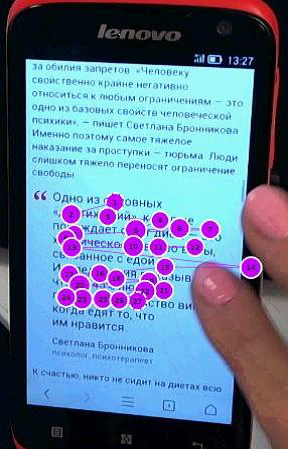
Aytreker allows you to understand whether users react to distractions: notifications or alerts interrupting the current task, banners, body kits, promotional offers. Depending on the context and the task, these distractions may or may not lead to problems. The picture below shows how the respondent paid attention to external links while reading the article of the project News Mail.Ru.
2. Features of user behavior
UX studies are conducted not only to understand what is wrong with the product. An equally important task is to identify the peculiarities of user behavior in order to get ideas for improving the product. I will give two examples in which aytreking helps for such tasks, although in fact there may be many more.
2.1. Visual Search Strategies
Aytreker is indispensable if you need to figure out how users are browsing the search results, how they analyze and search for what they need. Especially when it comes to working with media materials, such as searching for pictures. Respondents cannot carry out self-analysis and explain exactly how they chose the right picture, which images they noticed, and which ones didn’t. For example, when testing the gift catalog (pictures that can be hung on the avatar) in Odnoklassniki, we saw that the respondents viewed the first rows of pictures almost completely, and then they began to scan them and record on one or two pictures in a row.
And when testing different search results for Mail.Ru using pictures, it was Aytreker who helped to understand that a design with a fixed current picture is more efficient. In 97.9% of the cases studied (233 of 238), regardless of the design, the respondents repeatedly looked from the open picture to the other results and back: they compared the selected picture with the rest. Read more in the report of Ksenia Sternina on UX Russia 2014.
2.2. Reading patterns
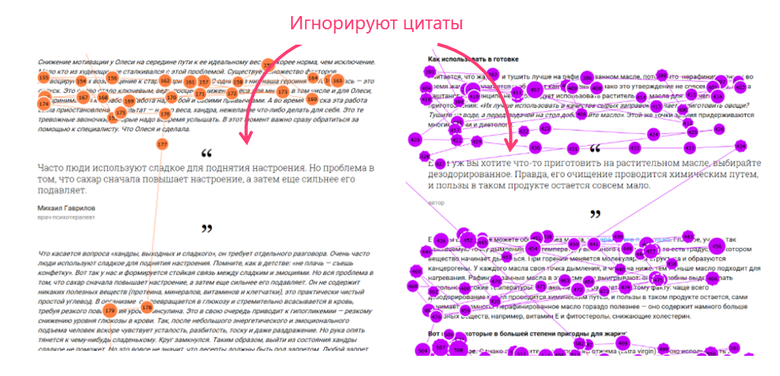
Another area of application of eytreking is to identify patterns of reading (learning) of site content, which is useful for media projects. Here, eytreking allows you to understand how users read materials, which formats work best, and which content attracts attention. For example, when testing the Lady Mail.Ru project, we saw that respondents had different reading patterns depending on the topic of the article. In articles on cosmetics, readers paid more attention to the text, about fashion - they mostly watched pictures, and in articles about stars they were attracted by both. We were also interested in the topic of visual anchors on the page for respondents who do not read, but scan the article. After all, this is a very frequent scenario. Expectedly good as anchors worked section headers. We also saw that the most interesting photograph in an article on any topic usually attracts attention to the text above and below it. But the selection of quotes from the text worked poorly. Apparently, the visual emphasis was not clear enough. Many users while scanning or reading completely ignored such quotes, despite their separation from the main text.
3. Comparison of solutions
The third field of application of eytreking in UX research is the comparison of various solutions. Comparison is possible due to the module of work with statistics of the eytreker. And this is the most time consuming analysis.
Aytreker allows you to compare designs in terms of attractiveness or efficiency. Issues of attractiveness are most often associated with marketing. So, you can check what type of materials longer delays the attention of users, in which place the ad unit is noticed faster. For example, we had the experience of a comparative analysis of the different arrangement of media banners on the page. Most often, to determine the attractiveness, we have to work with the following metrics: measures of visibility (proportion of respondents who noticed an element, time before the first fixation), measures of interest (number of fixations, total duration of fixations).
Performance metrics are selected depending on the tasks of the interface. For example, in which design the required element is found more quickly, where the respondent’s task has less “garbage” fixations. The overall complexity of the form or design can be compared by the average duration of fixations. There are studies that the time of fixation is related to the speed of information processing by the brain. For example, compound words in a text cause longer delays. If you are faced with the task of evaluating the effectiveness of searching for a specific element, then you need to remember: a person can see it, but not understand that this is the right element. Therefore, it is worthwhile to compare both the visibility of the block itself (the time before the first fixation, the number of fixations before the first fixation) and its “recognition” (the time until the first click, the number of fixations before the first click, the time from the first fix to the first click).
A good example of using an ytreker to compare design effectiveness is described in the article by Luke Wroblewski. The author compares the different arrangement of the “Submit” and “Cancel” buttons on the form.
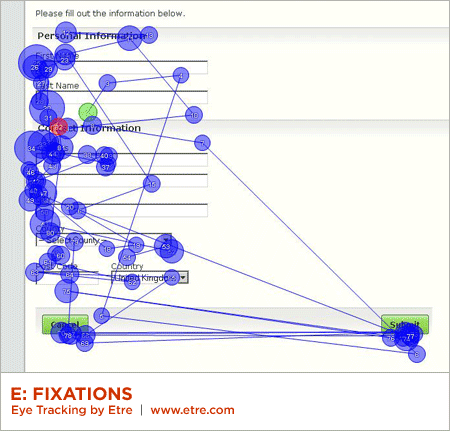
(pictures from Luke Wroblewski’s article)
Useful properties of light tracking
So, eytraking allows you to solve specific tasks related to finding problems, identifying features of the audience and comparing solutions. In addition, he has a number of useful qualities. Even if the method does not help to find new problems and insights, its application can improve the quality of the entire study.
Visibility. Statistics and visualization allow you to very clearly show the problems found. Figures and pictures are perceived more easily than text, and the impassive technology behind them often causes more confidence than just the words of the researcher.
Quality moderation. A significant improvement in the quality of moderation and the quality of testing in general is often underestimated, but a very important reason why light tracking can be useful even if you do not expect any new knowledge from it. The role of a moderator is great, as he is able to influence, directly or indirectly, the respondent and his behavior (for more details, see my article ). The better the moderator understands what is happening with the respondent, the easier it is for him to behave properly. Aitrecking allows the respondent to get into the head. Seeing where he is looking, the moderator does not ask unnecessary questions, does not distract him from the task once more and better understands the reasons for the respondent’s confusion. In addition, you can at least partially abandon the not very natural method of "thinking out loud." Nevertheless, an experienced moderator can conduct a quality test without a light tracking, without spoiling the results.
Easier for observers. Observing the project team for testing is almost more valuable than the final report. After all, the main task of any researcher is not to draw beautiful graphics and pictures, but to bring knowledge about problems and needs to the people concerned. It is in the observation room that managers and developers are more likely to show empathy towards users and begin to trust the research results more. Aitracking allows observers who are most often new to research, it is easier to understand what is happening now, not to lose the thread when the respondent seems to be “just dumb”. In addition, eytreking just causes interest and increases the likelihood of involving more people in monitoring the project.
Access to the unconscious. Aitracking allows us to work with an unconscious layer of behavior. A person does not control exactly how his eyes move, and is unable to tell you honestly where and how he looked. Just because sometimes it does not remember, and sometimes it does not realize it at all. Therefore, for example, if you are faced with the fact that respondents do not find the target element, without light tracking you cannot clearly answer the question - why? Did not notice the item or did not understand what it is? In addition, do not forget about socially desirable behavior. It is unlikely that all respondents will tell you how they looked at the banners with half-naked girls.
Wow-effect and marketing research. Despite the ever-increasing popularity and availability of light tracking, the technology still generates a wow effect. It is easier for research agencies to sell projects by offering lighttracking. The point is not that IT tracking allows agencies to attract more customers. The results of research, in which aytreking is applied, are often more likely to be trusted because of the aura of scientific and magic enveloping the method. As a result, Aytracking improves not only external, but also internal marketing research, making it easier to report the results to management and colleagues. However, the wow-effect has a downside, about which we will talk further.
Limitations and difficulties
If I stopped at what I wrote above, everything would be too beautiful. In fact, there are many limitations that, in each case, call into question the need to use eytracking.
Cost A good eytreker with software (and without it there is no analysis of statistics and visualizations) costs tens of thousands of dollars. And only laboratories of large companies or successful agencies can afford it. The emergence in recent years of cheap eytreker (EyeTribe) and relatively low-end models in the lines of major manufacturers (Tobii EyeX) gives hope that soon the technology will become more accessible. But now low-end models do not reach the expensive in terms of capabilities and software power.
The complexity of the analysis. The analysis of eye movements is a rather long and complicated process. Therefore, the use of eytreking significantly increases the processing time of the research results, even if there were no special insights.
Calibration problems. They occur in 10-20% of respondents. Sometimes they are expressed in inaccuracies of fixations, and it happens that a person basically cannot calibrate and record. It may, for example, interfere with abundant makeup or hairstyle. But sometimes the reasons remain a mystery. Often problems arise with people with poor eyesight. Although this does not mean that people with glasses can not be respondents. For example, our Aytreker also perfectly calibrates me with glasses. But the typical situation is when everything is fine when calibrating, and the respondent does not take glasses (or takes but not suitable) for the test, opens the project and sticks his nose to the monitor, because otherwise he cannot read anything. Naturally, the entire calibration gets off.
Technical limitations and difficulties. If five years ago, we periodically lost recordings of tests due to the relegation of software when processing the results, now this almost does not happen. But still there are problems. For example, visualization is often simply impossible to create. There are no difficulties with pictures and simple desktop sites. But when testing applications, especially mobile, and complex web, it is not always possible to obtain heat maps or glance graphics. For example, the visualization below was done, because the user did not scroll the article for a few seconds. If he had been flipping through it all the time, nothing would have happened. And to make visualization of reading the full article on the mobile is simply impossible.
Methodological limitations. You need to adjust the testing script for the use of eytreking. If, within the framework of the test, the respondent communicates with the moderator, all the time the communication must be discarded from the analysis of the tracking, since “garbage” fixations appear on the screen. In fact, cleaning too much is not such an easy task, especially if you have many respondents. Also doubtful is the use of the method “Thoughts aloud”.
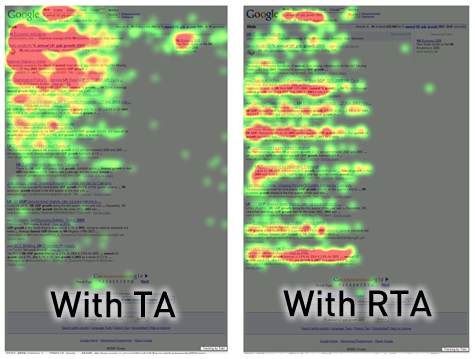
The article by James Breeze provides an excellent example of how different the respondents look at the screen when they comment on their actions and when they are silent. Instead of “Thinking out loud”, it is proposed to use the Retrospective Think Aloud method, when the respondent first performs the tasks silently and then revises the video recording and comments on it. Everything is good, only a retrospective almost doubles the time of the testing itself.
Researcher qualifications. In order to choose the right method that does not introduce bias, process the necessary statistics, back them up with illustrative visualizations and, most importantly, not mislead the customer, the researcher should be well immersed in the subject of eytracking. If you are planning to purchase IT tracking equipment for the laboratory, then you need to either spend energy on training employees, or hire already qualified specialists.
Interpretation problems
Aitracking can play a cruel joke with you if you approach its analysis without appropriate knowledge and experience. Breaking firewood is very easy, especially with excessive love of visualizations.
What do fixations say? Respondents looked into some area a lot / long / often - what does it mean? The abundance of fixations can speak both about interest and about complexity (for example, they tried to understand the incomprehensible). - , , . — . , , , . . -.
. . , « », « ». . , Tobii Studio, , : , . . «» , , , . - . 10 2 , 100 20 , . , - , .
( )
: , . , 10 , , 10 , «». , . - , , . , , , , .
. wow . , . , , - . , . , , . , : , . . .
Do you need it?
, UX- , . ( ) UX-, . , , , — . — UX-. , ( ). , , , .
. . UX . , ? , ? , «» — . .
. , , « , ». - . . , « ?» , : - , - , - . . , . ? . , . , « , ». , .
Conclusion
, . , . — . , , - . , . : .
')
Source: https://habr.com/ru/post/322324/
All Articles