Free QGIS and NextGIS geographic information solutions
One has only to start working with geographic information systems (GIS), as comes the understanding of their indispensability in the work of any manager or employee of the organization dealing with geographically distributed data.
A year ago, I faced the task of mapping several hundred objects scattered around a municipal district onto a map for collaboration. Therefore, initially looking for a web service that allows you to display my data on a map on the Internet, but later changed the approach - it turned out that the useful features of data visualization on a map increase by an order of magnitude if you use web services together with desktop solutions.
')
Then I’ve given our time for some deepening into the subject and studying the market, analyzed various paid and free GIS, and found out that familiar surveyors and specialists working in the field of urban planning activities prefer the GIS “InGEO” (the same AutoCAD, just honed by creating an information urban planning support systems). Another part of GIS users installs MapInfo on their computers.
But it turned out that less sophisticated comrades rejoice in the free (Open Source) solution of QGIS, which, according to their words, covers the needs of a wide range of specialists, from managers of economic security and directors of construction companies to surveyors. Moreover, it closes no less in relation to the above-mentioned commercial GIS than the needs of Microsoft Word users than LibreOffice - the question is entirely in the habit.
So QGIS was my personal discovery of the year. And if at first, with disbelief, I reacted to the statement of my acquaintance that QGIS was quickly crowding out expensive professional GIS, now I believe that such an assertion has the right to life.
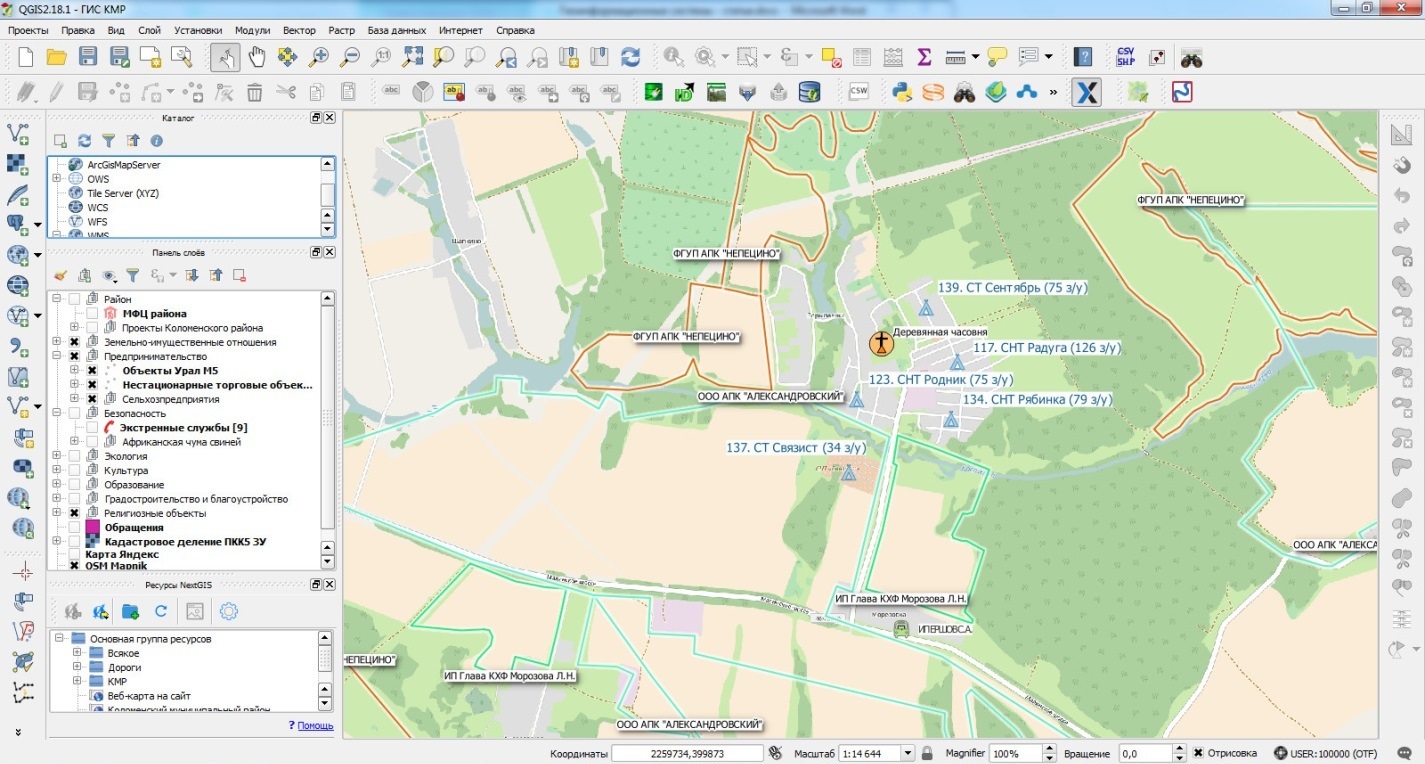
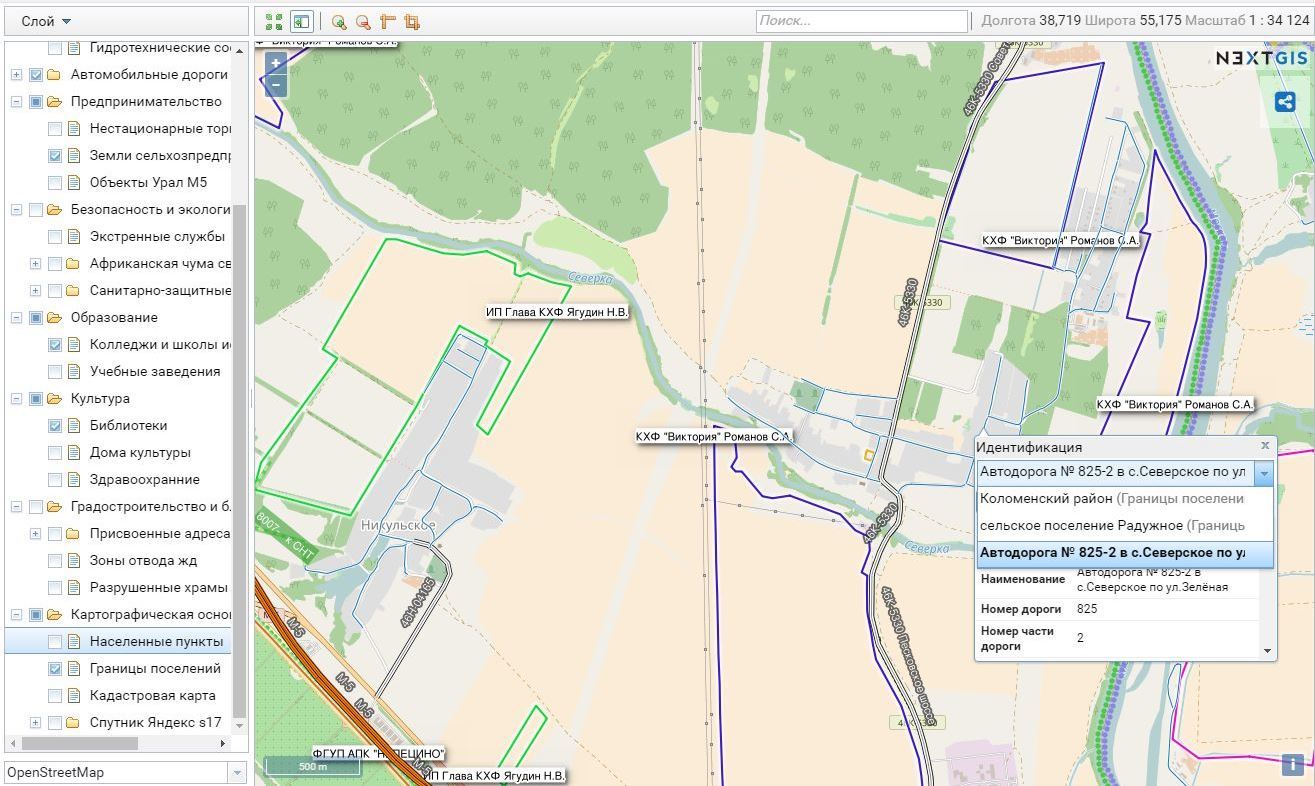
The screenshot below shows an example of data processed by us in QGIS and uploaded to the free cloud web service NextGIS.com for collaboration. NextGIS.com will be introduced below.

Over time, information in the GIS is accumulated, it becomes possible to display combinations of map layers with a seemingly unrelated theme at the touch of a button and make discoveries that were not previously obvious.
Pleasant surprises from learning QGIS and NextGIS continue to this day. It's time to share the experience.
Geographic Information System QGIS
→ Link to project
QGIS is an open source free, free desktop geographic information system. With its help, you can create, edit, visualize, analyze and publish geospatial information in Windows, Mac, Linux, BSD (and soon on Android). The system is well documented in Russian, plus it has an extensive Russian-speaking community of users and developers.
The functionality of QGIS is determined by the large number of installable extensions that are loaded through the "Manage Modules" menu. You can find modules for a variety of tasks, from geocoding, to simplifying geometry, integration with web-mapping services and 3D-modeling of the landscape.
The objective of this article is to give a general idea of the capabilities of QGIS. How to execute this or that in practice - I suggest to google and immediately try during the article. The interface of the application is friendly and understandable to a beginner, especially if you have an idea of the general principles of the work of GIS which this article is largely devoted to.
Project file and QGIS layer files
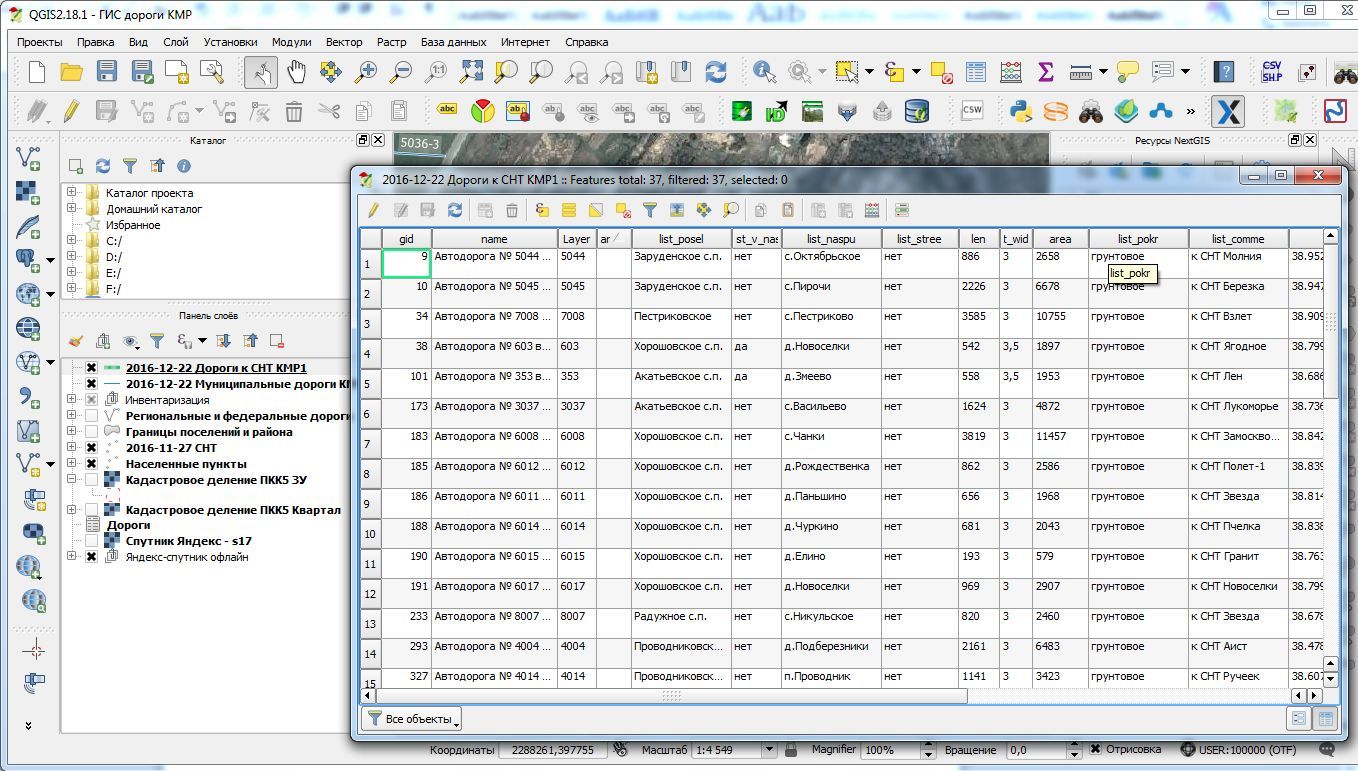
The main objects with which the user works in GIS are layers. A regular layer is a table, each line of which corresponds to one object on the map. In contrast to the usual Microsoft Excel-style tables, except for attribute data, such as, for example, the name of the property, tenant, address, area, etc., there is a column in the QGIS table, hidden by default, with the so-called “geometry” object - spatial data that allows to display on the map the object described in the corresponding row of this table.
Depending on the type of layer, objects that can be spaced apart on the map are raster objects (images, for example, pieces of satellite images) or vector data, which are described by the coordinates of the vertices. There are three main types of vector objects:
- points;
- lines, including broken lines;
- polygons (closed lines of polygon objects).
It is important for the QGIS user to understand exactly where the tables are stored, the rows of which contain spatial data. In the application, we form a project in which we create new, or in which we drag in previously created or publicly available tables. These can be tabular files in various formats, tables of databases created by QGIS or other applications, public and private web services.
In the simplest version, the user creates his layers in tabular files with the extension “.shp” (from the English. Shape - shape, appearance) - the native QGIS format. One layer (table) is contained in a single .shp file. If you need to transfer cartographic information to someone for further work, you can send a single “.shp” file, although in many cases it is better to pack it in the archive and transfer the entire project folder.
As already mentioned, a separate field is allocated for storing geometry in the layer table. If it is not in the source (file, database, external application), then QGIS will help to create it. This means that you can, for example, attach a CSV format file downloaded from Microsoft Excel to a project, create geometry fields in it or convert it into a full layer “.shp” to display these addresses on a map.

QGIS allows you to attach layer table files in a variety of formats to a project, such as MapInfo, ArcGIS, or even CSV, but as a rule, after attaching, I immediately convert them to QGIS format (.shp), since this creates additional features, especially in terms of styling . Sometimes attached layer files have incorrect text encoding. In this case, the correct one can be selected in the properties of the layer.
Since the files are not imported, but are added to the project, the changes that are made to the rows of the table will be saved to the same files. That is, they will become visible in all applications using this table, and vice versa.
What confuses the novice a little? Layers loaded into the project are defaulted to write and are not edited; you cannot put new objects on them, move them, change attributes, and add fields in the table. For all this you need to select the desired layer and click the edit button. After that, the corresponding other buttons and options will become available.
Do not forget that your edits apply to the selected layer and if you switch to another, the old one will remain in edit mode, but you will not be able to map the new object until you select the edited layer again. Needless to say, you need to periodically save changes to the layer being edited (or the entire project) in order not to lose them.

Styles
Data tables and rules for their display on the map (styles) are stored and processed by QGIS separately. We understand what tables are, now it is necessary to understand what styles are.
The style is set for each table. The simplest thing that describes the style is the colors, markers and images used to display table objects on the map, formatting and arrangement of captions and table fields from which these captions are formed, the scale at which the layer or captions are displayed. Including, with the help of style, you can easily make the design of a layer on a map dependent on any of the fields or related tables. For example, display debtors and creditors on a map with different symbols.
In addition, you can customize actions that are performed, for example, when you click on an object marker on the map. If you want to click on the map to go to the object page in a closed corporate network or launch an application to process the object, there are no problems.
Using layers from public sources
There are special web services WMS and WFS which are designed to transfer cartographic information. The user uses a special HTTP link by which the user's client (QGIS) requests data. The server sends the data and they are displayed on the user's monitor. In some cases, this data can be edited and returned to the server.
The fundamental difference between the WMS and WFS protocols is as follows:
- WMS - transmits map information in the form of ready-made images (rasters) attached to coordinates.
- WFS - allows you to query and, if you have permission to edit vector spatial data on the map, such as roads, coastlines, land, etc.
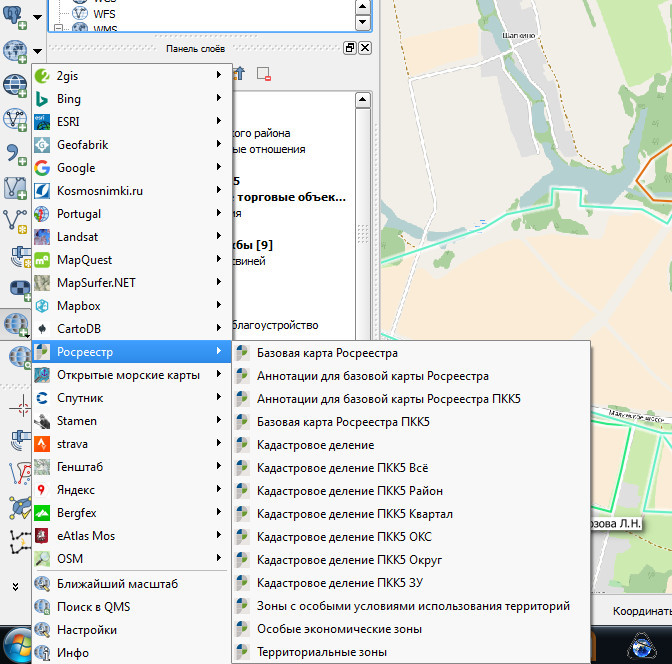
There are many useful public services for providing map information in the form of layers (usually WMS), accessible via a web link and asking for our QGIS projects. Many of these services are available from the QGIS Quick Map Services module.
After the module is installed, open the tab “Load services” in its settings and click the button “Get data sources”. You will have access to a public cadastral map, photoplans from Google and Yandex, license-free and, in my opinion, the most detailed available map of OpenStreetMap (also known as OSM), as well as dozens of useful layers that can be placed in your project.
In addition, some services provide useful information for automatic analysis. For example, from the OSM you can get all regional and federal roads on a map with numbers, types of roads, surfaces, etc.
Geocoding
Geocoding is a great invention. If there is a spreadsheet in Excel with addresses of 10,000 objects (for example, a list of contractors), why not also analyze them on the map.
To do this, in QGIS we convert a table from a CSV file into an .shp layer (“RuGeocoder” module). In this case, the layer table will receive a hidden column with geometry (coordinates of points), but it will be empty for now.
Now, using the same module, we use the geocoding procedure, specify the layer table and its address field, select the service provider. My choice is Yandex, because it copes with addresses in Russian better than anyone.
So, we start the geocoding procedure, wait an average of a second for each of the objects being processed and get all of them scattered around the map.

Coordinate systems
It is useful to understand that there are different coordinate systems. There are hundreds of them.
At school, we studied only geographical (WGS-84), representing a point on the map as degrees, minutes, seconds of latitude and longitude. However, in geographic information systems geographic coordinates are stored in degrees and their decimal fractions, and minutes and seconds are not used (for example, the description of a point with coordinates of 45 ° 34′55 ″ north latitude and 15 ° 30′0 ″ west longitude will look like this: 45.581944 ° -15.5 °).
There are often cases when you get layers from third-party sources whose geometry fields use one of the rectangular coordinate systems. Rectangular systems are actively used by land surveyors and designers - the so-called local coordinate systems (MSC). Rectangular coordinate systems assume that the earth is flat and all measurements along the abscissa and ordinate axes are from a specific zero point in kilometers.
Why are there so many of them? The fact is that the assumption of a flat planet does not allow the use of one local coordinate system over the entire Earth, since within a few hundred kilometers the error becomes palpable. But they are indispensable in the case when high accuracy is required on the territory bounded by several degrees of latitude and longitude. So in the Moscow region, surveyors use MSK-50 systems of zone 1 or 2.
QGIS allows you to select a coordinate system for each layer. That is, in one project there can be layers with different coordinate systems, and they are easily converted from one system to another - it is enough to save the layer in a shp-file or database, choosing a new system as a parameter. In addition, in QGIS, you can set the coordinate system to which all layers of the project will be translated when they are displayed on the screen, as well as the systems that will be set as default for new projects and layers in the current project.
The coordinate system information is stored together with the table in the QGIS shp-file, and transferring the layer file with someone to it gives you the appropriate settings. In other sources of layers included in the project, information about the coordinate system may be missing. Therefore, if you received from someone a layer of information that for some reason is not displayed on the map, do the following: open the object table of this layer, select any row and press the button to go to the object. If Africa or the world ocean is displayed on the screen, it means that the QGIS coordinate system did not recognize correctly. Check with those from whom the source (file) was received, in which coordinate system the data is stored, and set it for the layer in QGIS.

If the desired coordinate system is not in QGIS, then you can enter it yourself (User Coordinate System). To do this, you need to know the settings bar. Google to help you - try to use the query with the name of the desired system plus, for example, “QGIS user coordinate system”.
What else can it be necessary for? Users of the public cadastral map are well aware of the problem of shifting the layers of the inventory relative to the satellite substrate. It confuses, interferes with the visual assessment of the boundaries of land. We see a similar picture when adding a layer of a public cadastral map in QGIS along with Yandex or Google images.
To remedy the situation, I created my own user coordinate system in QGIS with the following parameters, selected empirically, and set it for the layers of the cadastral map:
+proj=merc +a=6378137 +b=6378137 +lat_ts=0.0 +lon_0=0.0 +x_0=-11.0 +y_0=-6 +k=1.0 +units=m +nadgrids=@null +wktext +no_defs As a result, the problem is removed.
Little aerobatics
The first. An interesting option is the storage of spatial information in the database. If there is a Microsoft SQL database, Oracle or Postgres in which, for example, there is a table with a list of contractors with their addresses or a table with a list of equipment scattered across the territory, then this table (query) is useful to hook on QGIS.
It is only necessary to add a geometry field, and this will help QGIS. Do not forget to set the database permissions to edit the table to the user accessing it from QGIS. Information entered in QGIS will be stored in a database, and when changed in the database by third-party management applications, immediately displayed in QGIS.
The second. If there is no desire to give direct access to changes in the database or another data source (for example, a CSV file), but I want to quickly receive information on the map, that is, an effective way for that.
For example, we have information about tenants of our property in the 1C database, we want to show tenants on the map, highlight the rent debtors with different colors and display the amount of debt or some schedule with a repayment tendency.
It is necessary, just as we do with ordinary layers, to attach database tables with information of interest to us (for example, on debt dynamics, debtor, real estate objects, etc.) to the QGIS project with read permissions. Since the attached tables initially do not have geometry, and we do not allow QGIS to create and modify it, then, of course, we must somehow give the GIS the missing information about the location of the property.
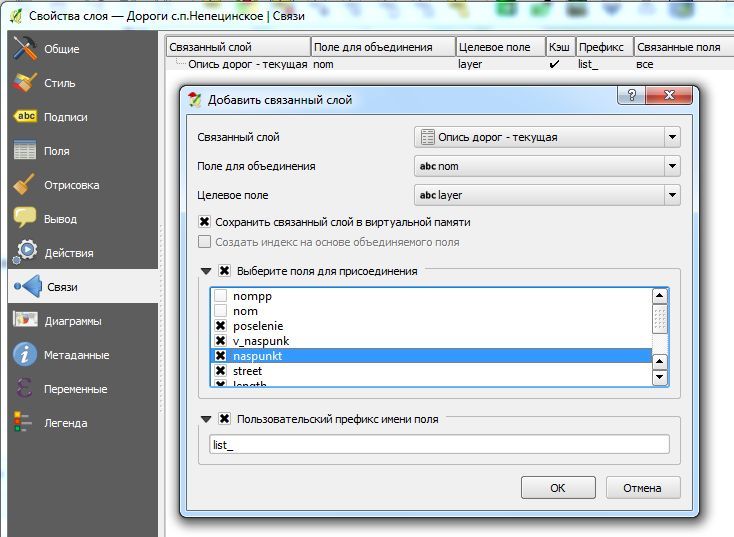
To do this, create a .shp layer, place objects on it, putting unique numbers in one of the attributes that correspond to the identifiers of these objects in 1C. That is, in both tables there should be fields with the same identifying data on which they can be linked to each other. Set up appropriate links in the .shp layer properties. As a result, we do not change 1C data from QGIS, but their change by 1C immediately affects the display of objects and related information on the map in QGIS. It remains to adjust the properties of the map layer for a beautiful display of information and enjoy the result in real time.
Third. You can display data on a map in QGIS not only by points, lines and polygons with inscriptions, but also by diagrams that are generated automatically based on the data presented.
Fourth. It is possible to obtain analytics from QGIS in the form of tables and summary data calculated taking into account geospatial information. For example, having a table of settlements with the number of residents in each and a table of roads from OSM, quickly calculate the population living at a distance of more than 3 kilometers from regional and federal highways.
NextGIS.com
Another discovery of the year for me was the NextGIS.com cloud product. The young Russian team NextGIS is actively involved in the development of QGIS. This can be ascertained by the number of production modules available in QGIS. In 2016, they launched the aforementioned web-mapping service and tirelessly expand its capabilities.
→ Link to project
Project sources are available on github . So if you want to deploy a web service yourself - no problem. However, the conditions offered by the NextGIS team to access their cloud no doubt deserve the attention of even the most stingy users.
Creating your own web GIS in the NextGIS cloud is free. You will receive a domain name in the format of yourname.nextgis.com and you can use almost without limitations all the goodies they provide. The thing is to begin to get acquainted with the decision and use it in practice. The main limitation of a free subscription is the inability to restrict read access to information. Anyone can see what is posted by you.
Already with a free subscription, you can create as many web maps with arbitrary settings, layouts and styles of the layers you downloaded, as well as view, analyze maps on your work computer and, complete with NextGIS Mobile, collect data in the field, placing them directly into the cloud . You can embed maps in websites or look at the service.
A paid subscription reduces the limitations, including on the number of users editing layers (initially one user), on the delineation of their rights. You can show some layers to everyone, and restrict access rights to others. Plus, you can use your own domain name, for example, gis.mykompaniya.ru and get a variety of pre-configured substrates (in a free subscription there is only an OpenStreetMap card).
According to the representative of the company, the subscription terms are now changing. You need to focus on the information posted on the website of the service at the address nextgis.ru/pricing . Previously, the paid rate was the same and amounted to 3,000 rubles per month. Now paid subscription costs from 600 rubles. They promise that for the same 3000 rubles. per month, the client will receive a full and up-to-date software package and services, as before.
QGIS and NextGIS.com Integration
I will dwell on a few not obvious principles of integration of QGIS and NextGIS.com. Working in QGIS, you create layers and their styles in your projects, as already discussed above. Now in order to place the created layer on the web map we have several ways. Consider first a long way to deal with the ideology of NextGIS Web. To place a layer you need:
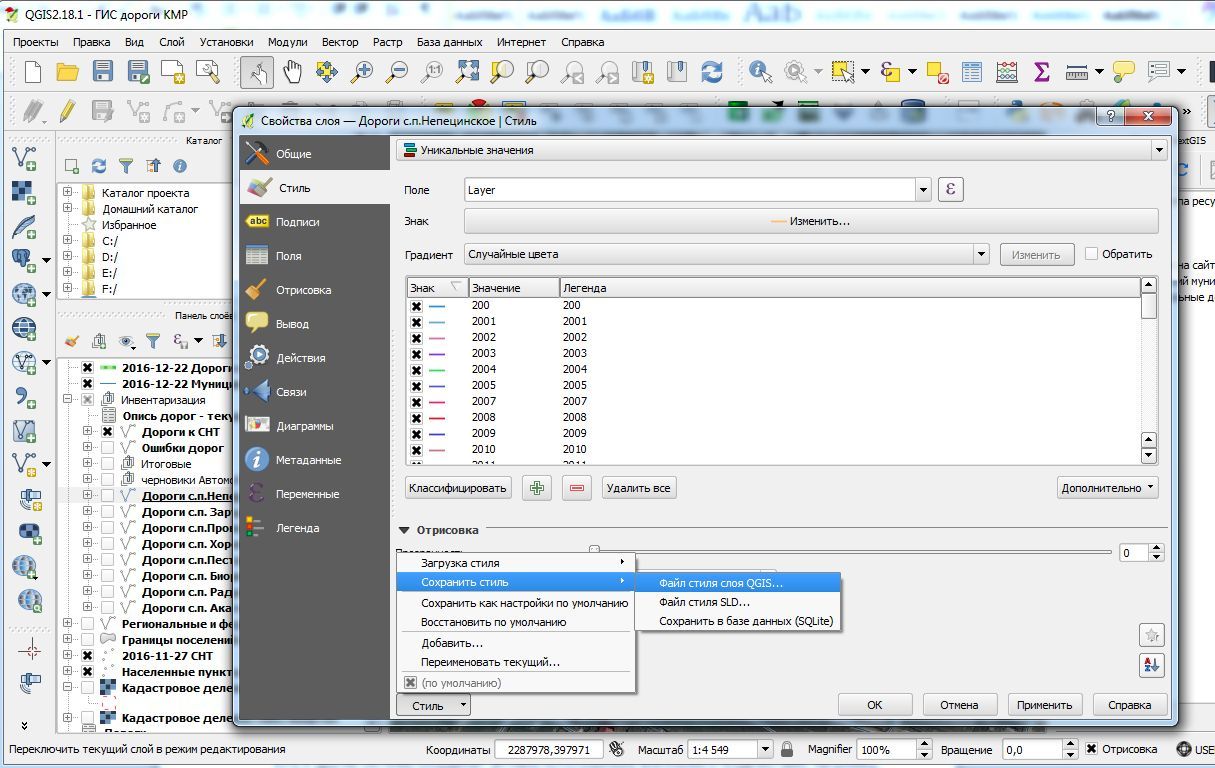
- enter QGIS in the layer properties and save the style to a file;
- save the layer file in the WGS 84 coordinate system (EPSG: 3857).
Then, having two files (layer styles with the .qml extension and layer tables with the .shp extension), you need:
- log in to your account on your site in the NextGIS.com cloud,
- Create a new layer through the option “Create a resource - Vector layer” and in the “Vector layer” tab load the file with the .shp extension.

After saving the resource in its settings you will be able to load layer style files. For each data layer, you can save several different style files that will display data on the web map in different ways.
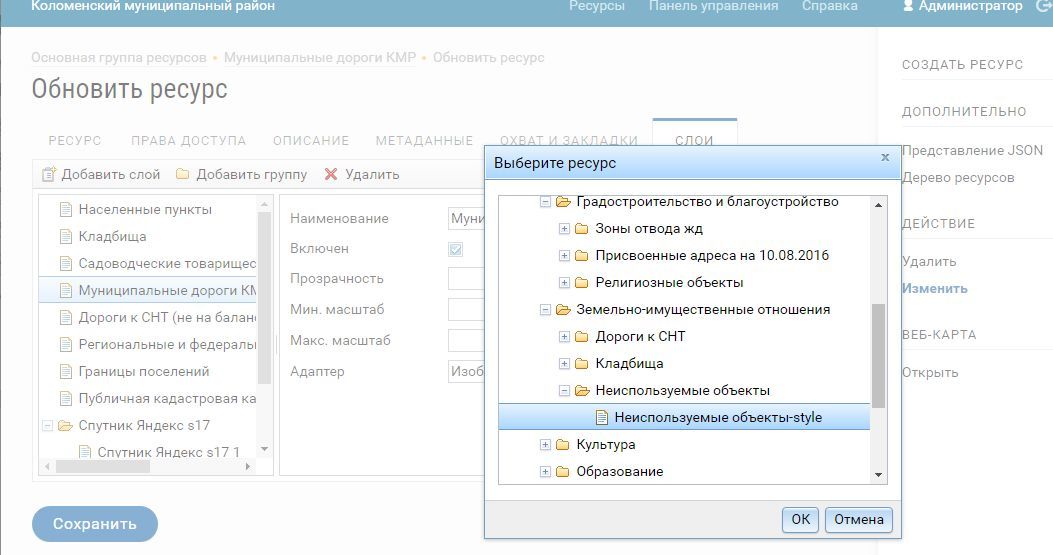
Finally, it is time to place the layer on the map. To do this, open the home page of your site. Among the listed objects of the main group of resources there will be at least one existing web map. Enter its settings and select the Layers tab. Click “Add layer” and find your layer in the opened table and below it the style in which you want its data to be displayed on the Web map. Click "Save" and "Web Map - Open." Layer in front of you on the map - turn it on to display.
Really a long way, isn't it? But there is a route that solves all this and more directly from QGIS with a few keystrokes and which I use.
NextGIS Connect module for QGIS
Install the NextGIS Connect module through the QGIS “Module Management” menu. The interface will display the NextGIS Resources widget. In its settings, create a connection by specifying your account information, including the address of your site (in the format “http: //mysite.nextgis.com”), the username “administrator” and the password obtained during registration. Instead of entering a username and password, you can use a guest account, but with it you will not be able to upload data from QGIS to the website - you can only receive information from the site. After registration, the screen will display all your resources on the cloud service.
Now in order to place QGIS layers on a web map there are two ways.
The first is to load the entire QGIS project with one button. It will be raised to the cloud as a separate folder with all layers and a new web map. Right from the window, you can go to it and see how your data looks in the browser, share the link with friends, colleagues, embed a map on any site.
But when uploading updated data in this way, we are faced with an unpleasant fact - the new downloaded project will use the new URLs of its resources, including web maps, which we have managed to share with friends and colleagues.
Therefore, there is a second method more elegant, designed to work with already created web maps. To do this, we bring up from QGIS to the NextGIS.com cloud on one new or modified layer:
- delete in the NextGIS Connect window the layers that we want to raise with the updated ones;
- select the final resource folder in the NextGIS Connect window;
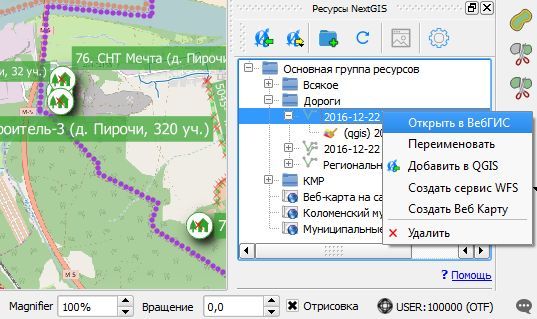
- select the layer in QGIS with the right mouse button and select “NextGIS Connect - Import selected layer” in the context menu. The selected layer is copied to the cloud along with its style;
- repeat actions for all layers that we want to update on the web map;
- select in the NextGIS Connect window the map on which we are going to place the layer and go to it by right-clicking through the context menu "Open in WebGIS";
- in the web resource window that opens on the site, click the Edit button, select the Layers tab, and click the Add Layer button. We find the loaded layers and add to the map the styles placed under each of them. Click "Save".
Please note that if you are not logged in to the site under your account, then although you have passed the specified route, saving data will cause an error.
Done, under the link “Web Map - Open” you will see a map with the same URL and a combination of old and updated layers.
Raster layers
The usefulness of custom raster layers as maps substrates when working in QGIS is not immediately obvious, since there is a Quick Map Services extension module, which in a couple of clicks adds layers of public web maps to the project, such as Yandex Satellite or a cadastral map.
But over time, the need for them appears in the following cases if:
- the map needs a more detailed than publicly available photographic plan of a particular object or territory that you have available
- You are working on the road, with unstable Internet access or if you are plagued by a long load of public images each time you move the screen;
- you are using the free version of NextGIS.com, and the only OpenStreetMap substrate on your web maps does not suit you.
In the second and third case you will be helped by an open desktop application SAS.Planet. Download it to your computer from the site . Outline the territory you want to plunder into a raster layer, select “Selected Area Operations” in the menu, open the “Glue” tab and set the selected settings (for example, as shown). The “Start” button on your computer will generate geotagged raster images that can be loaded as a raster layer into QGIS or a resource at NextGIS.com.

What you should pay attention to:
- The preferred file format for storing raster data is GeoTIFF with JPEG compression. It takes up little space, is the only one loaded on NextGIS.com and may contain tiles — small, multi-scale images that can be quickly and efficiently opened on the web map as you move the screen. All tiles by default are stored in one file, but this monster does not need to be downloaded to your computer each time; strictly necessary pieces of tiles will be selected from it. However, if the file is still too large for you or for uploading to the web map service, then it can be split into parts as shown (2x2 pieces, 4 files) in the above settings.
- You can put a raster layer into a QGIS project by dragging and dropping. And if you need to fasten several parts, then you can use the so-called "virtual layer" or simply collect all the raster layers in a group.
- The maximum scale for Yandex-Satellite is 18. 17 is sufficient for many tasks, and the file with tiles is reduced significantly.
- When gluing in SAS.Planet, only tiles of the specified scale are placed in the GeoTIFF file, and after attaching the raster layer to the QGIS project, it is recommended to select the “Pyramids” option in the layer properties. High resolution rasters can slow navigation in QGIS. Creating copies of low-resolution data (pyramids) allows you to significantly increase speed, since QGIS will automatically select the optimal resolution depending on the current scale. Create smaller pyramids.
NextGIS Mobile
If you have to work in the field, there is a desire to quickly receive information on the go from the map, at the same time collecting data and quickly sharing with others, then it is useful to use the free NextGIS Mobile application for a smartphone or tablet. With it, you can receive and process geographically distributed information from various sources, including from NextGIS.com layers and third-party databases, download from QGIS, modify, draw objects and create new layers, return them to QGIS. And all in relation to their own location. It's nice to save layers of your own movements in layers.
For mass collection of information, it is rather easy to create your own forms that are convenient for use by untrained employees from an application on a phone or tablet.

Instead of conclusion
There are many more ways to work with the solutions mentioned above. For example, layers can be placed on some free or own PostgreSQL database server, you can work with them in QGIS and other applications, such as LibreOffice, Microsoft Access or Microsoft Excel, and on NextGIS.com once you set up the layer to display on the web card As a result, all changes to data in QGIS or in Microsoft Excel will immediately be displayed on the web map.
Documents located in the cloud can be attached to map objects and photos. Their viewing is convenient and clear. However, if you have to periodically replace this layer with a new one from QGIS, then with the removed version all the beauty you filled will disappear. The alternative is to work in the cloud not by replacing the layers from QGIS (via the NextGIS Connect module or manually), but indirectly, for example, again through the once configured layer that receives information from the Postgres database.
In any case, the QGIS, NextGIS.com and NextGIS Mobile bundle is a flexible and useful tool available to everyone. Going to work with GIS to solve applied problems with geographically distributed data is a fascinating task and the effort to study the subject pays off with the opportunities that we open to ourselves.
In conclusion, to illustrate the materials of the article, I suggest this short video.
Source: https://habr.com/ru/post/321710/
All Articles