Analysis of Habrahabr and Geektimes articles

First there was the idea to collect the frequency dictionary of Habrahabr and Geektimes words, but then I found the perfect: Detailed analysis of Habrahabr using the Wolfram Language (Mathematica) language (before viewing this article I recommend following the link), I saw the difference in the results and decided to do this for articles with Habrahabr and geektimes. The review did not include articles with podcasts and non-standard design (habrahabr.ru/article). The result was an analysis of 170,000 articles. All images are clickable. Wolfram Notebook code on github . Dataset on Yandex.Disk . UPD: regarding the calculation of the rating - I also made a mistake when calculating. Here in the discussion OsipovRoman writes that the differences are small.
Data processing results
Hub Analysis
Distribution of the number of hubs in which the article is posted:

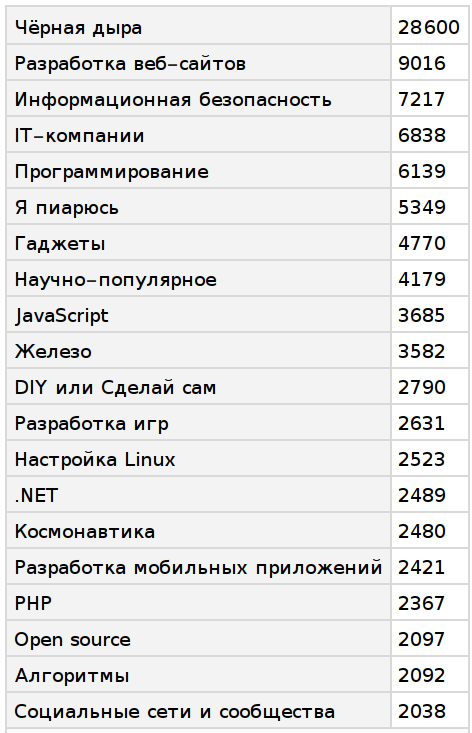
The largest hubs in the number of articles:
')
If we consider only unique articles (related to only one hub):
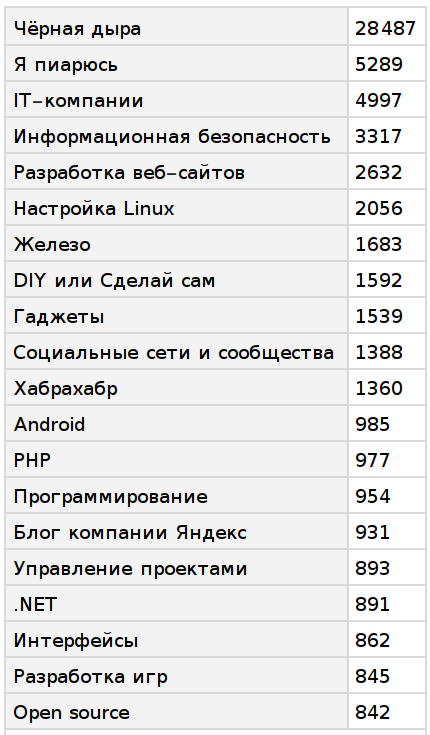
The link graph did not; did not collect the list of hubs separately.
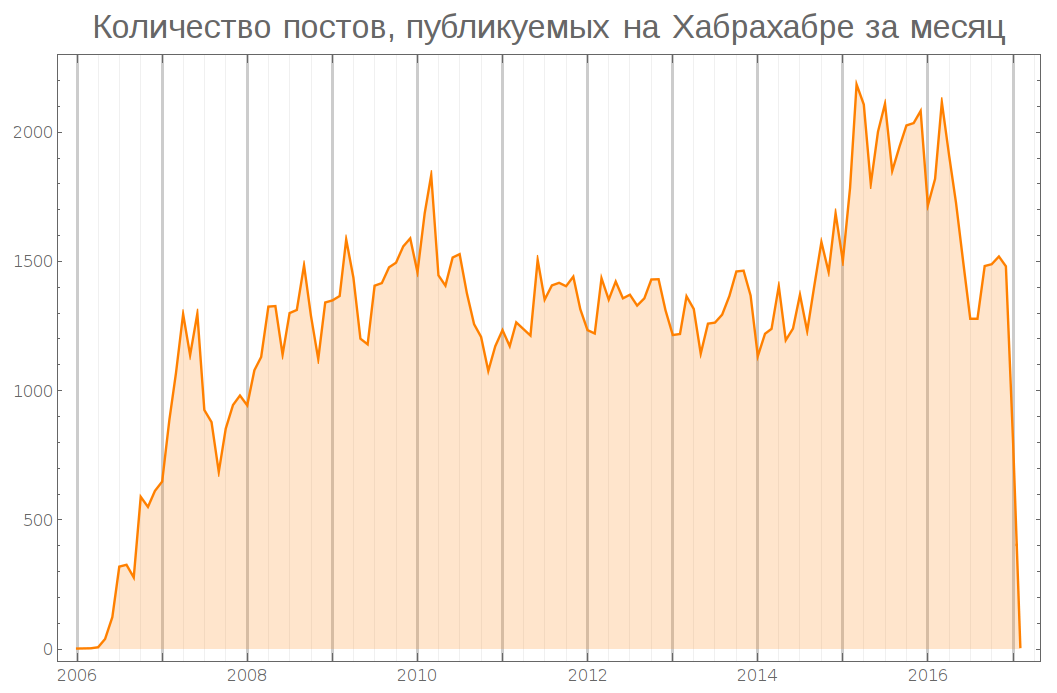
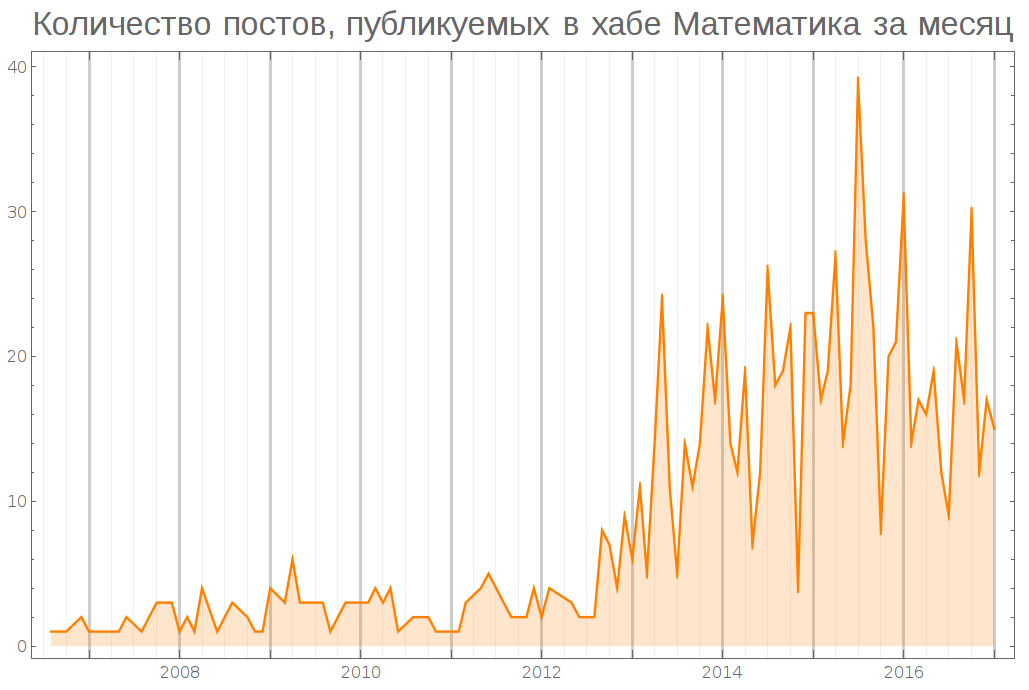
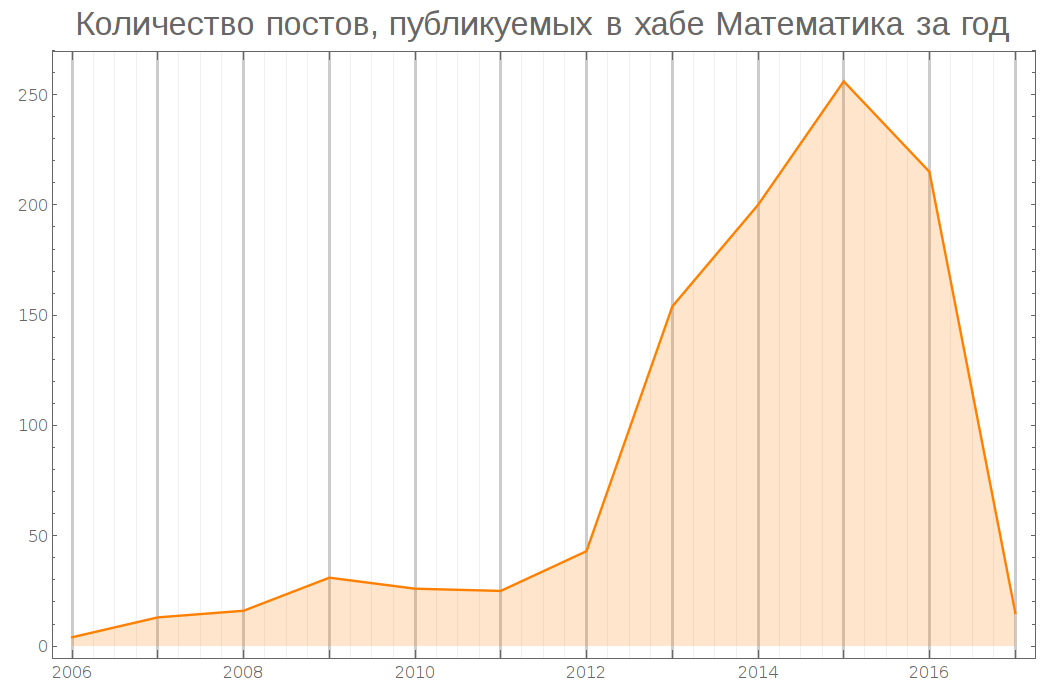
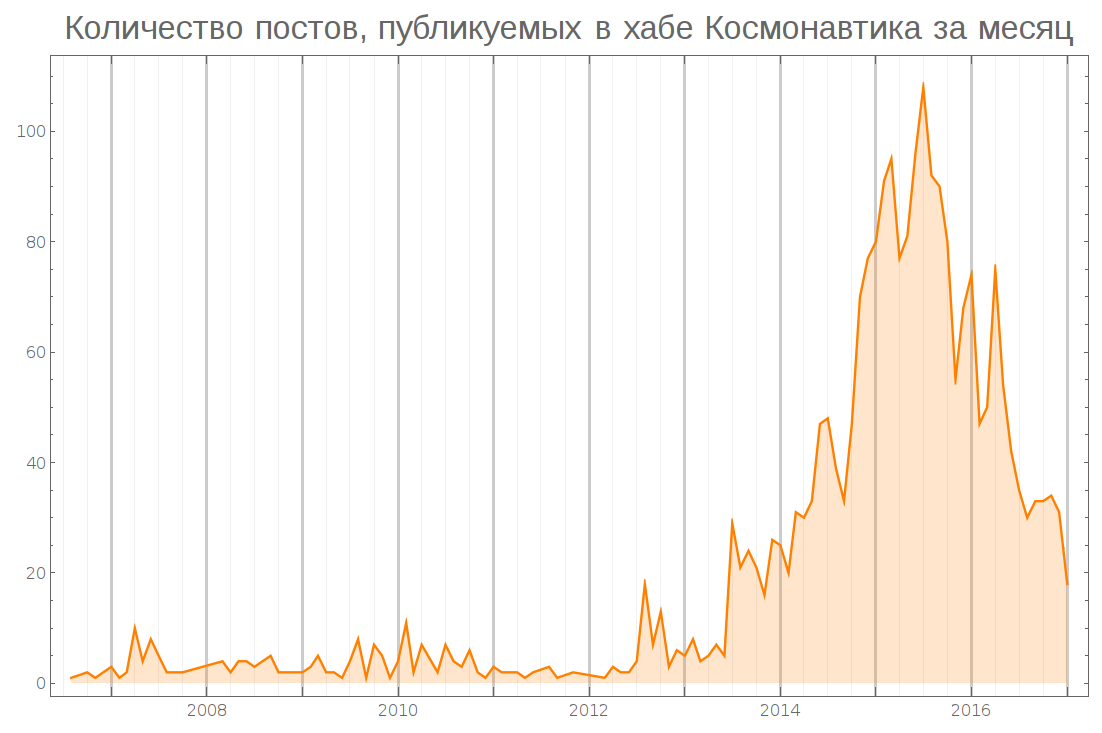
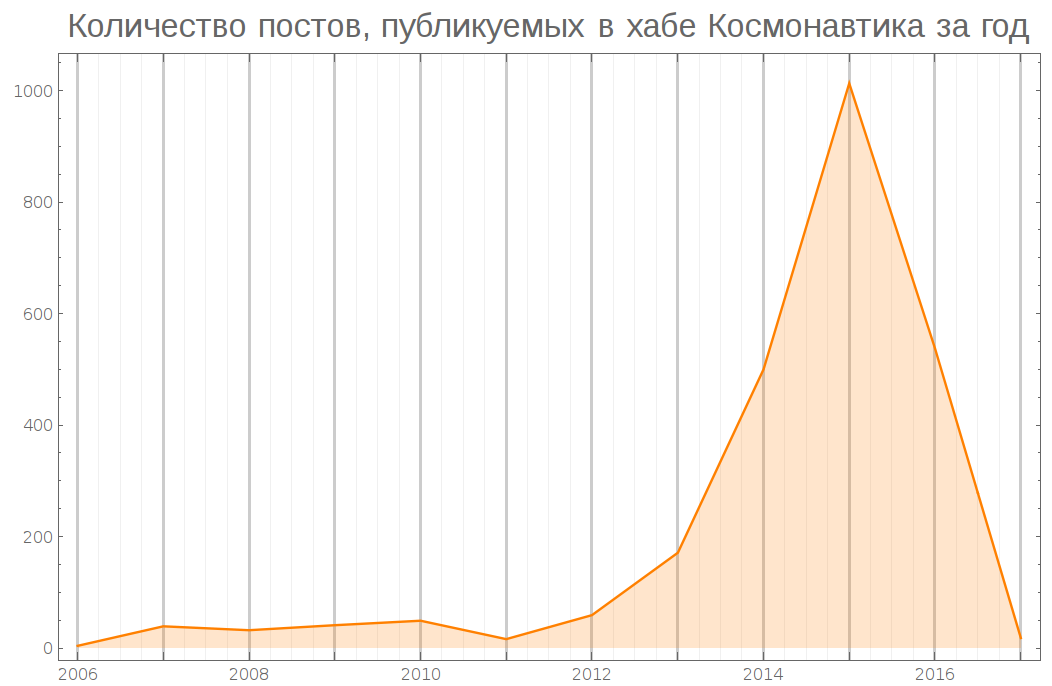
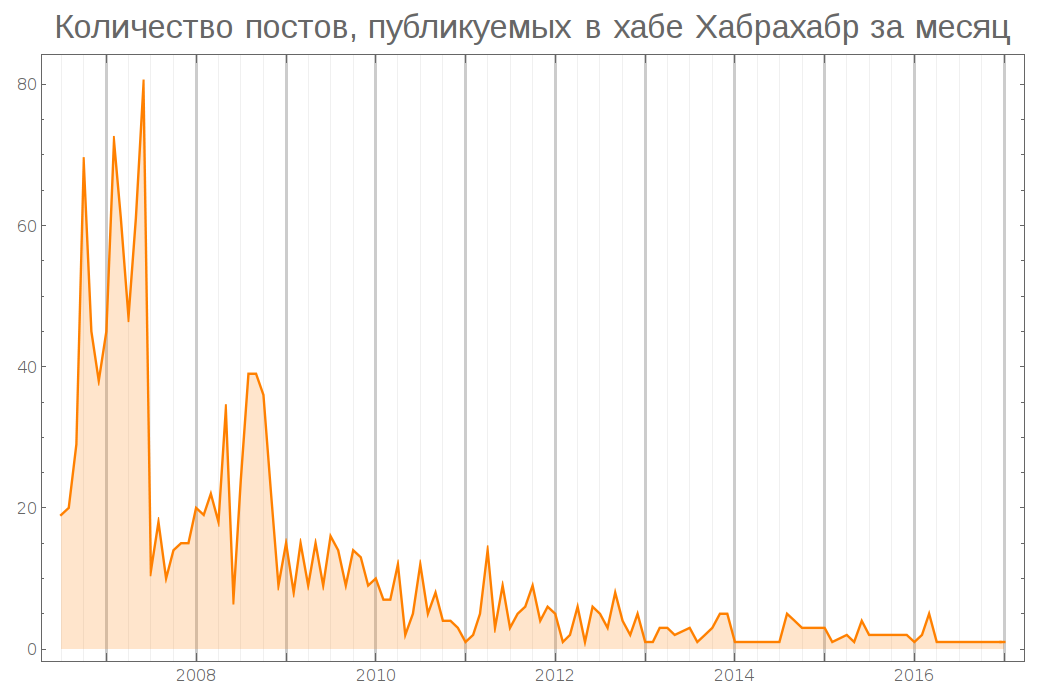
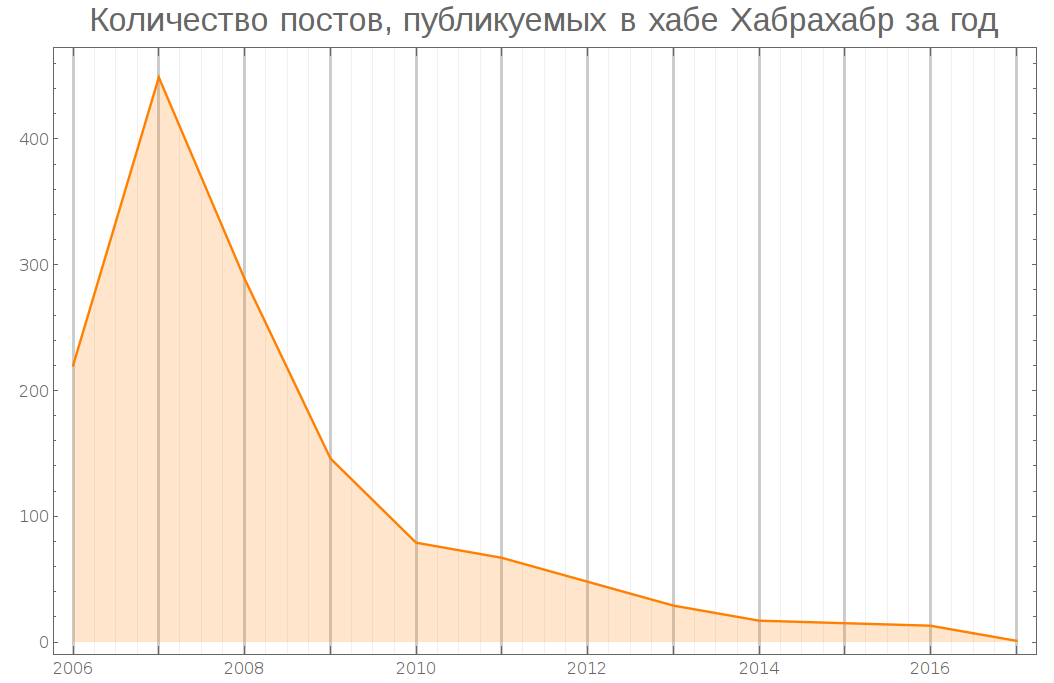
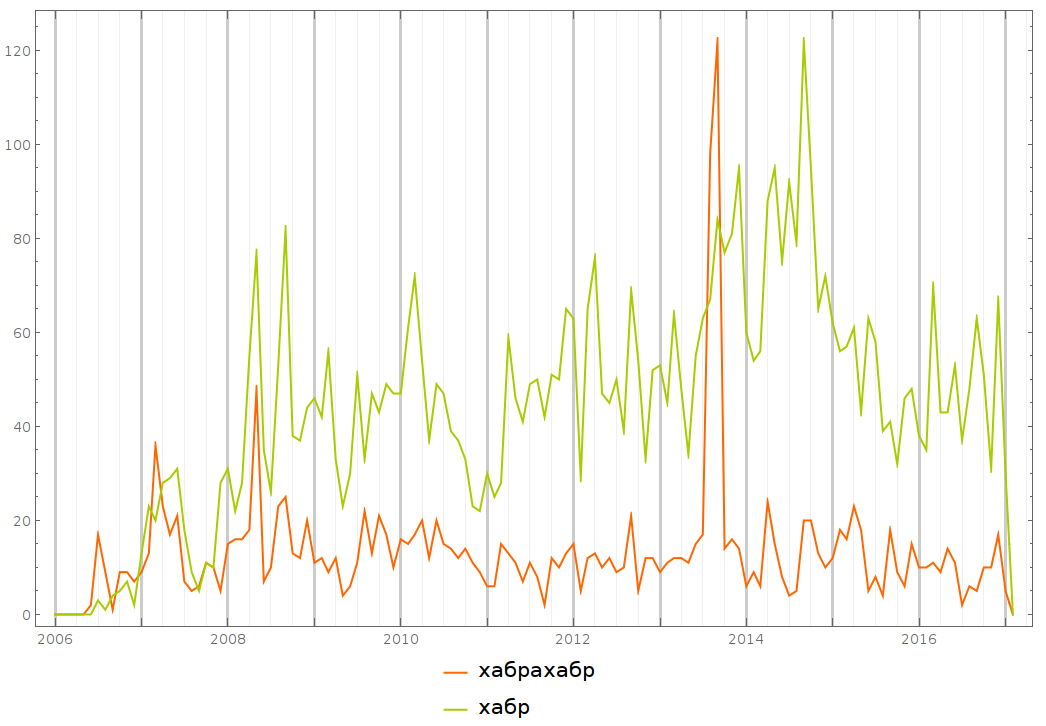
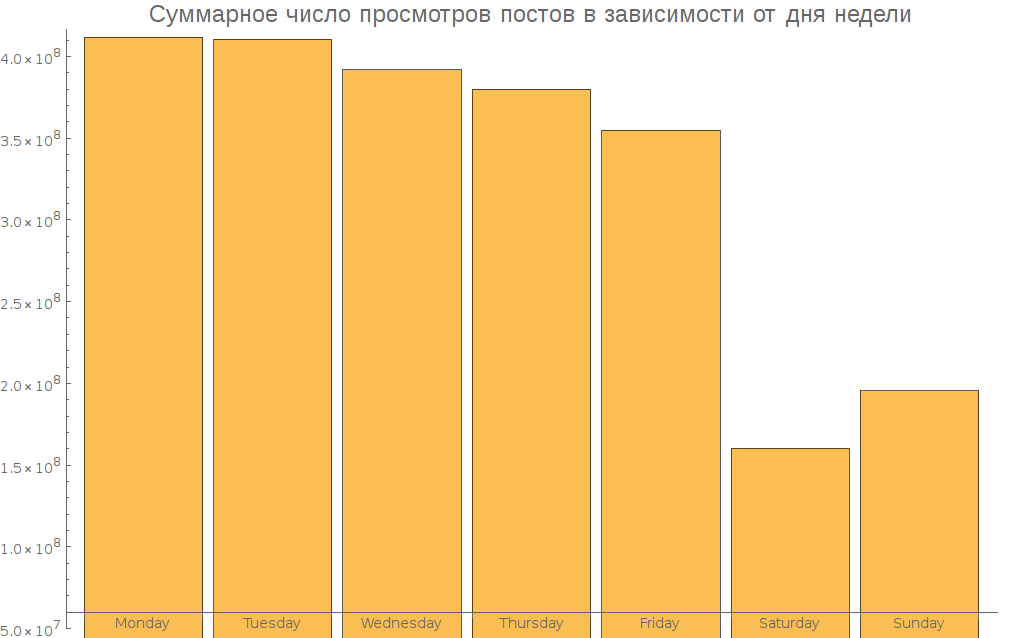
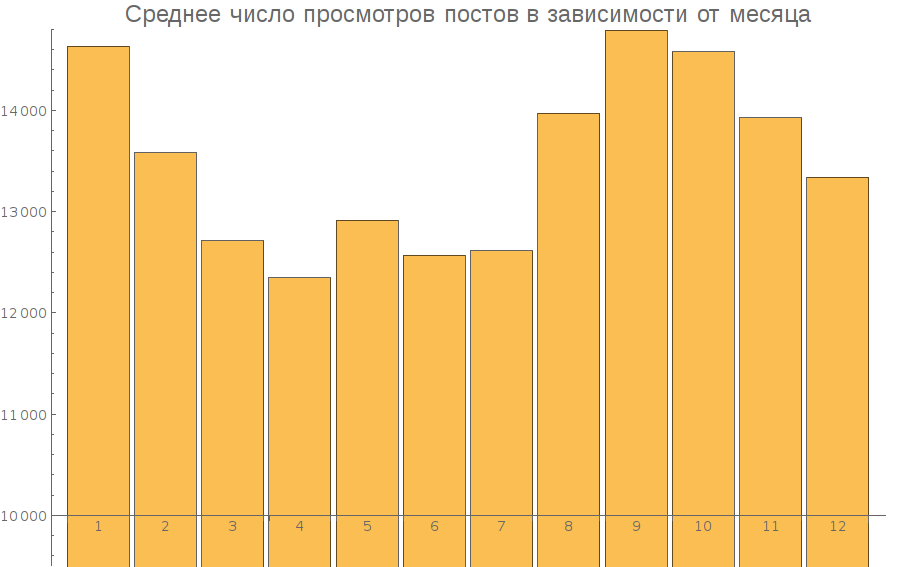
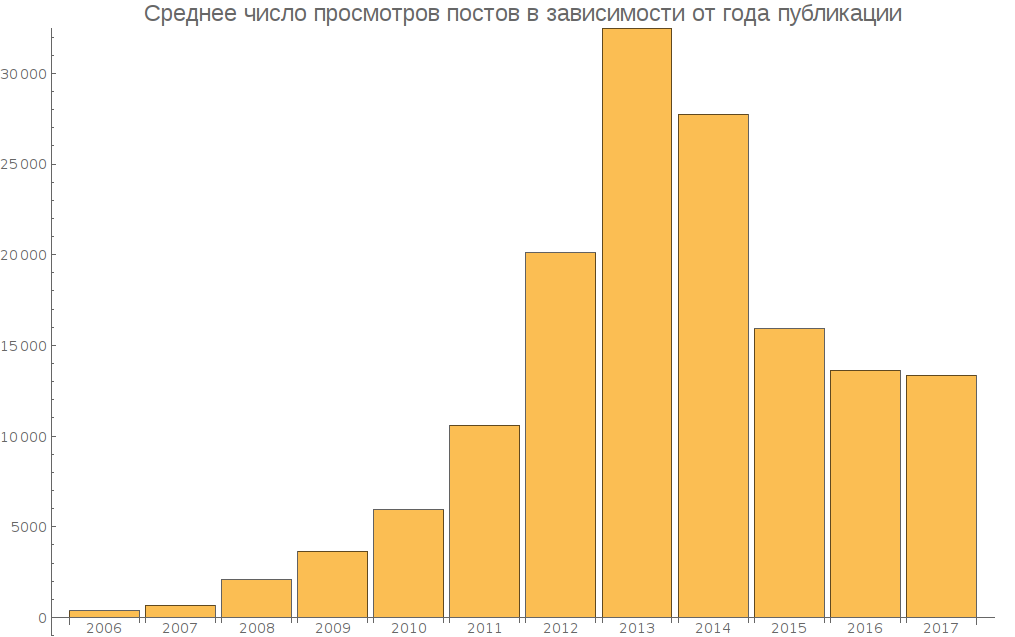
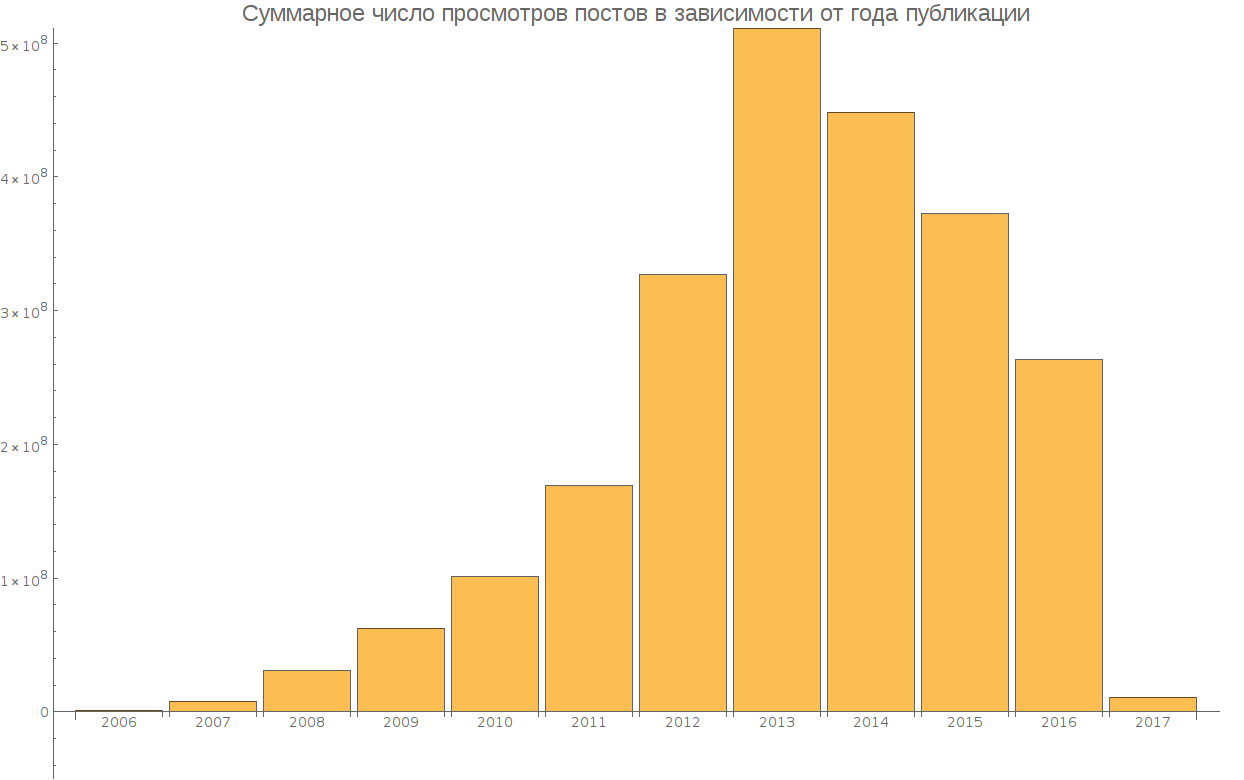
Number of articles depending on time
In the caption to the pictures, only Habrahabr is mentioned, but we mean Geektimes too.
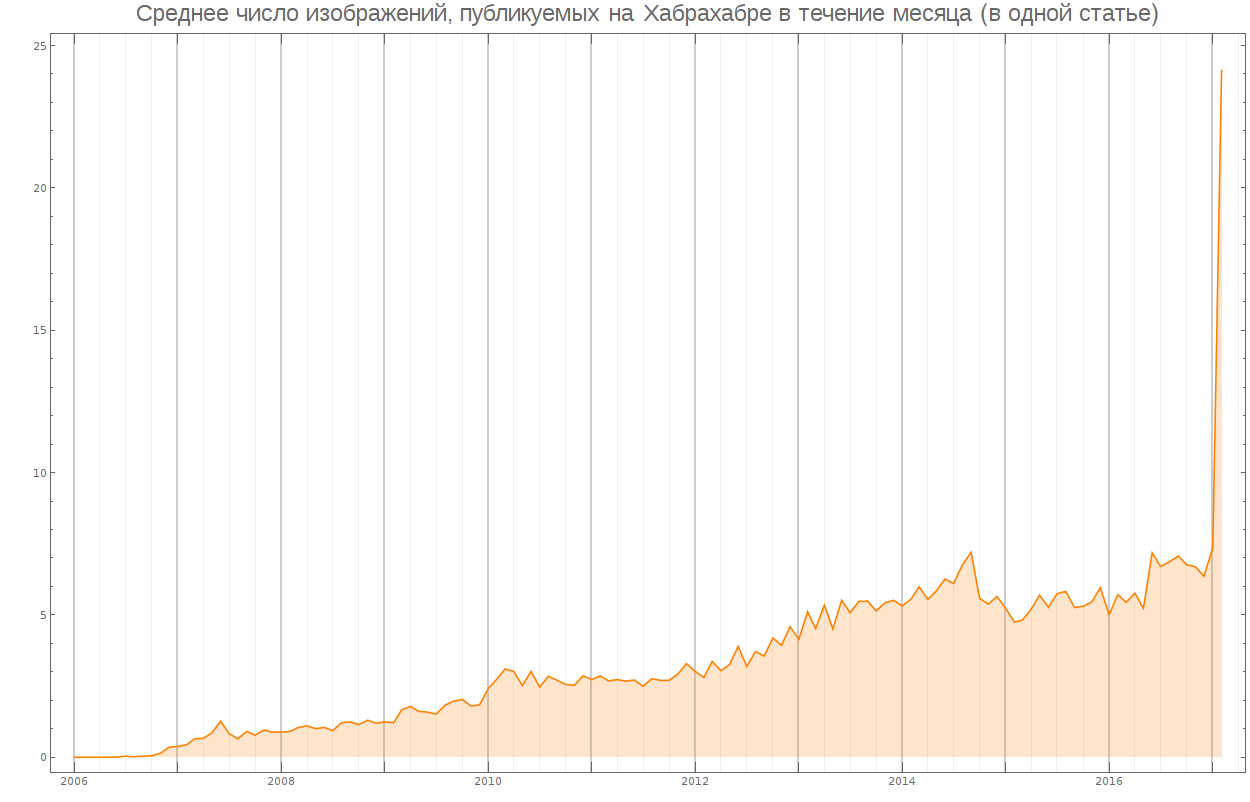
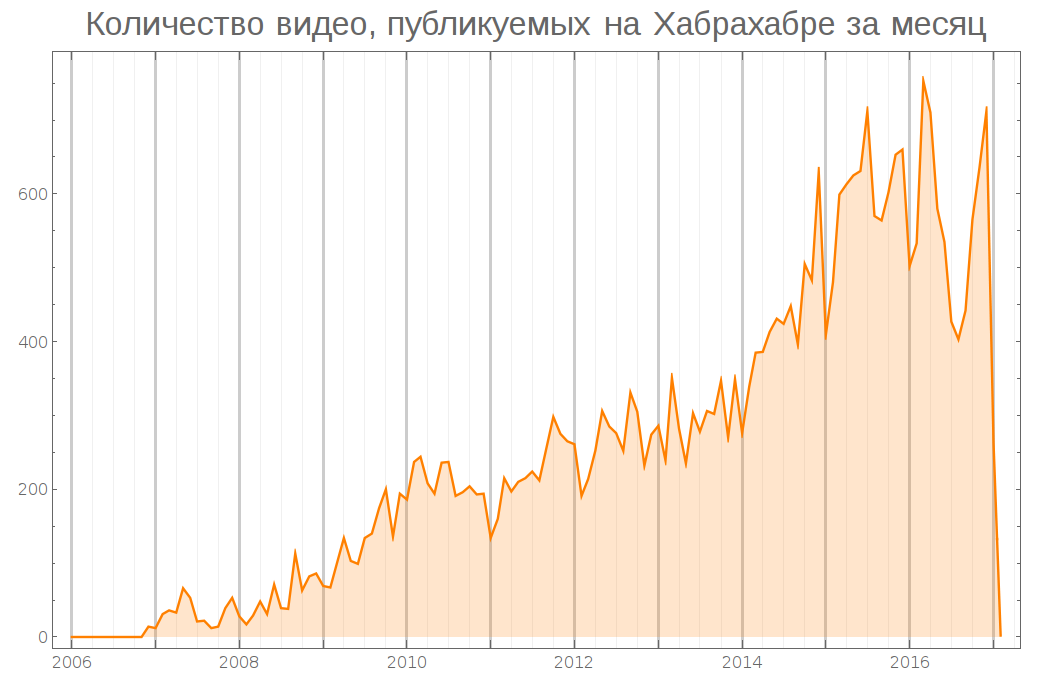
Number of posts per month:
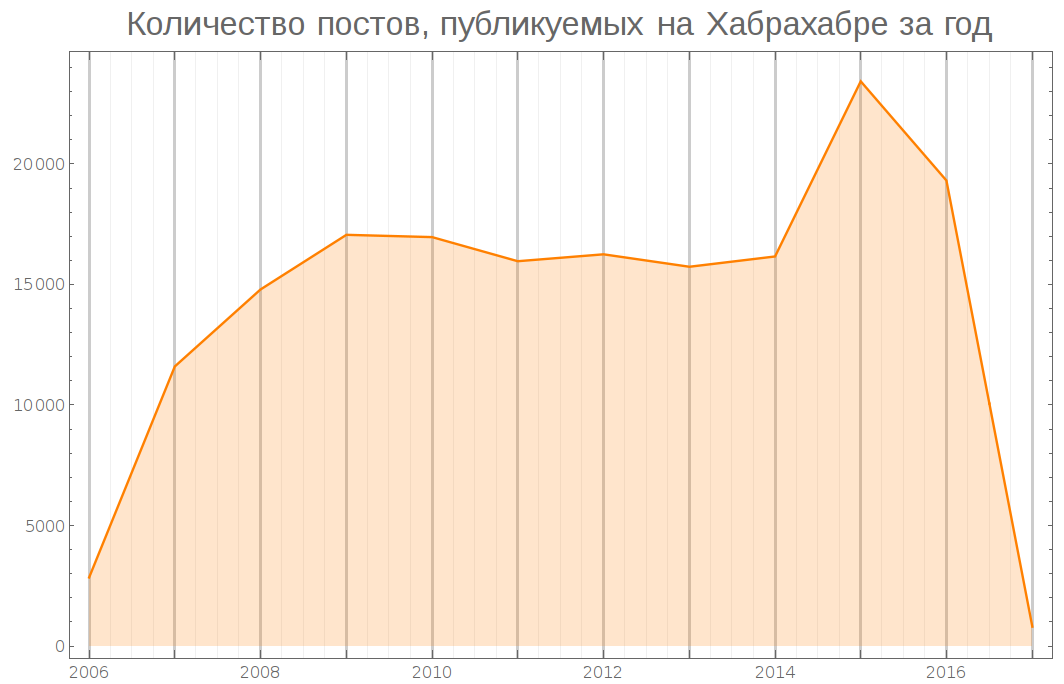
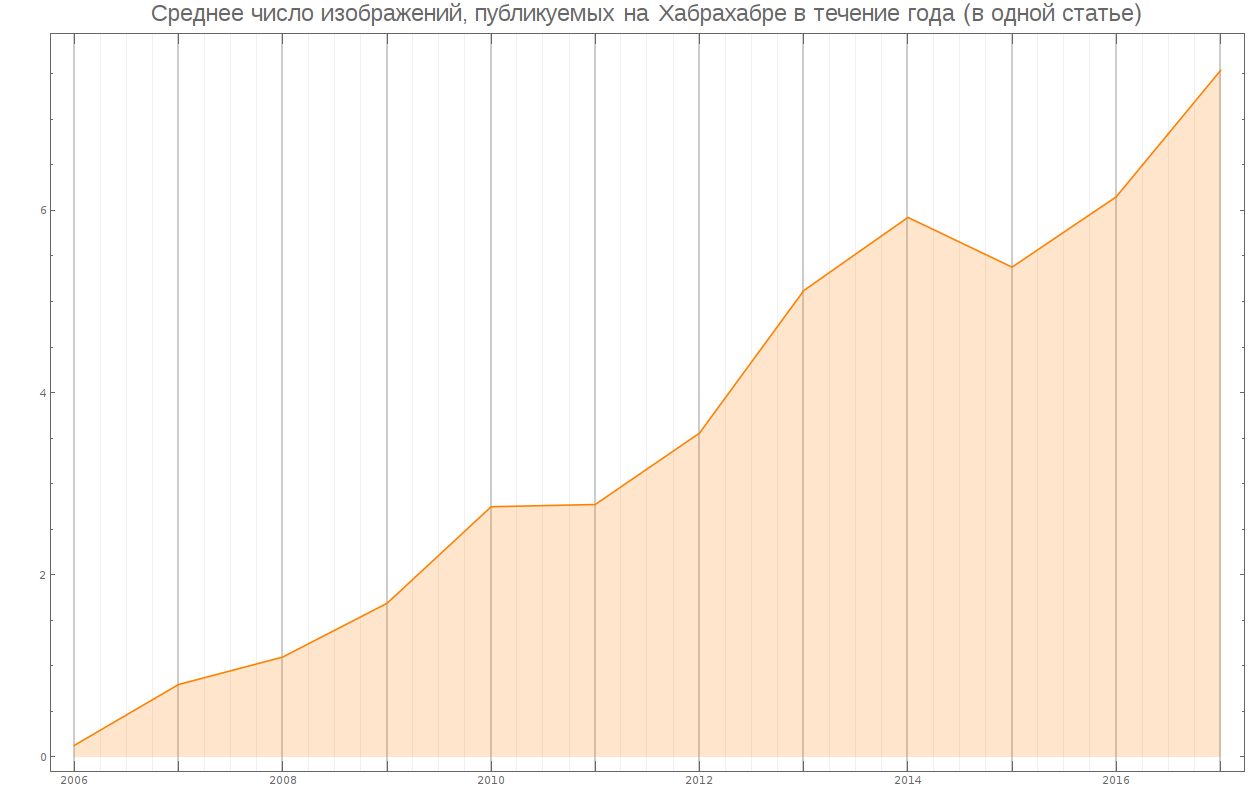
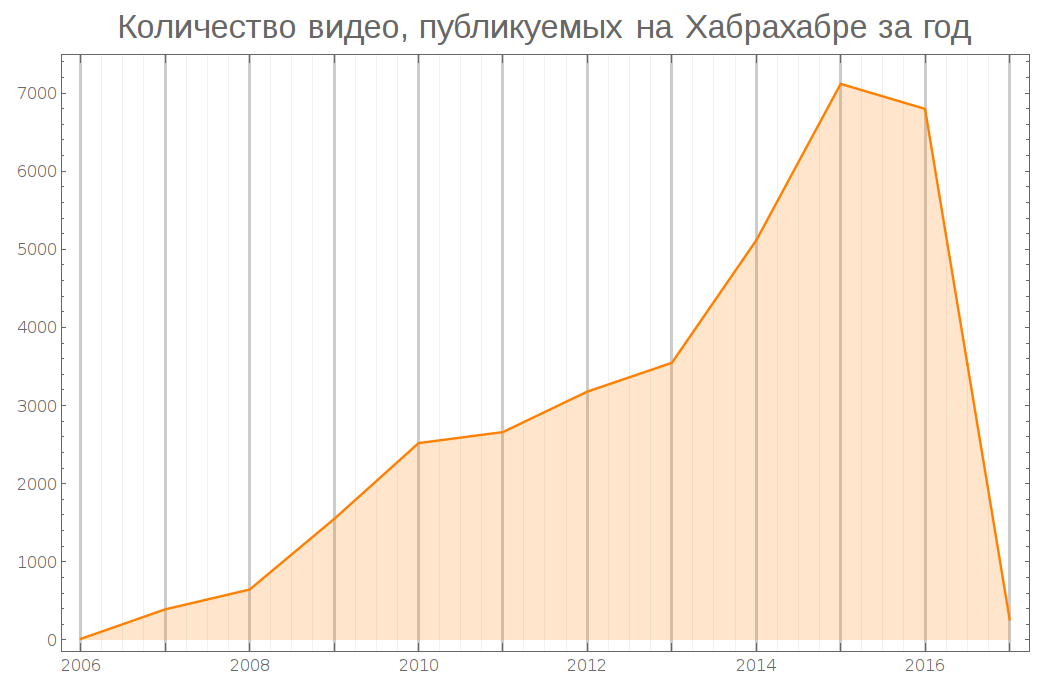
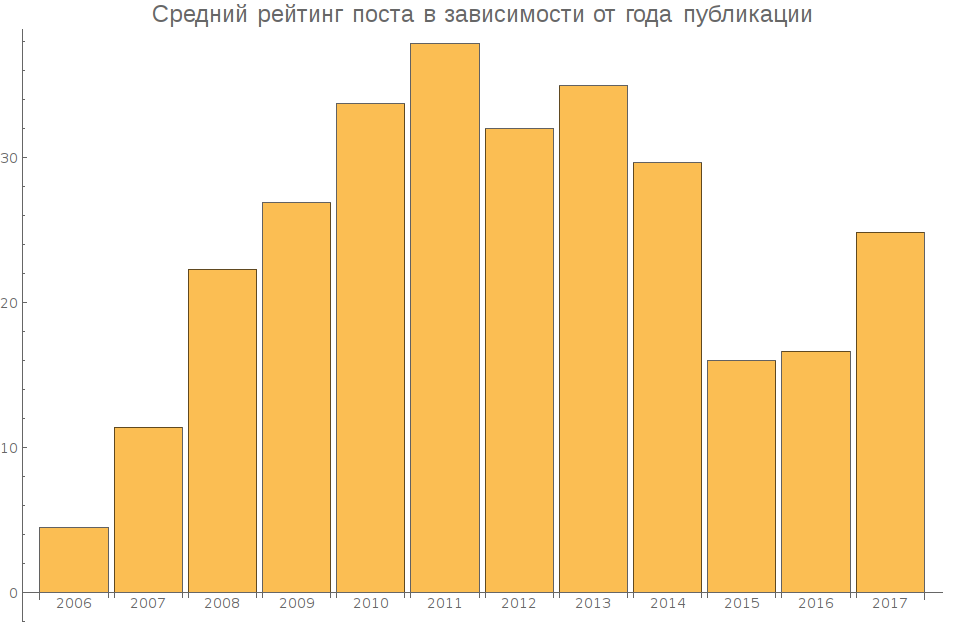
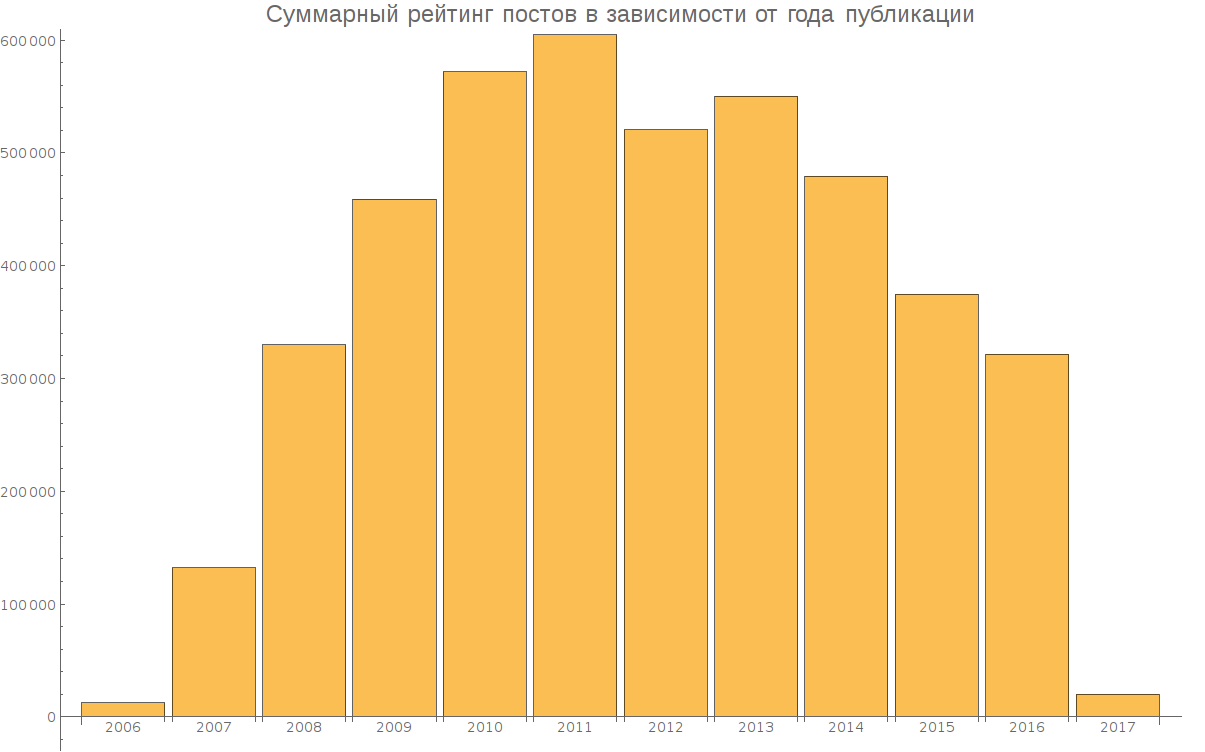
Per year:
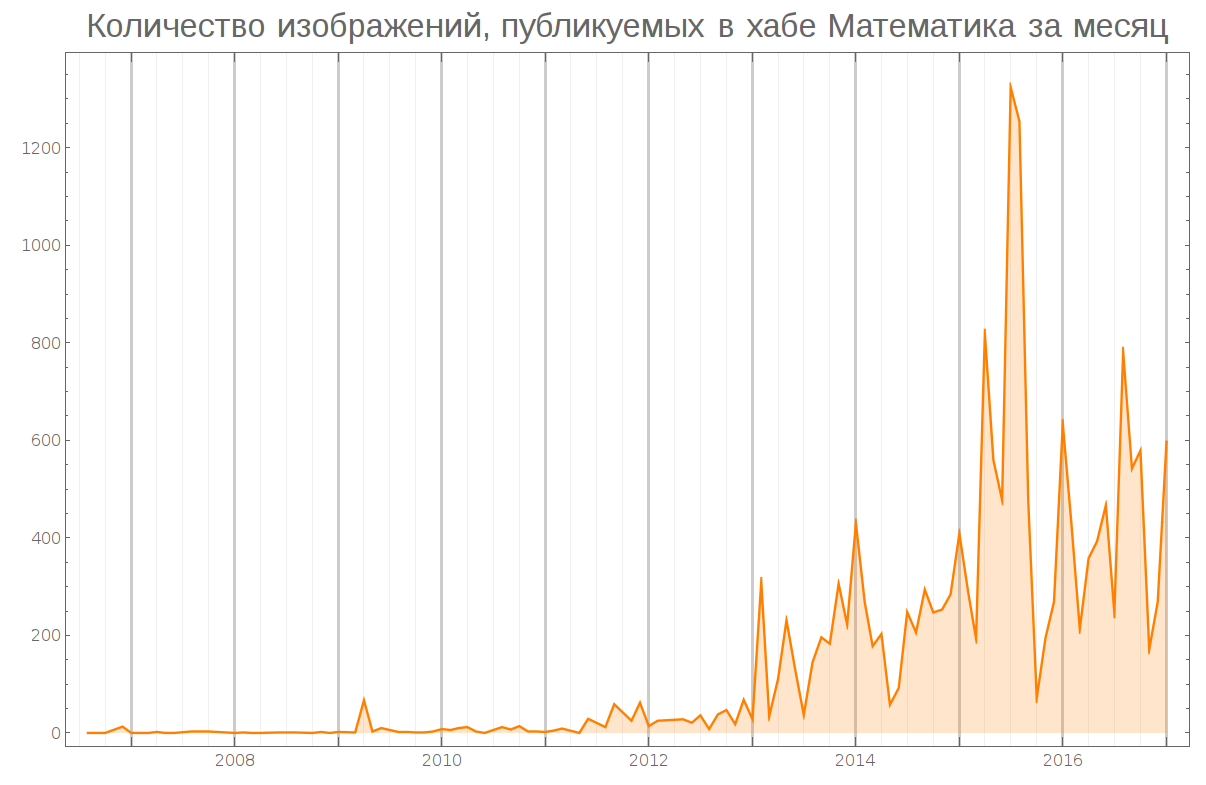
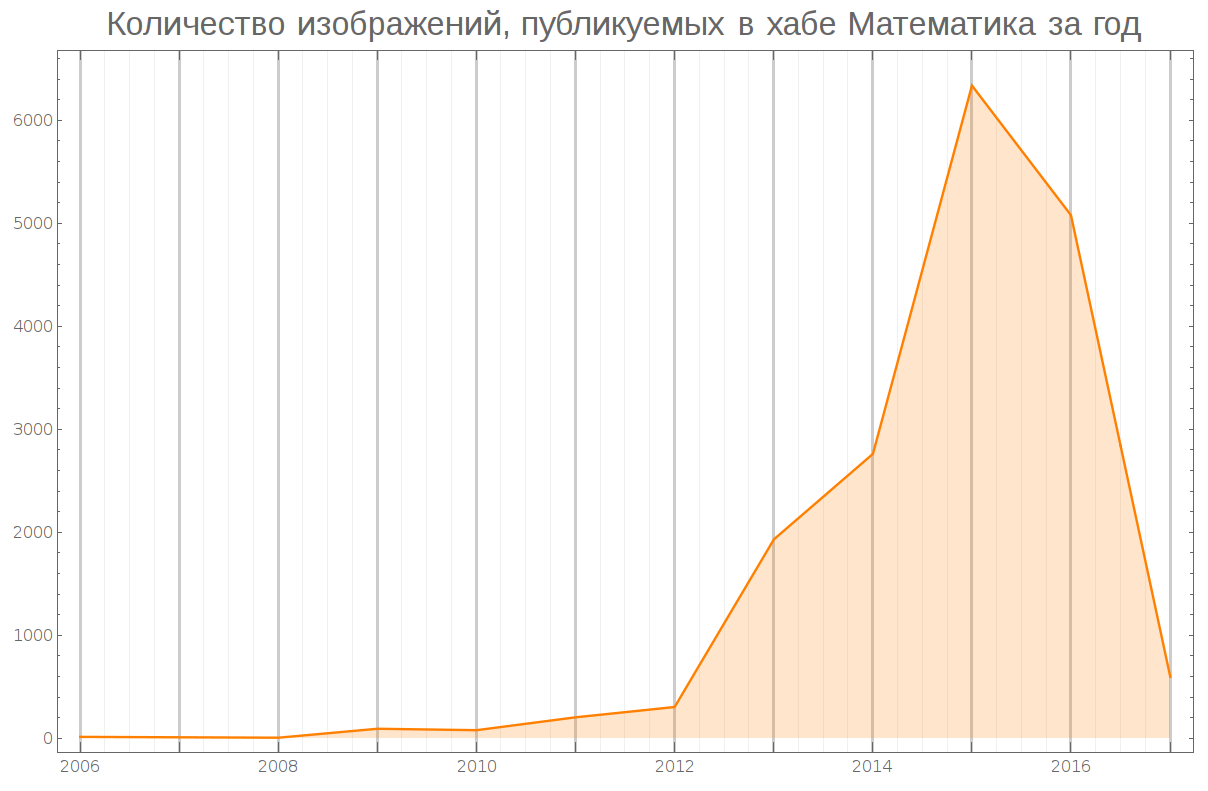
In the hub "Mathematics":
Hub "Astronautics":
Hub "Habrahabr":
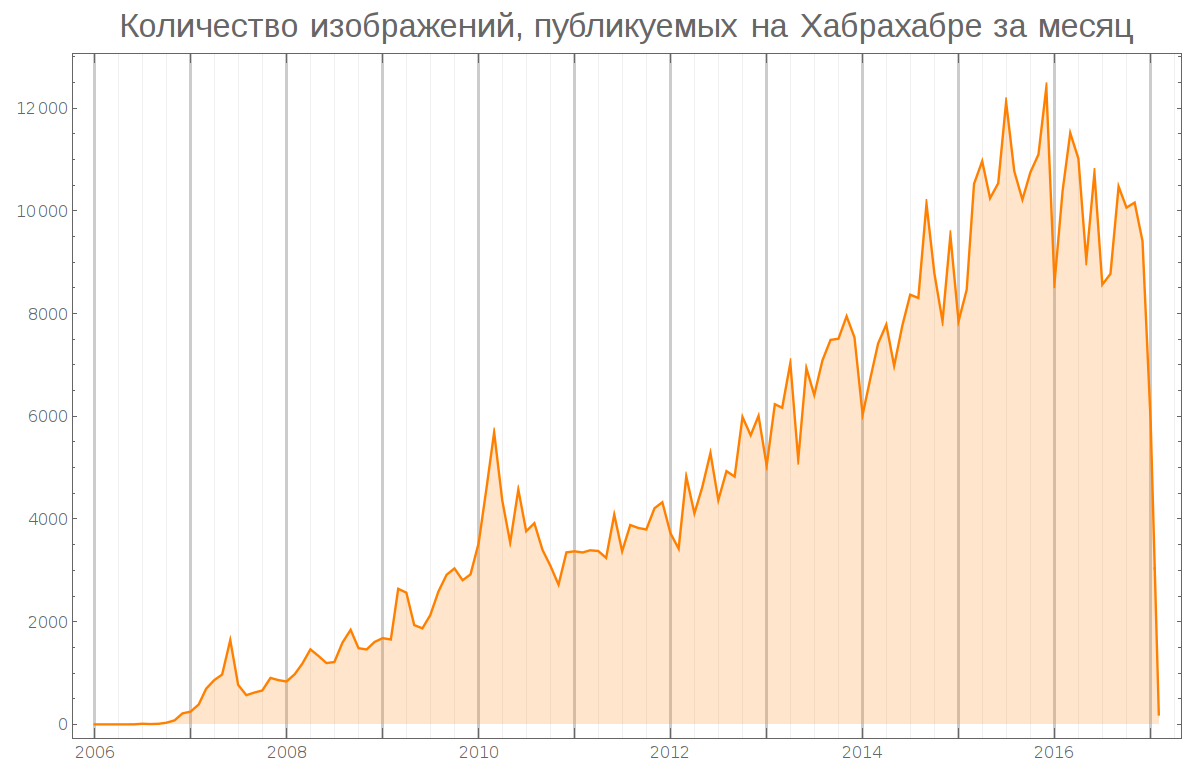
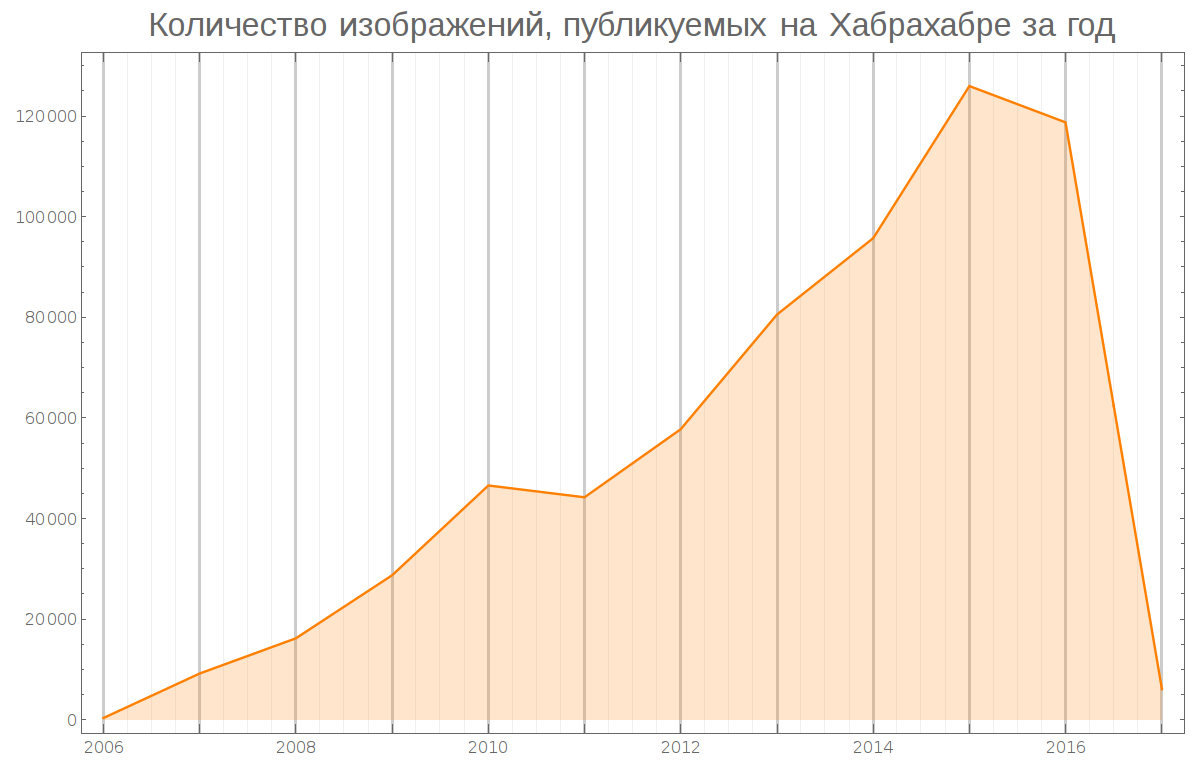
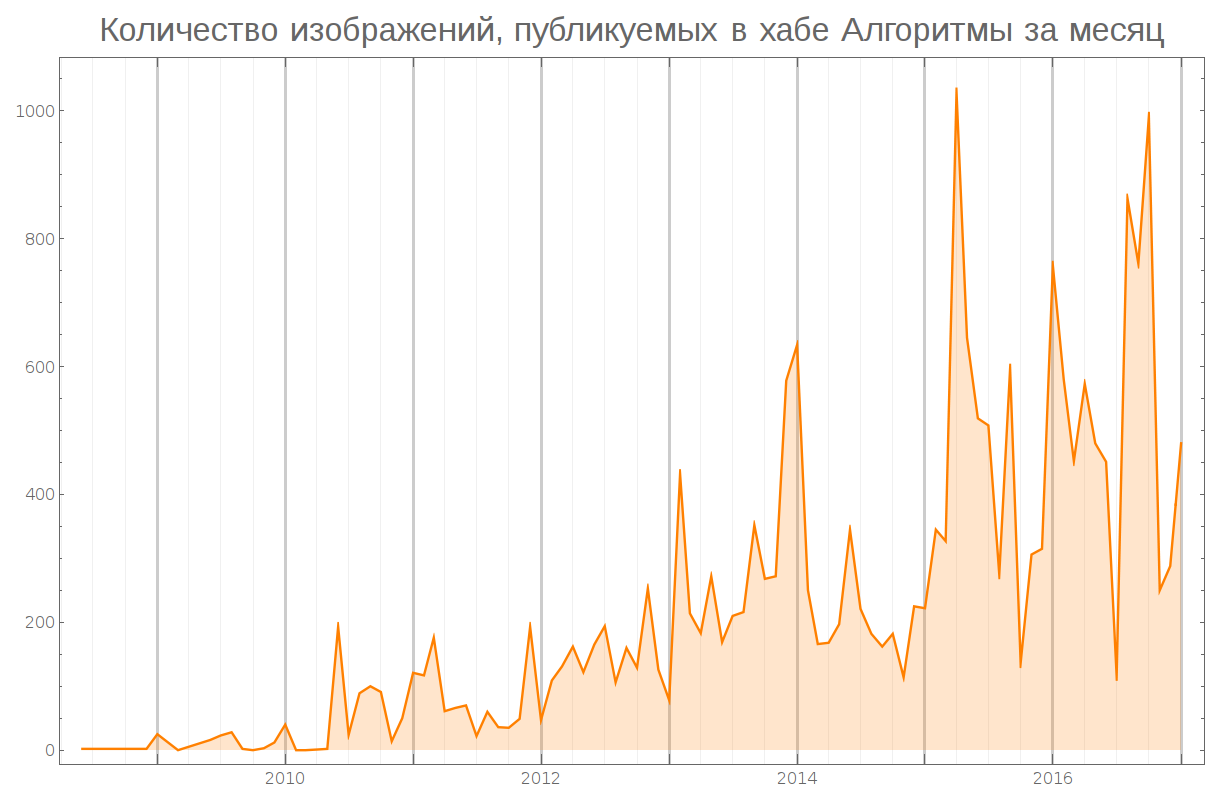
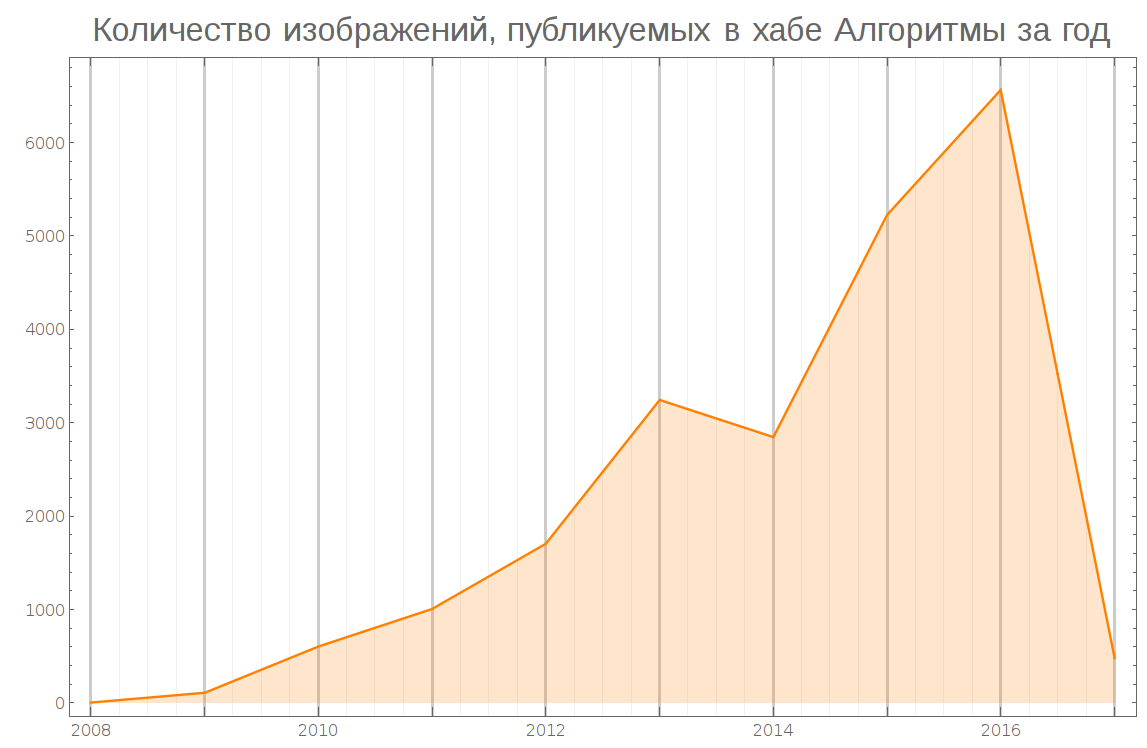
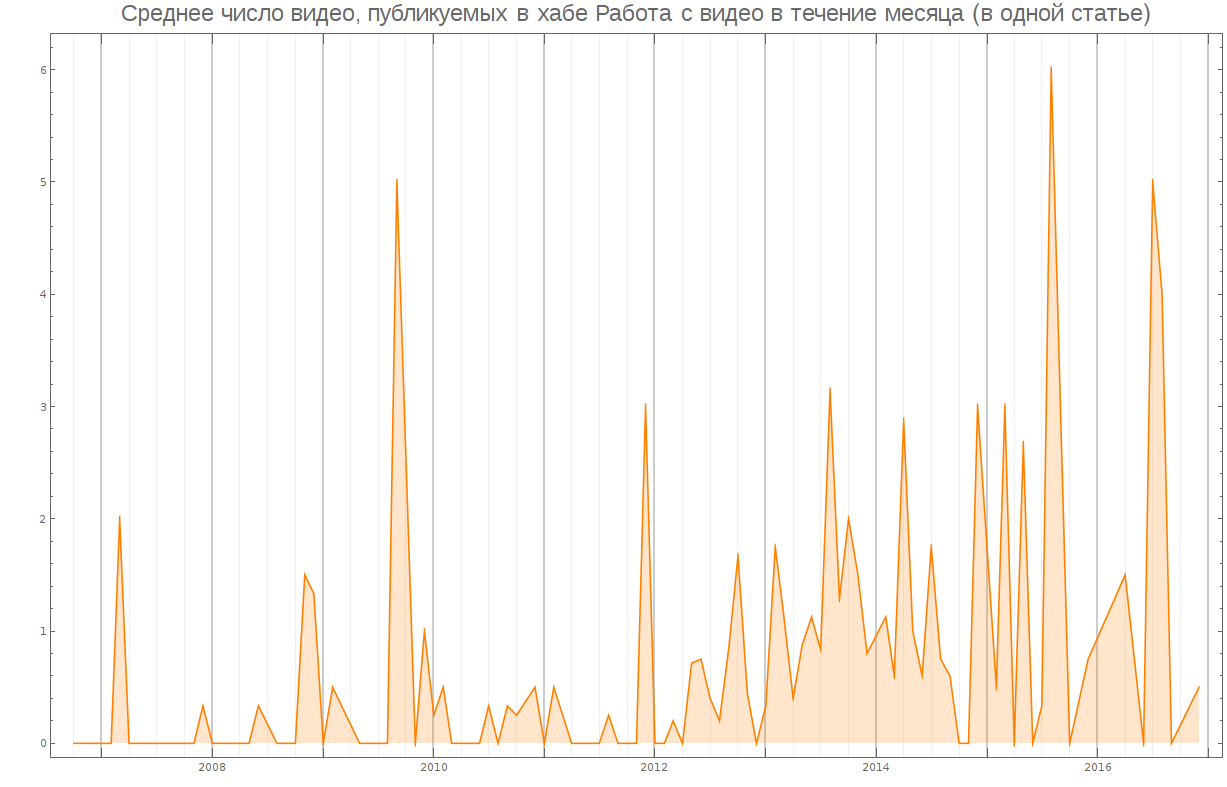
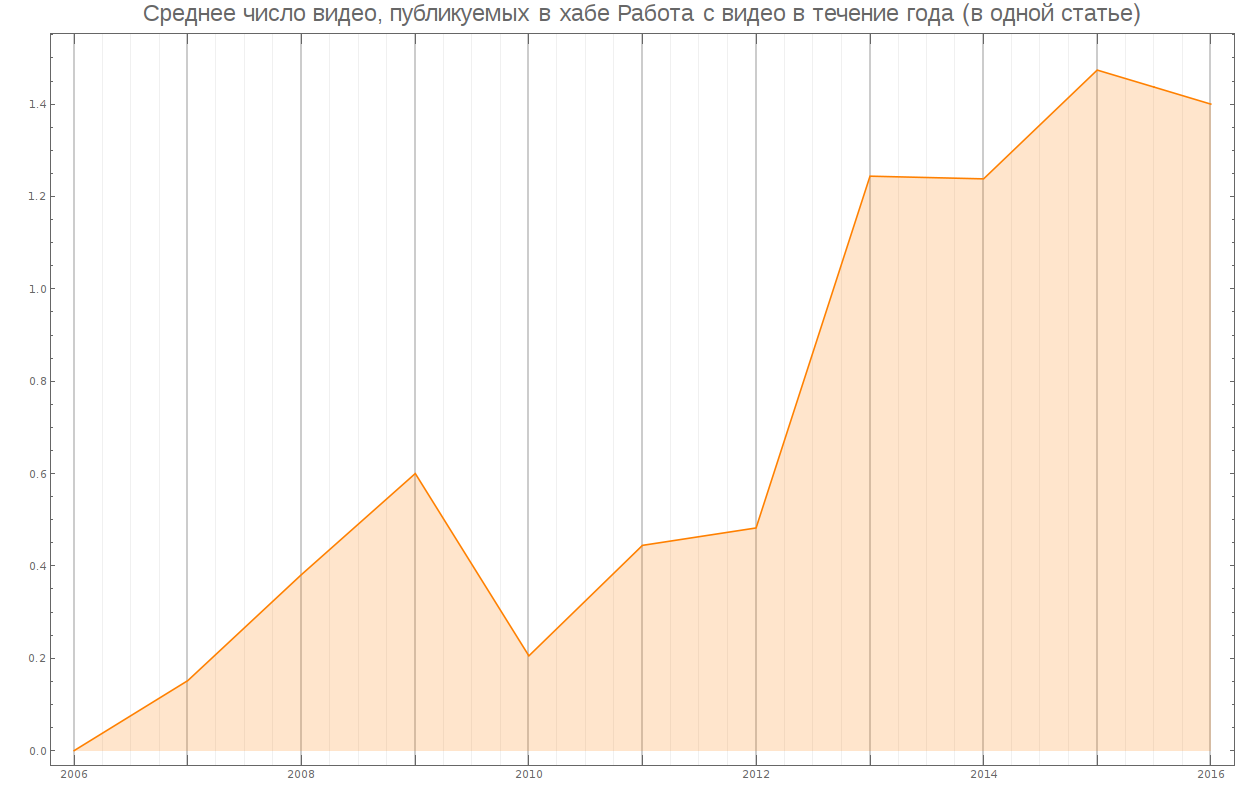
Number of images (video) used in posts depending on time

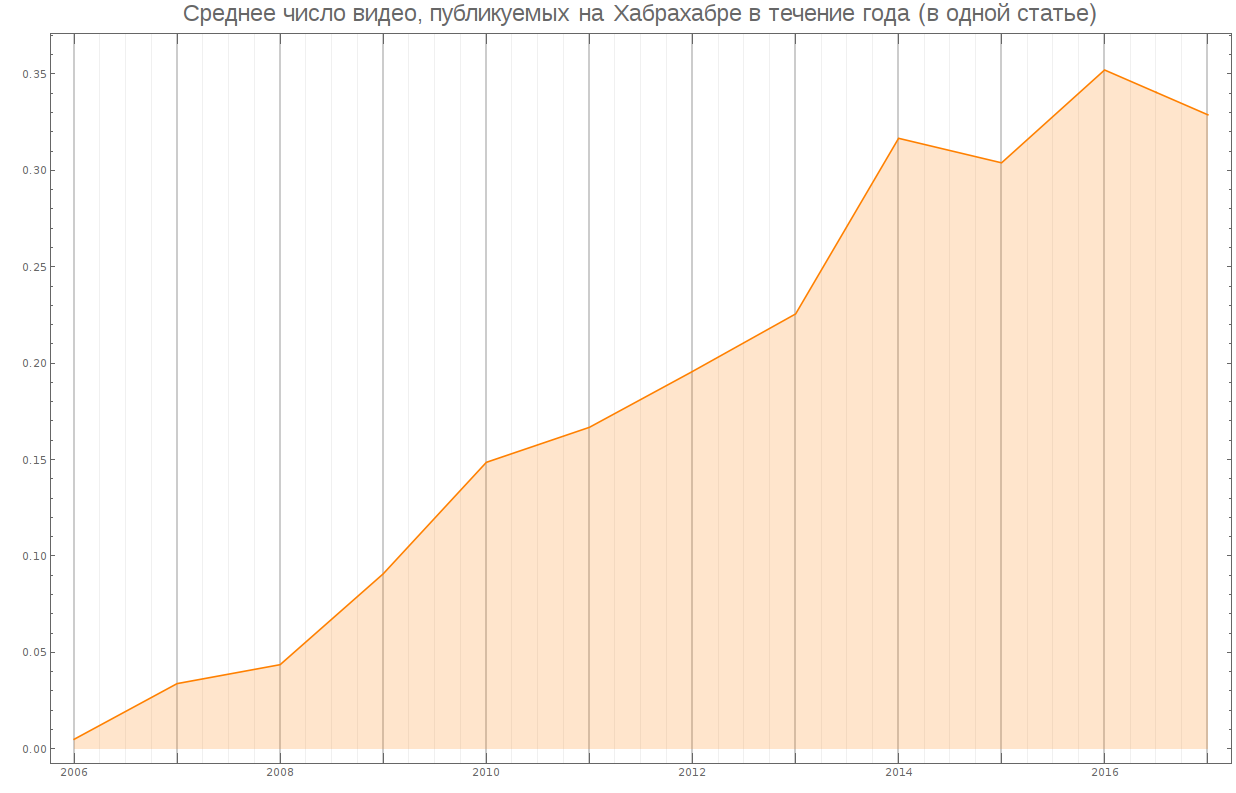
And in separate hubs:
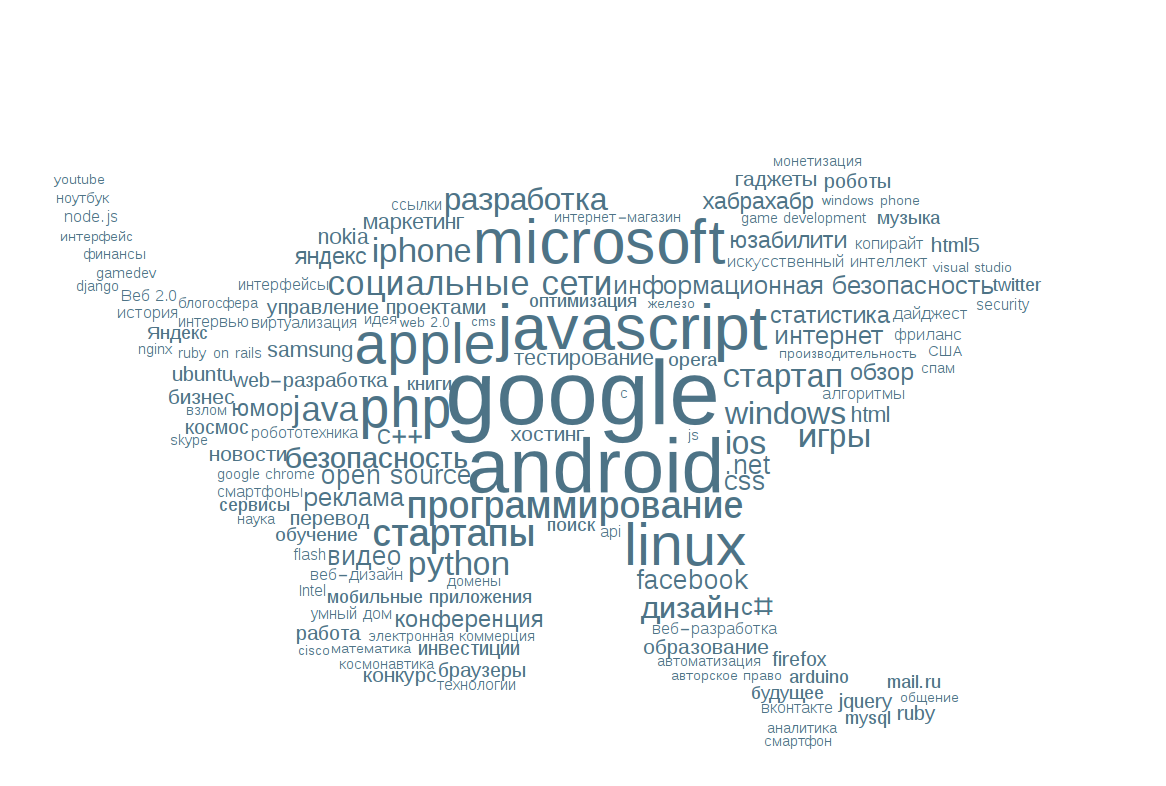
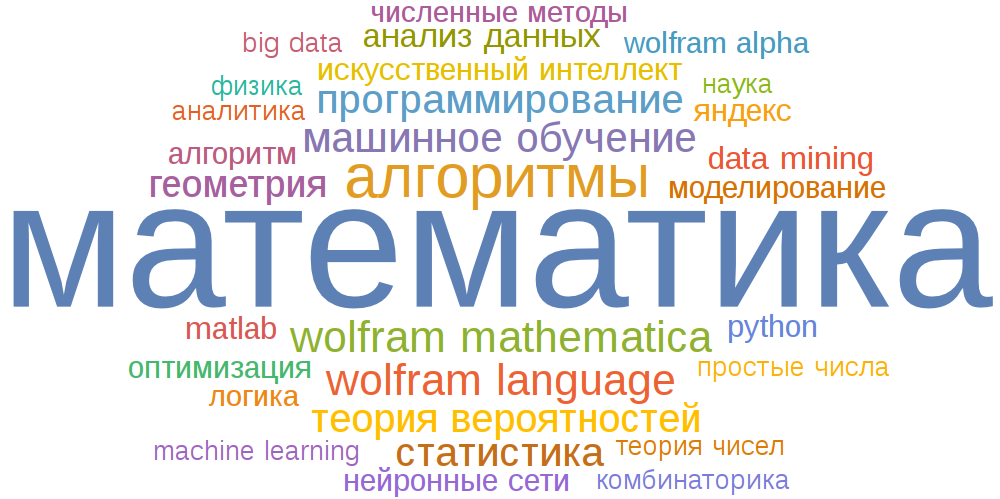
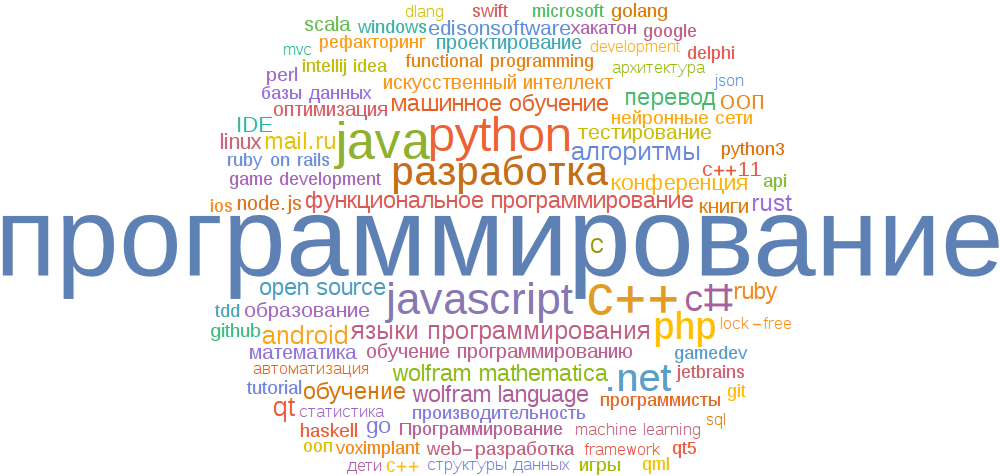
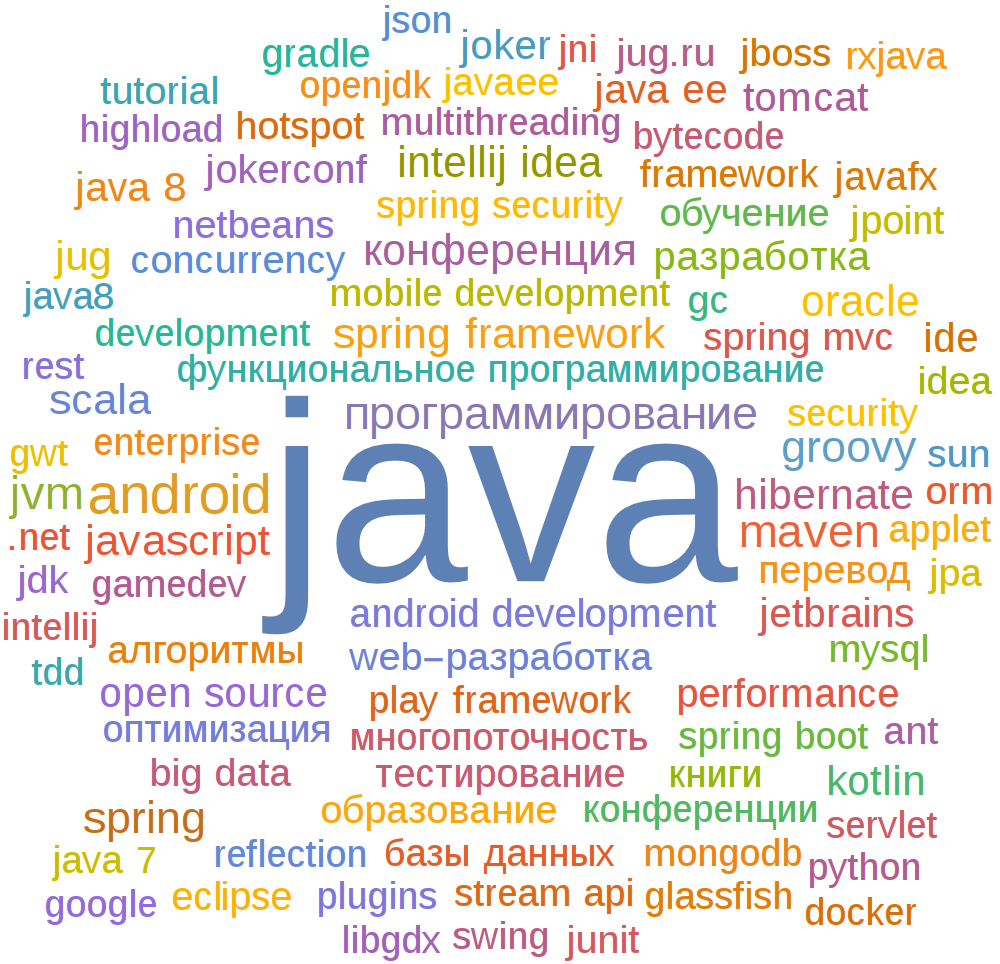
Clouds of keywords and individual hubs
Here, the WordCloud function, what value you pass to the WordOrientation attribute (Random, {- Pi / 4, Pi / 4}) drew everything by default:
Hub "Mathematics":
Hub "Programming":
Java Hub:
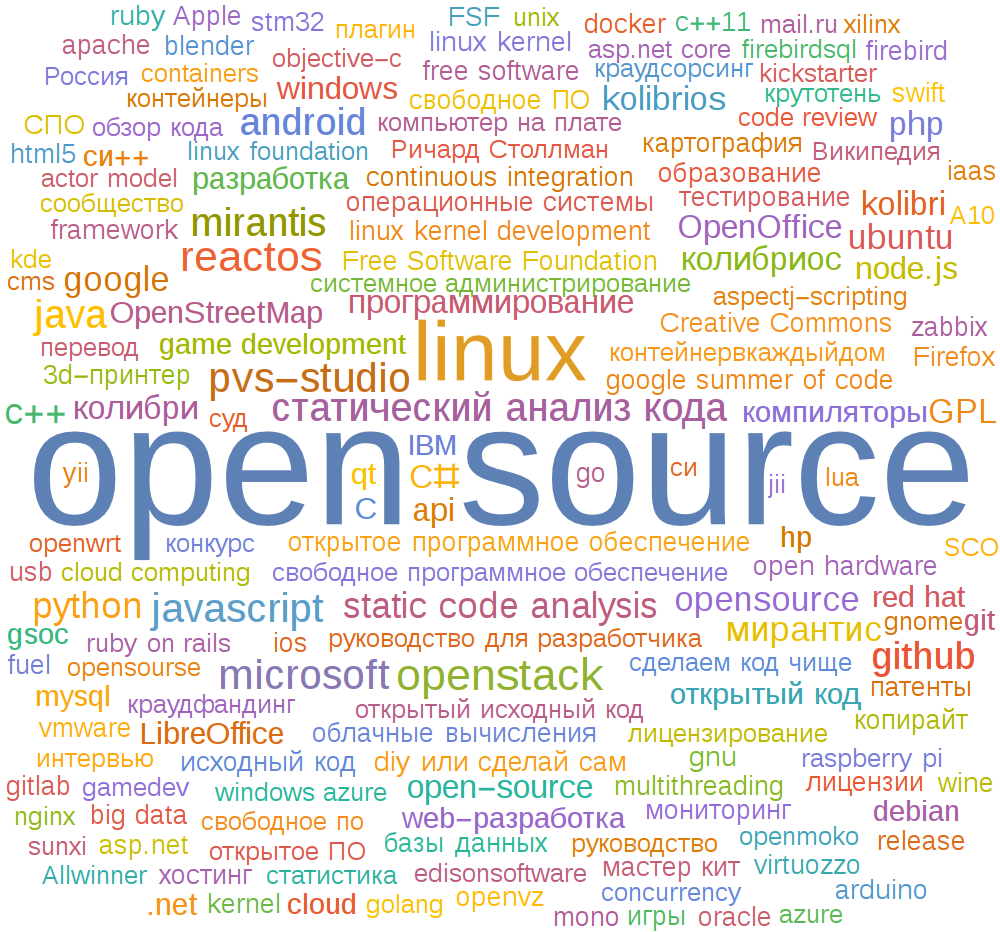
Open Source Hub:
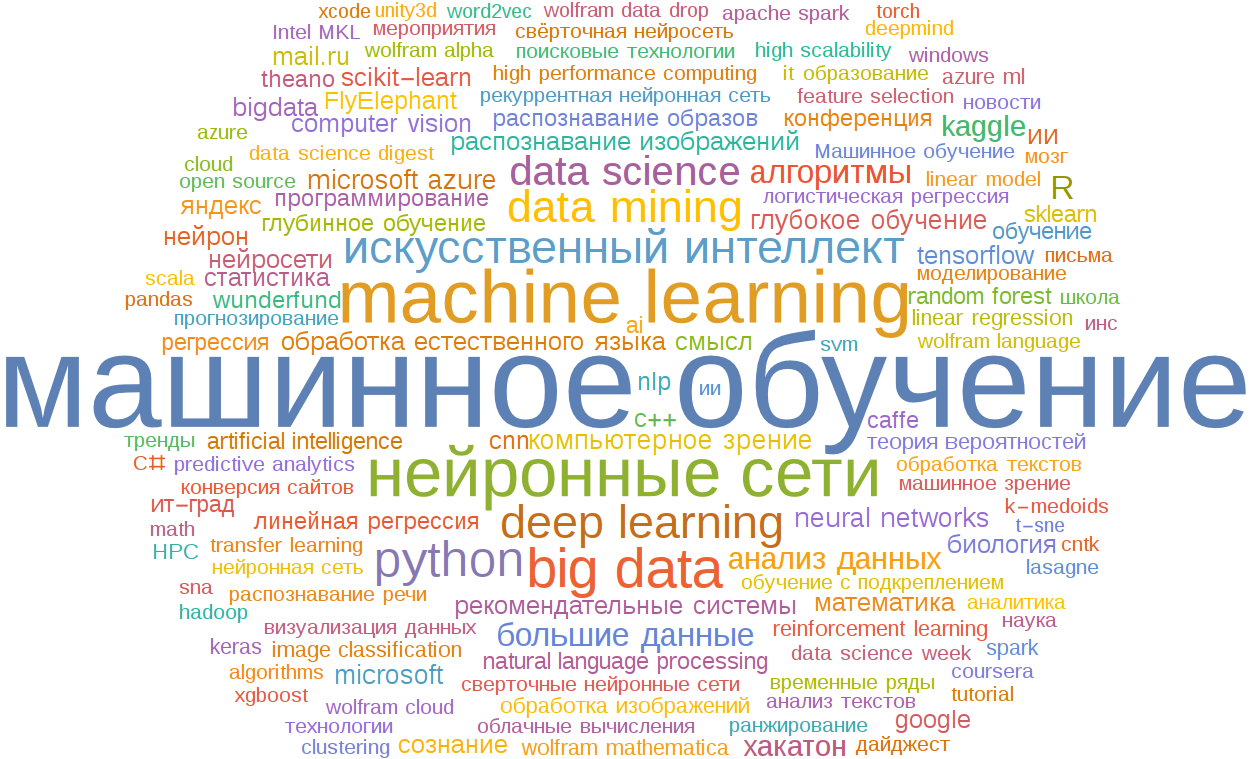
Hub "Machine Learning":
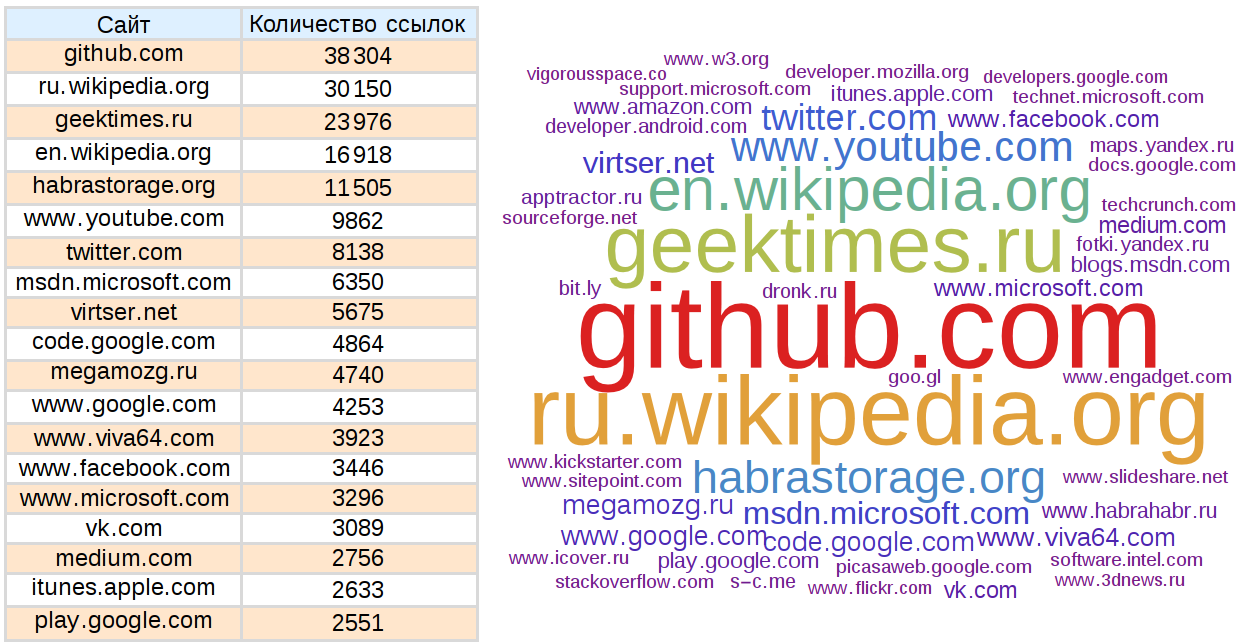
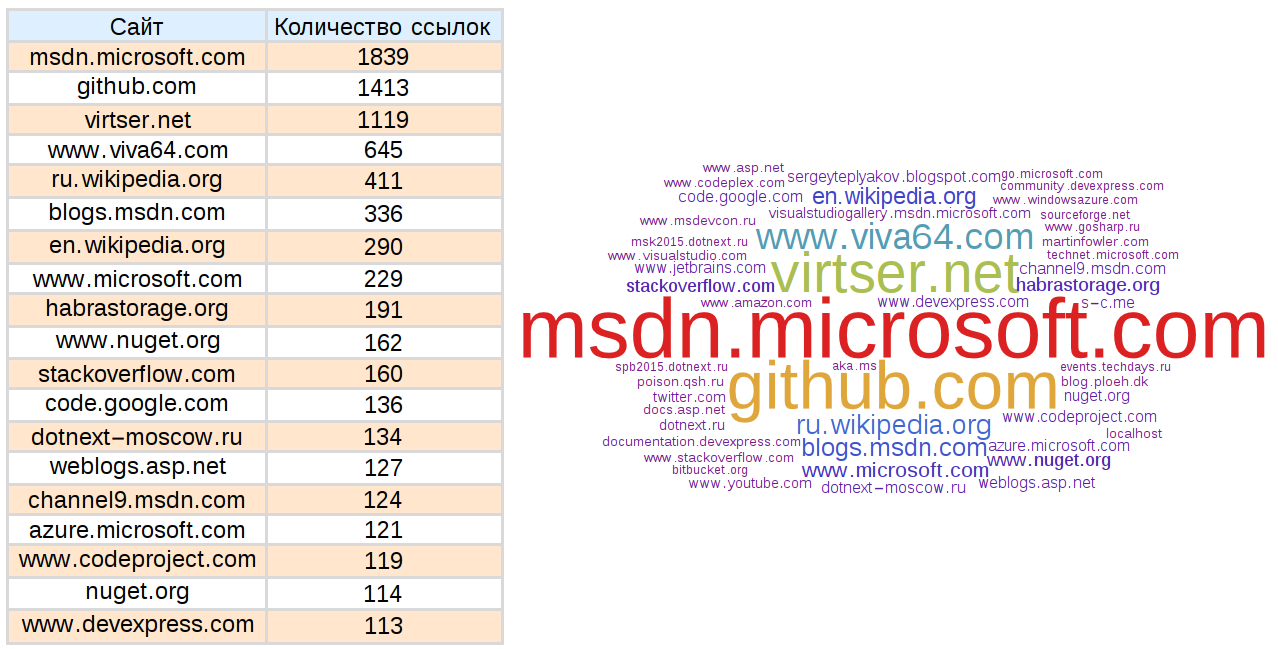
Sites referenced in articles

We remove Habrahabr as a source of links:
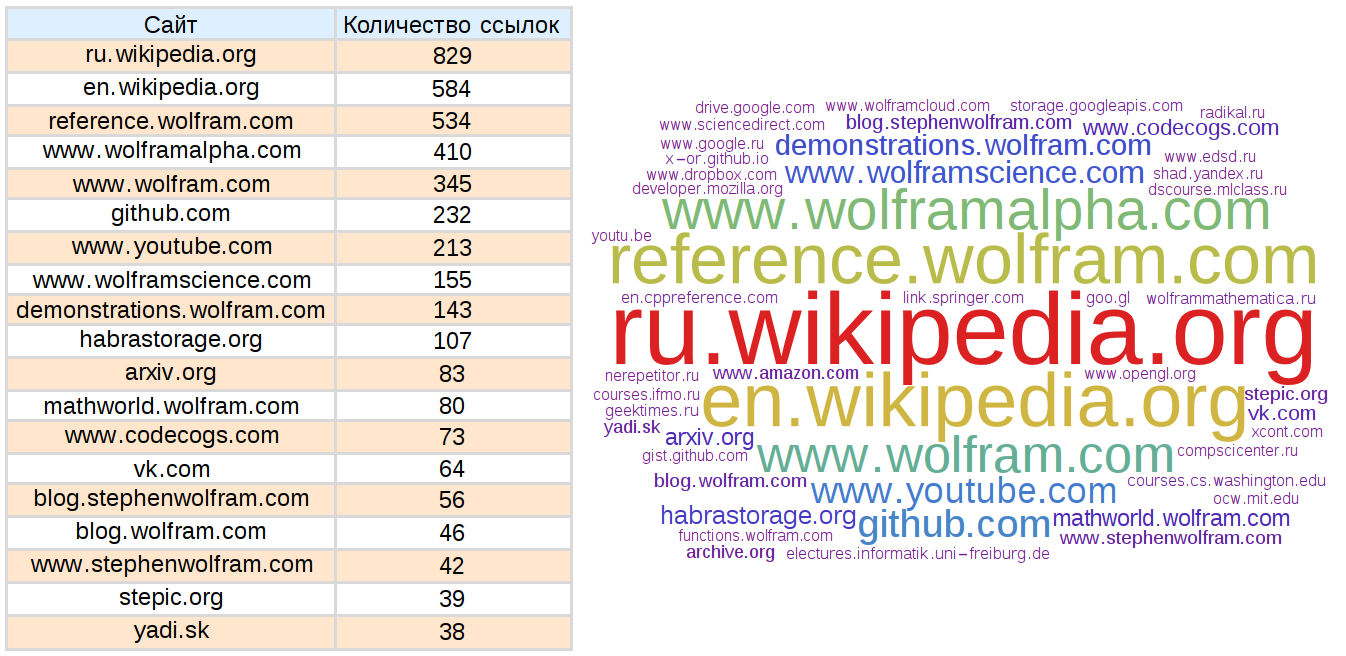
In the "Mathematics" hub (without Habrahabr as a source of links):
Hub "Development for iOS":

Hub ".NET":
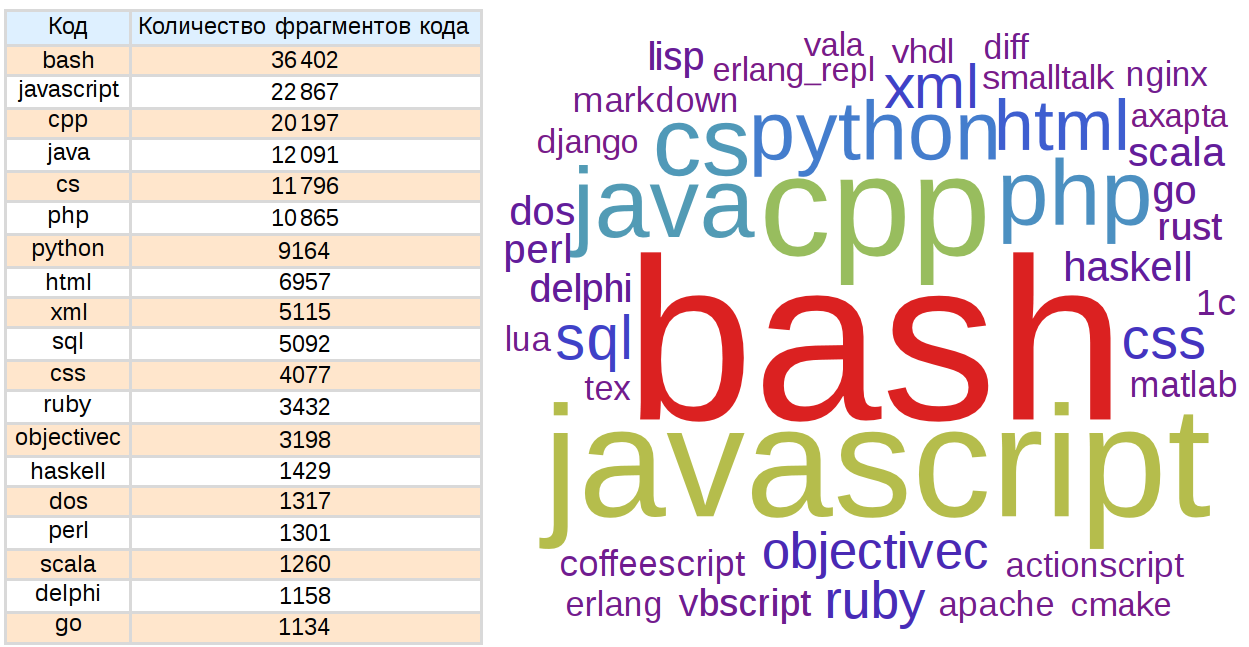
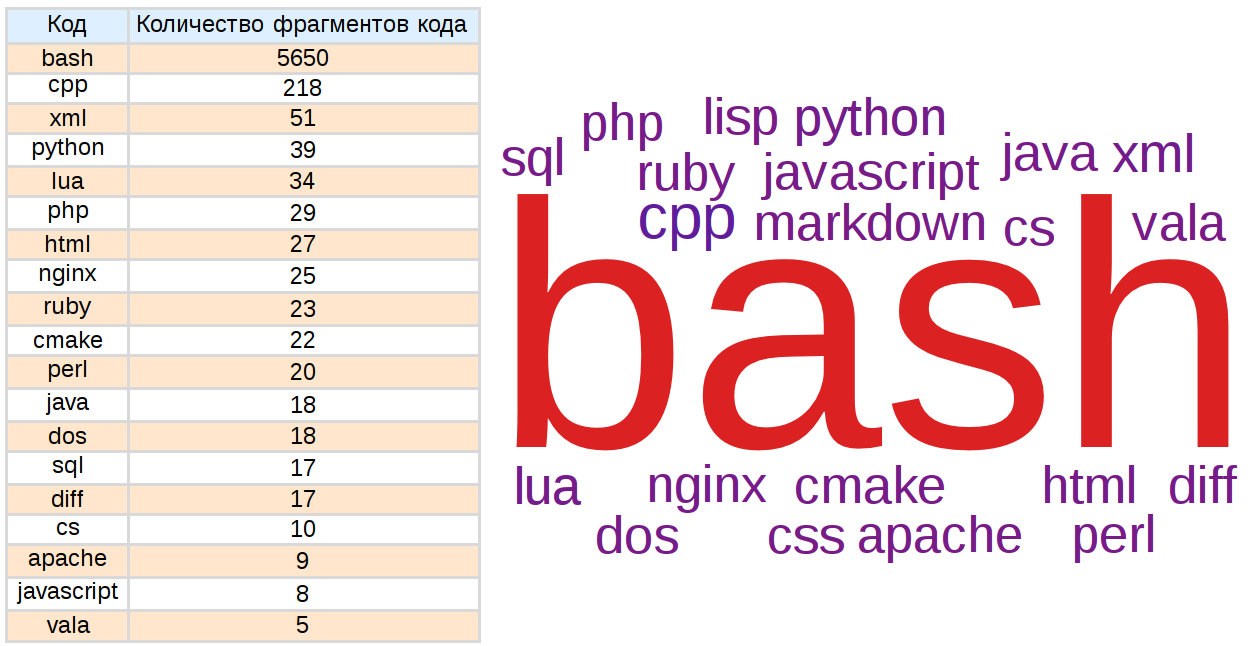
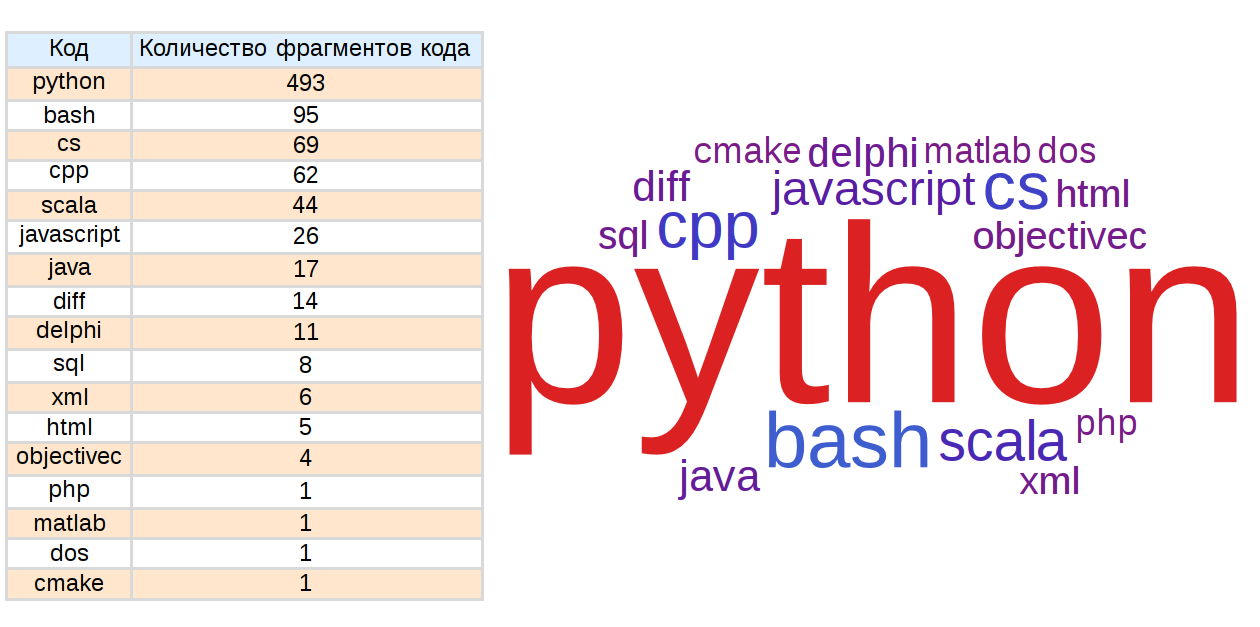
Codes that lead in articles
Without SomeCode (if no programming language is specified):
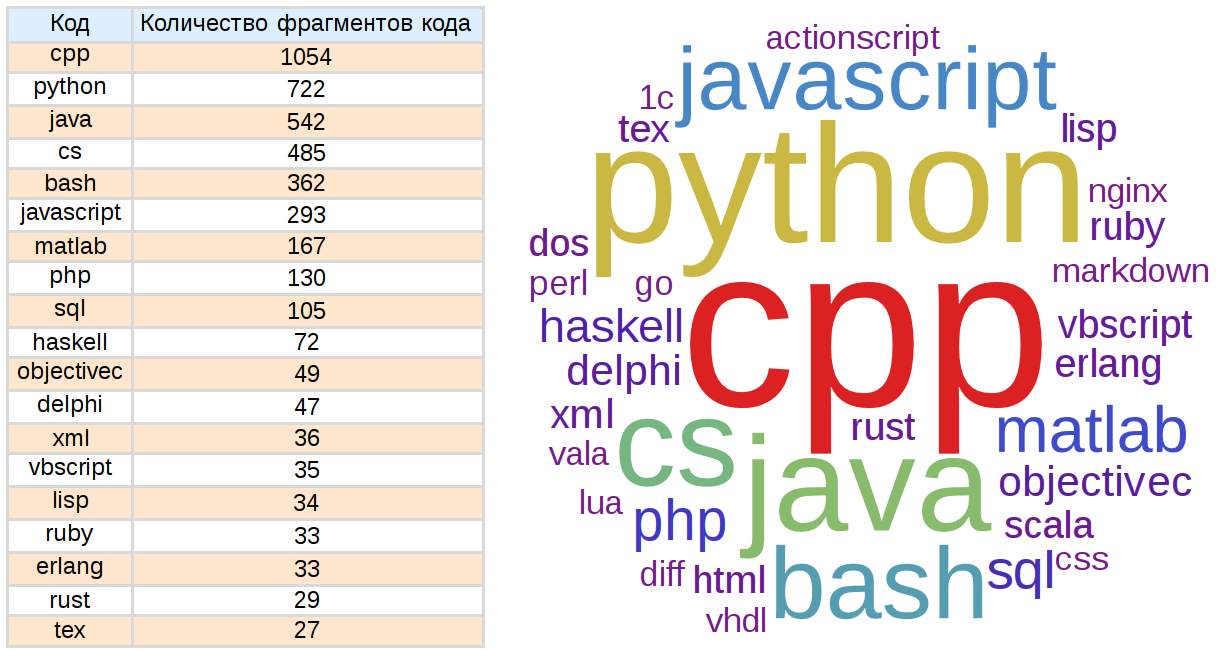
In the hub "Algorithms":
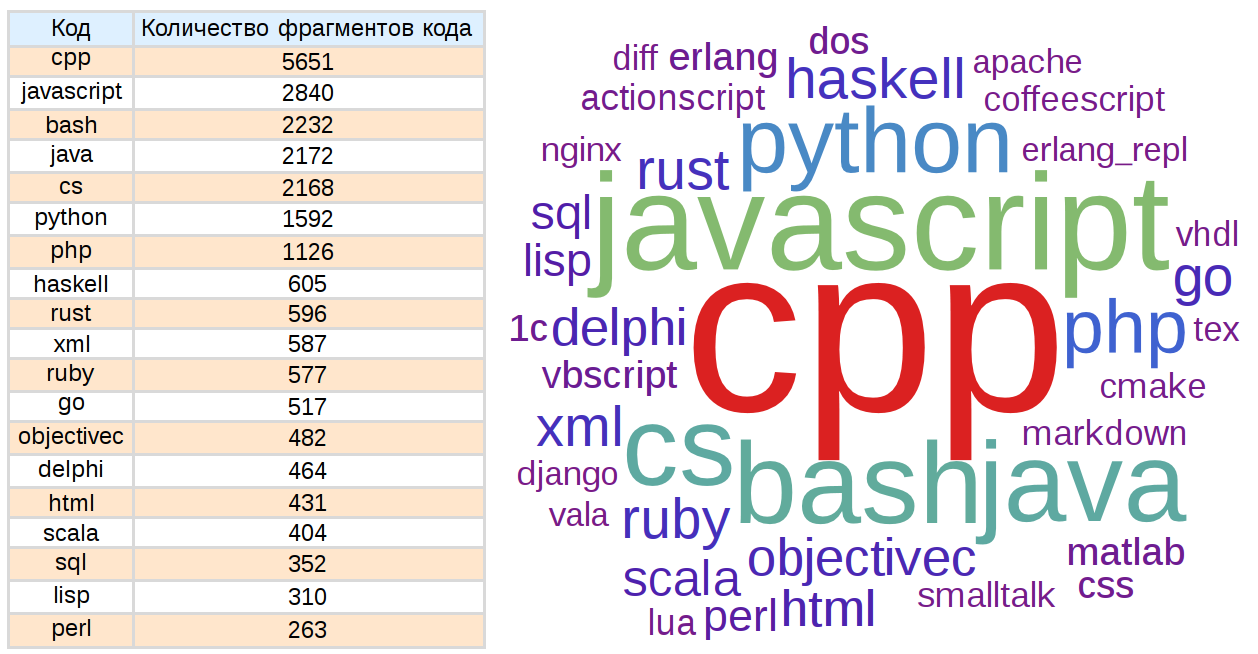
In the hub "Programming":
In the Linux Setup hub:
In the hub "Machine learning":
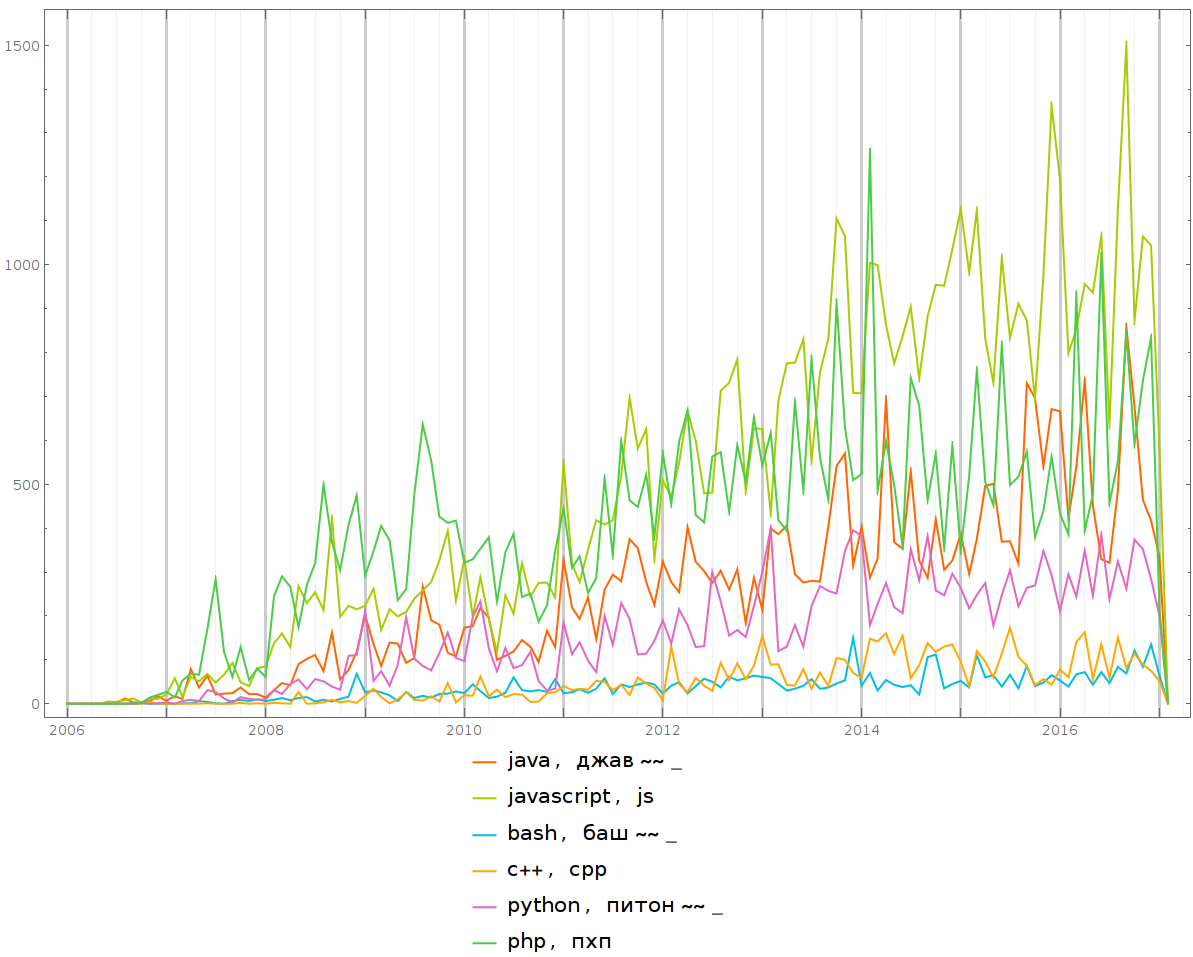
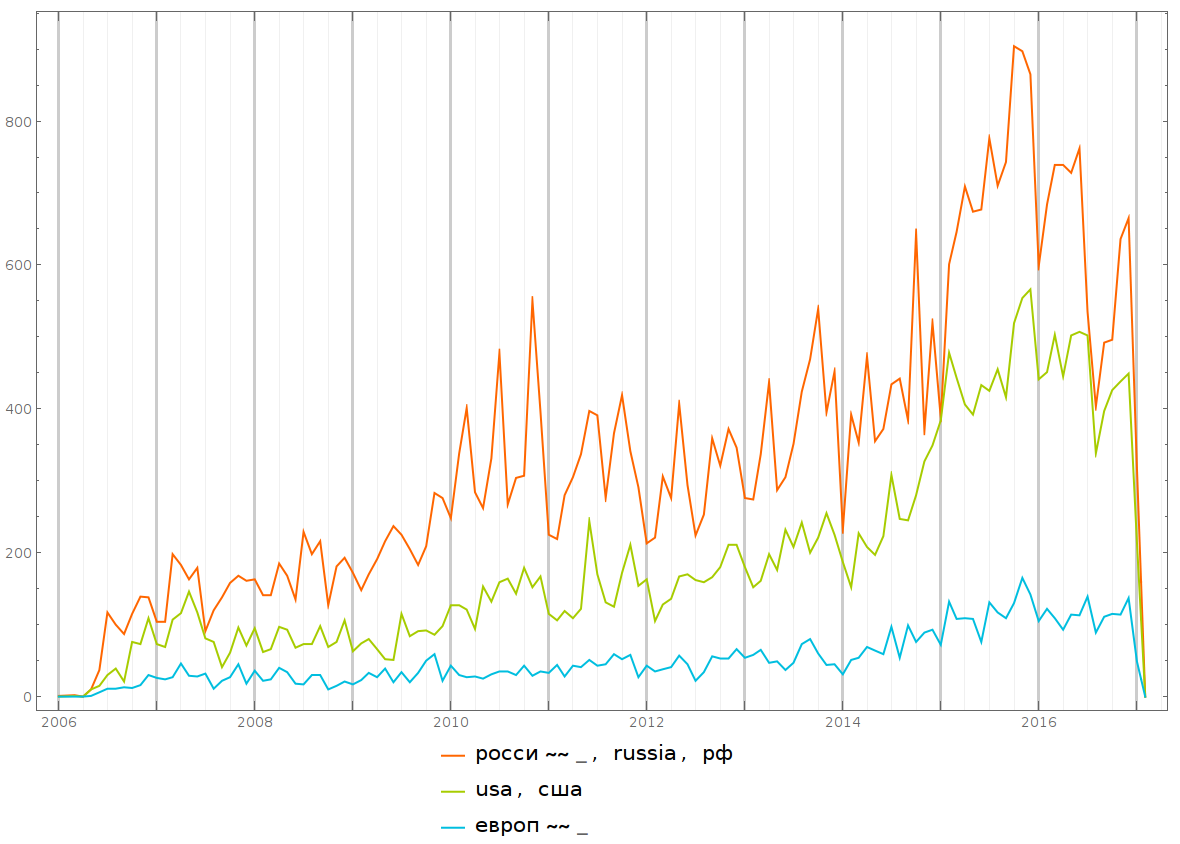
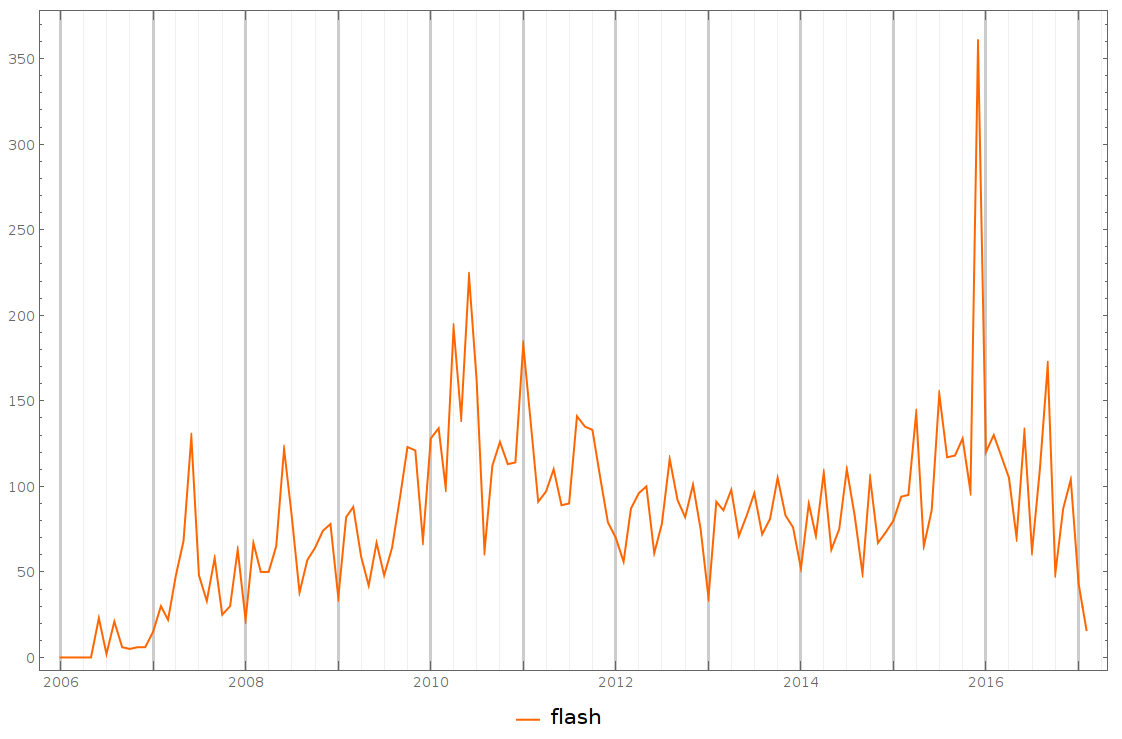
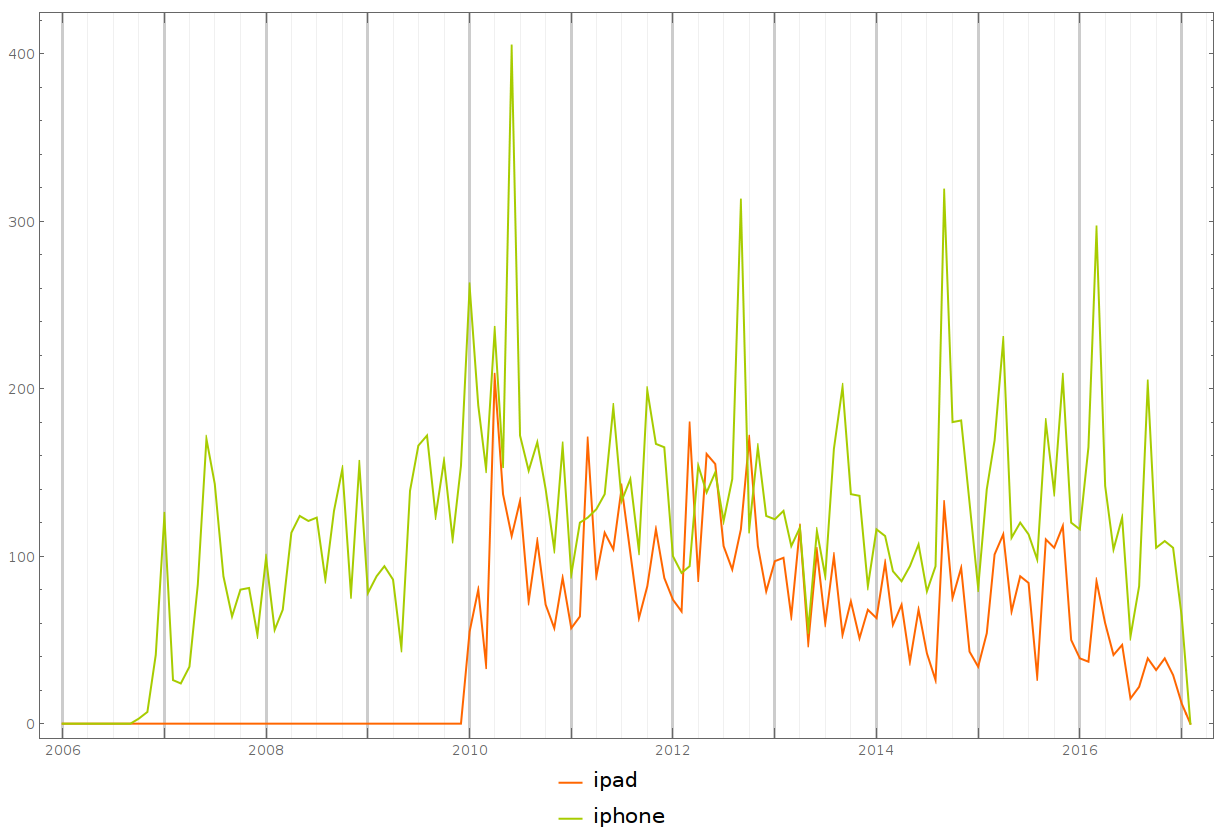
Word frequency
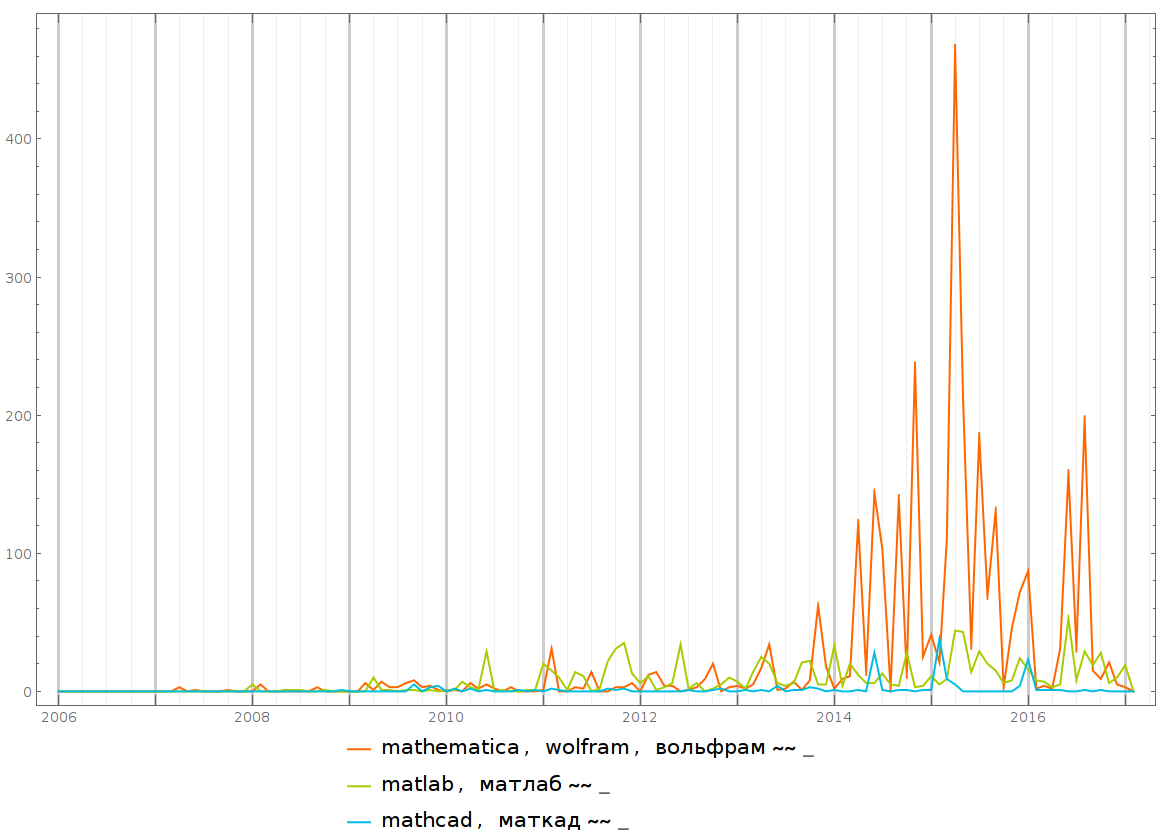
In the iOS Development hub
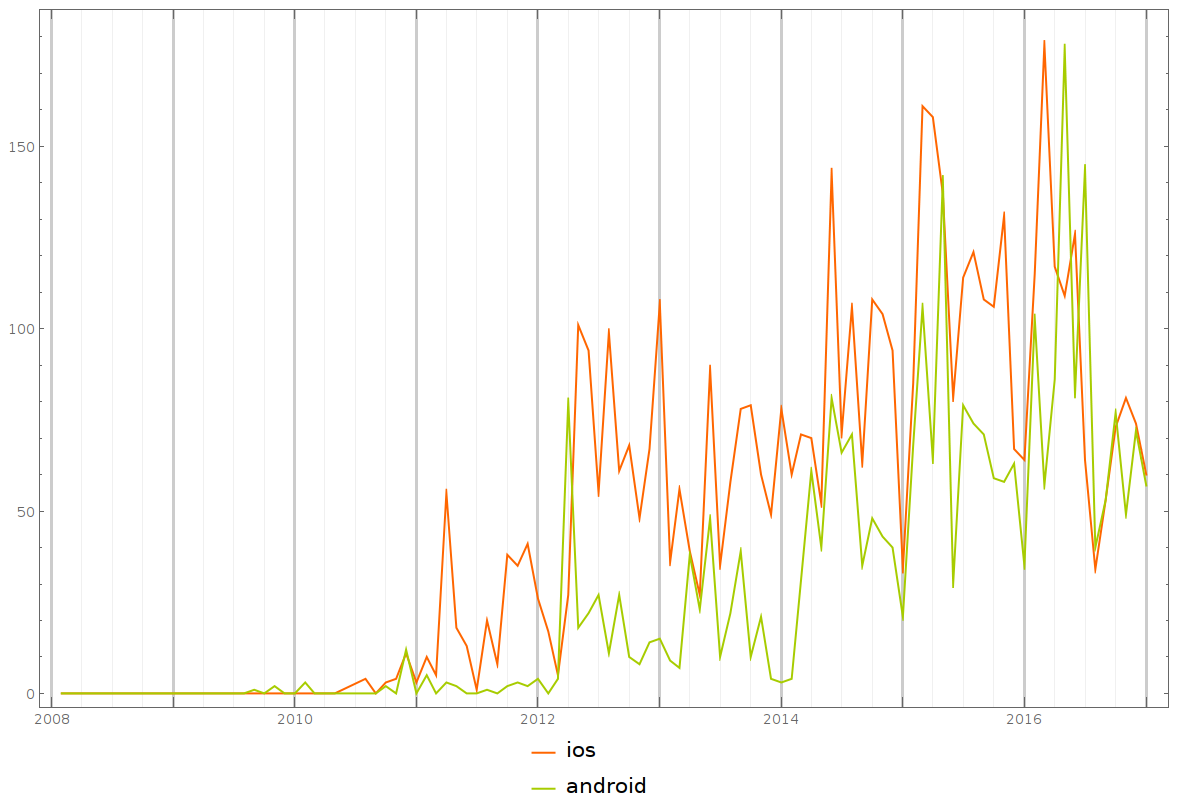
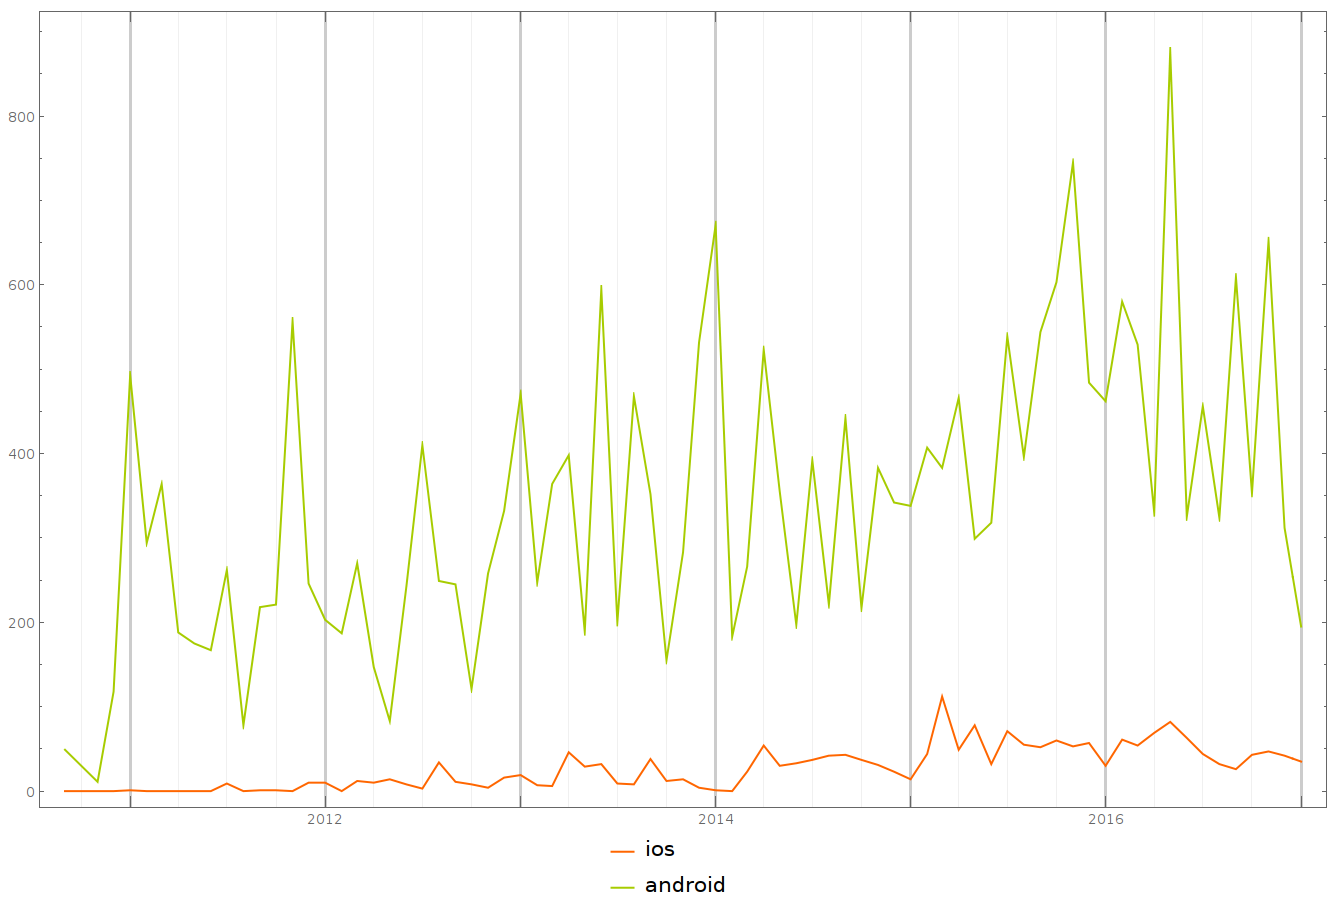
In the hub "Development for Android":
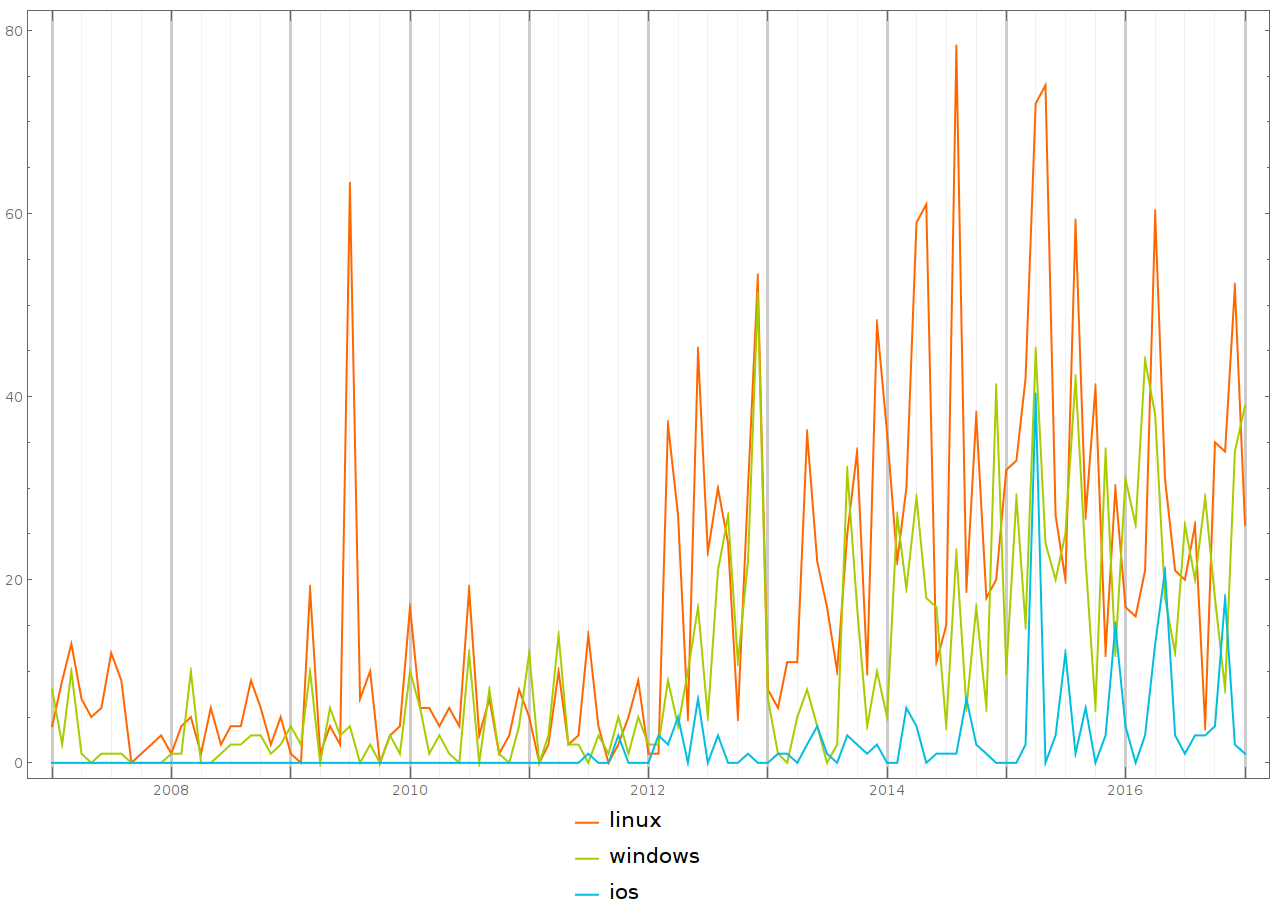
The frequency of use of the names of operating systems in the hub "Open source":
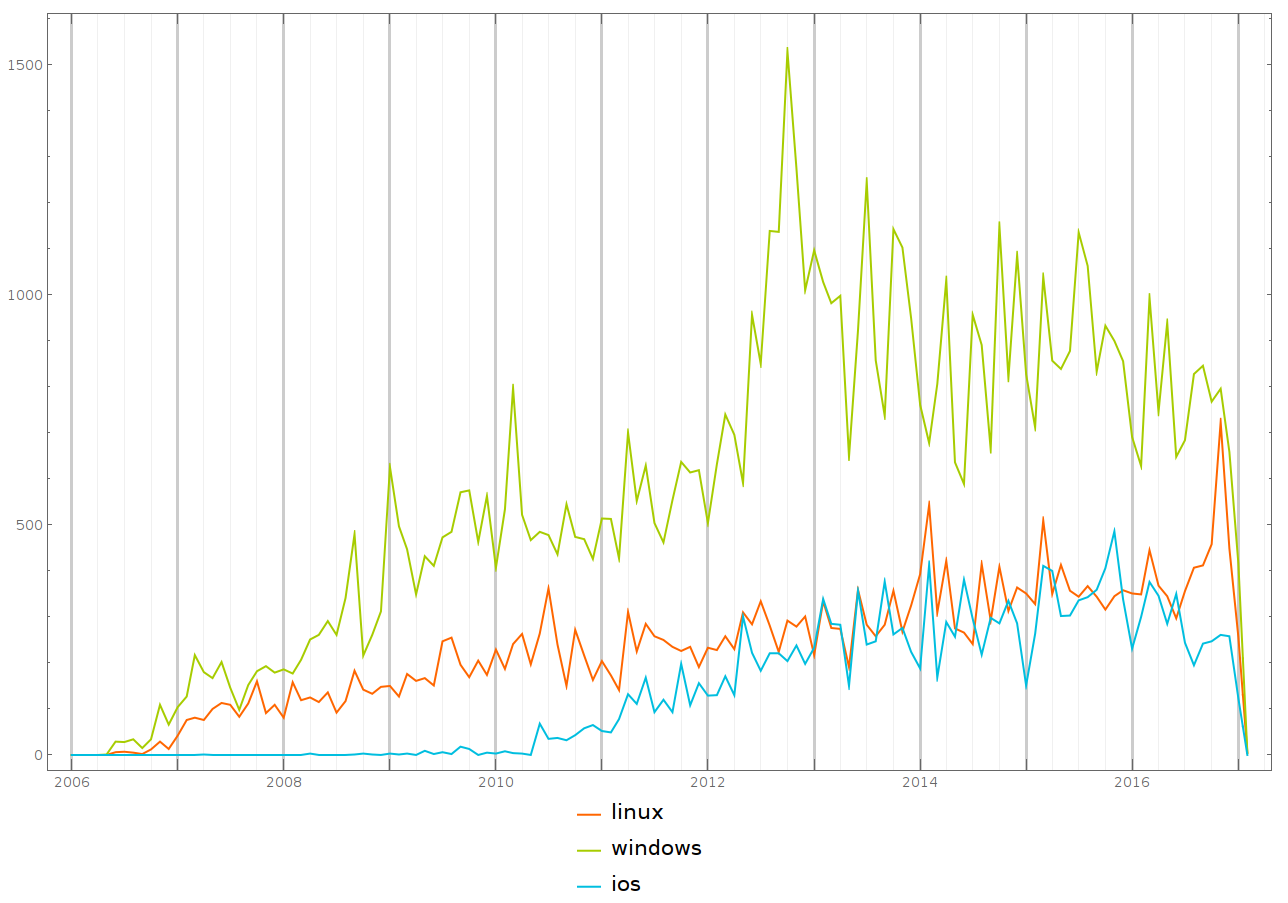
And on Habrahabr / Geektimes:
Rating and number of views of posts, as well as the probability of reaching their specific values
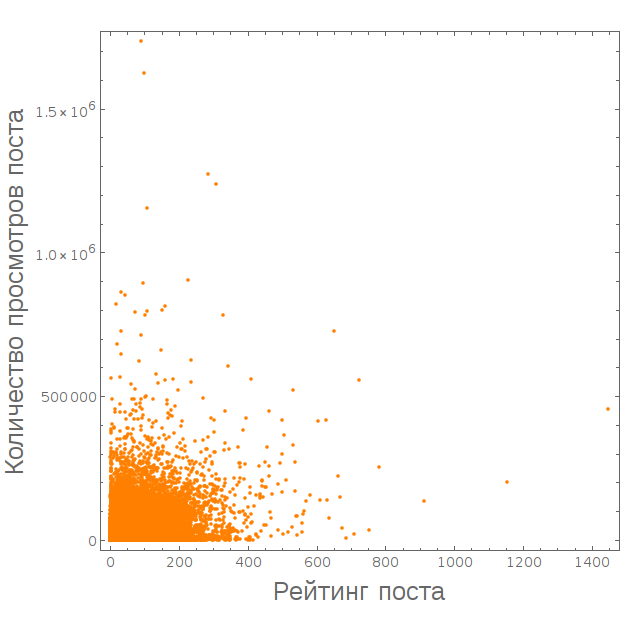


The average post rating at Habrahabr is 25.6067, and the average number of views is 13487.2.
Mathematical expectation: {25.6067, 13487.2}
Standard deviation: {35.9361, 28783.9}
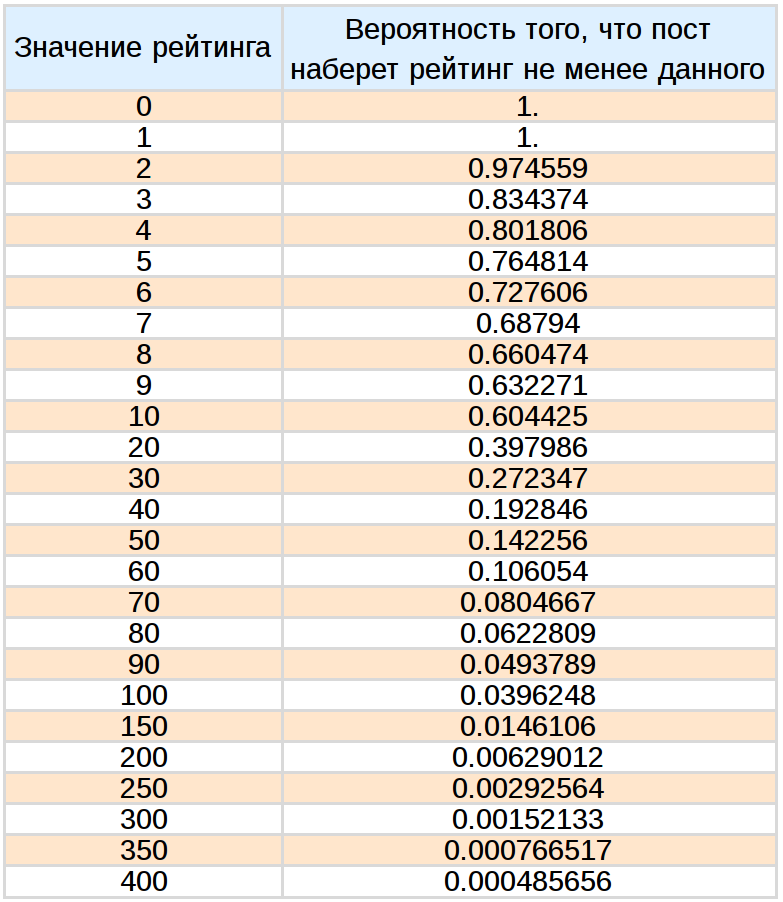
The probability that the post will score a certain rating:
The probability that the post will get a certain number of views:

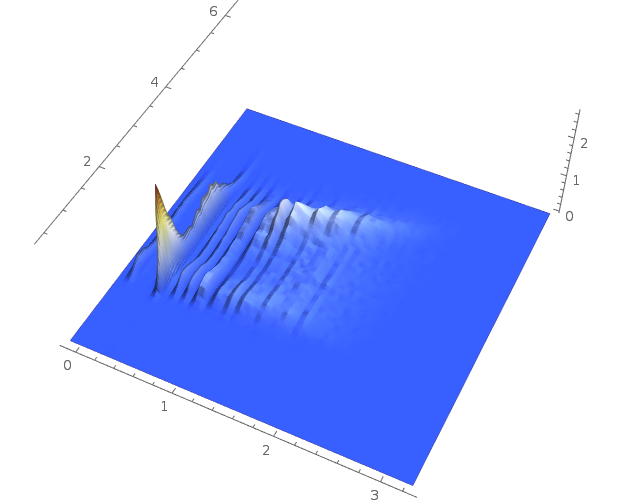
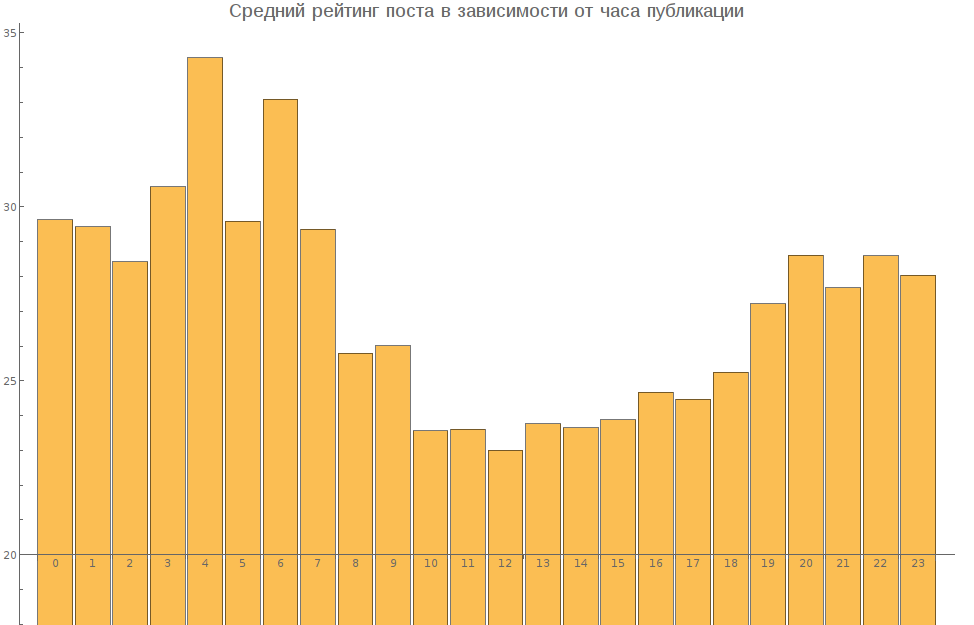
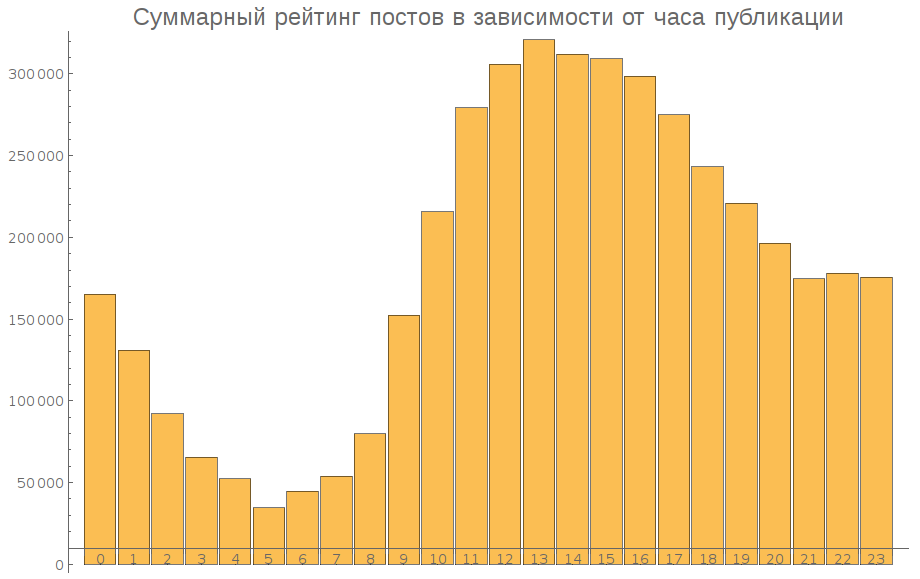
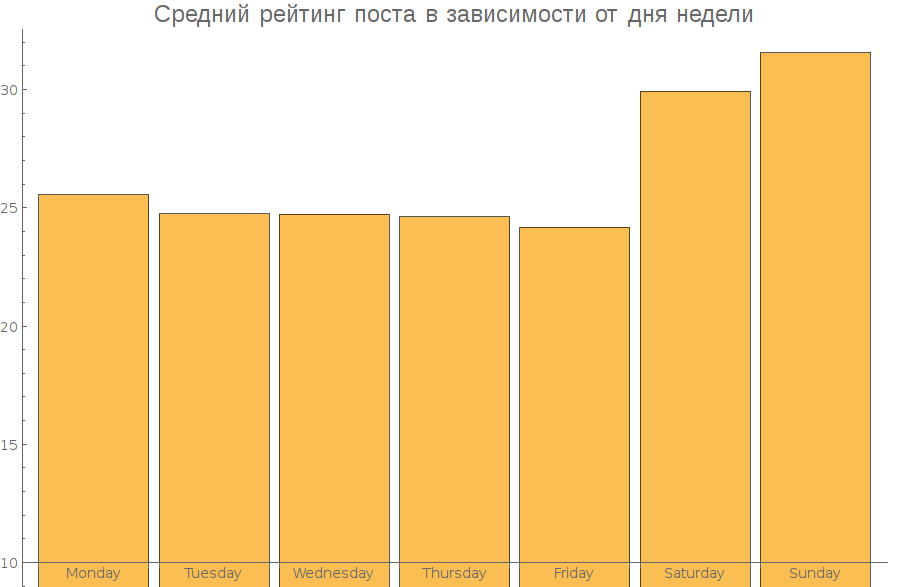
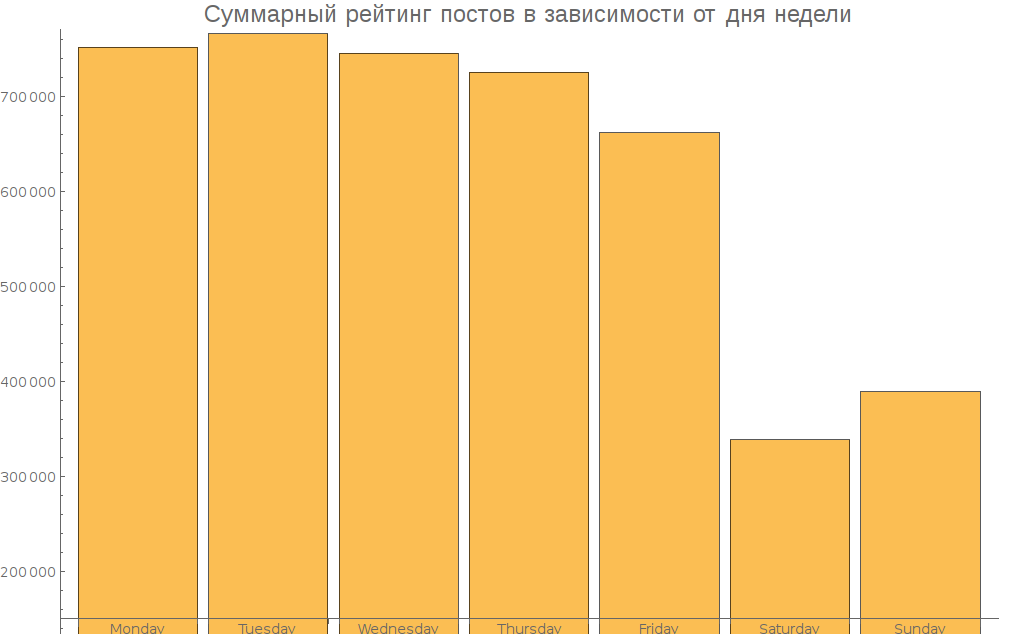
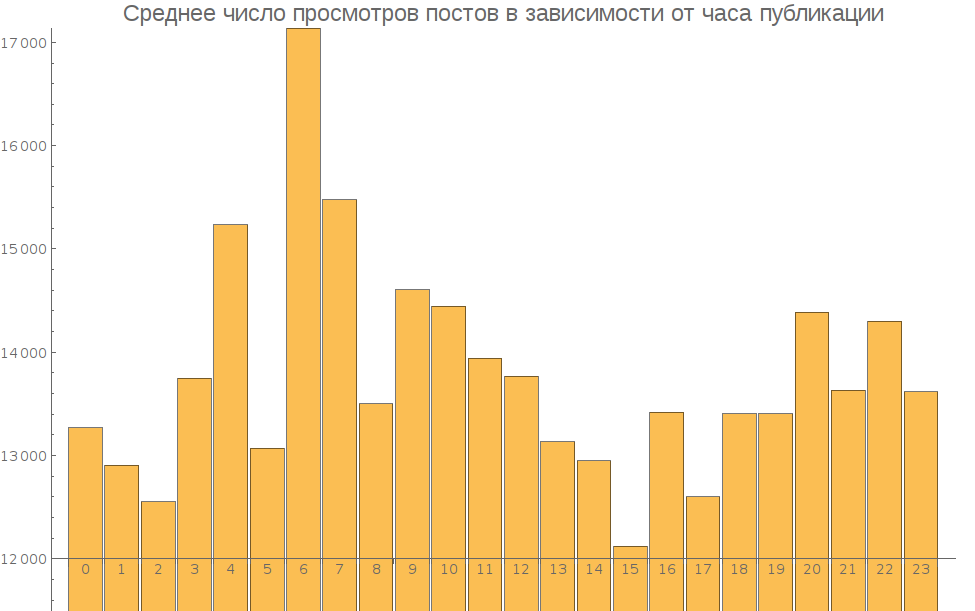
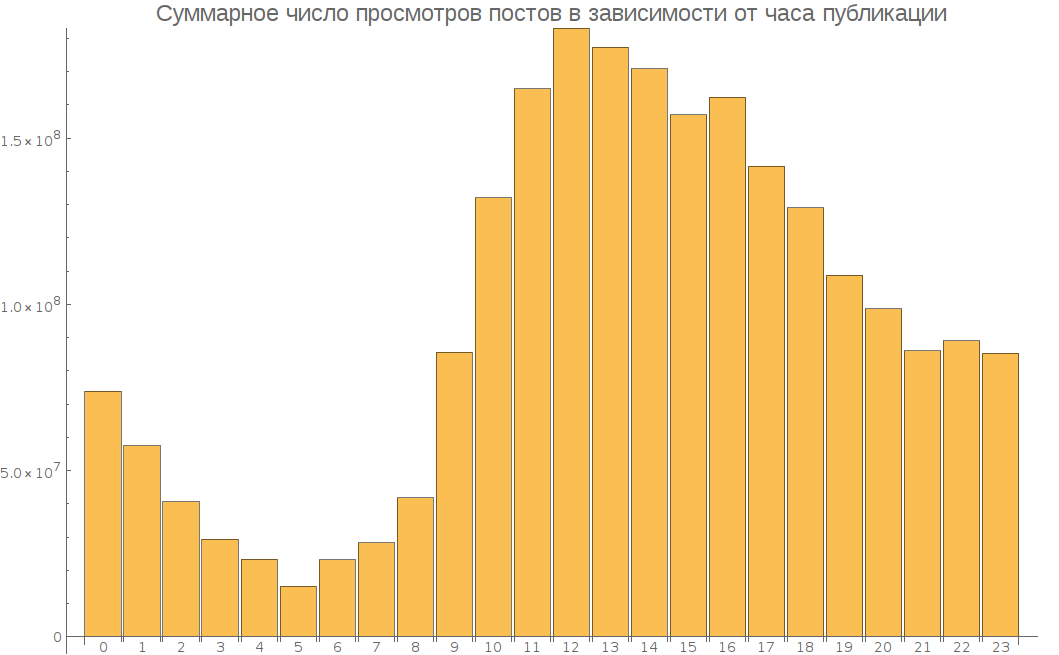
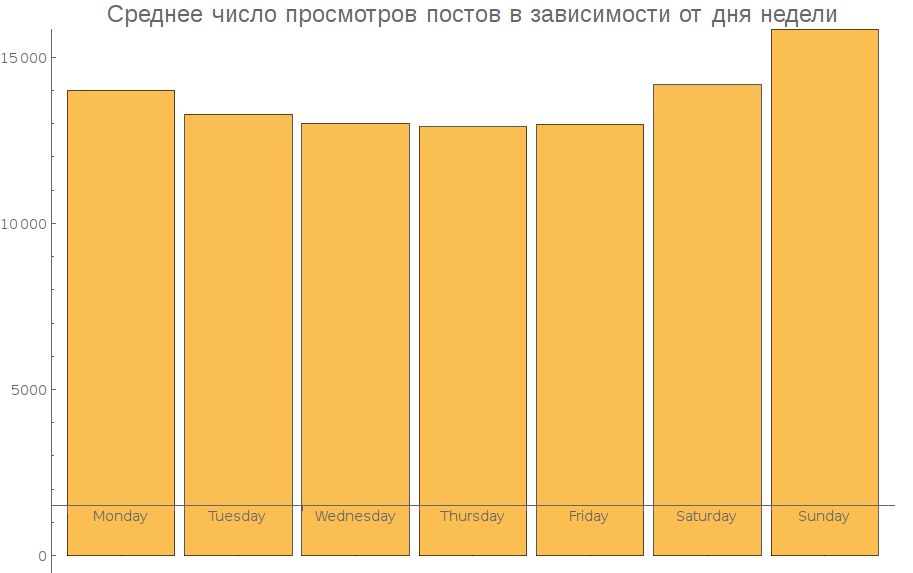
The dependence of the rating and the number of post views from the time of publication


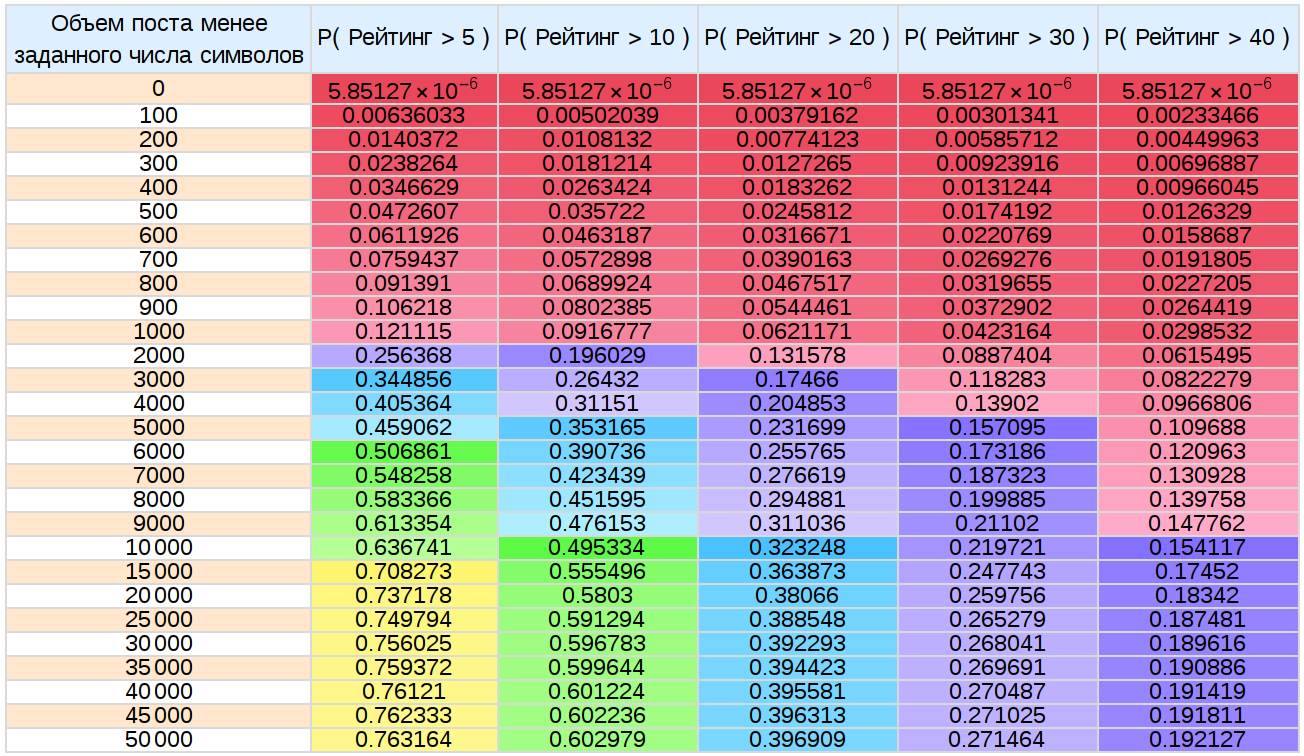
Dependence rating post from its volume

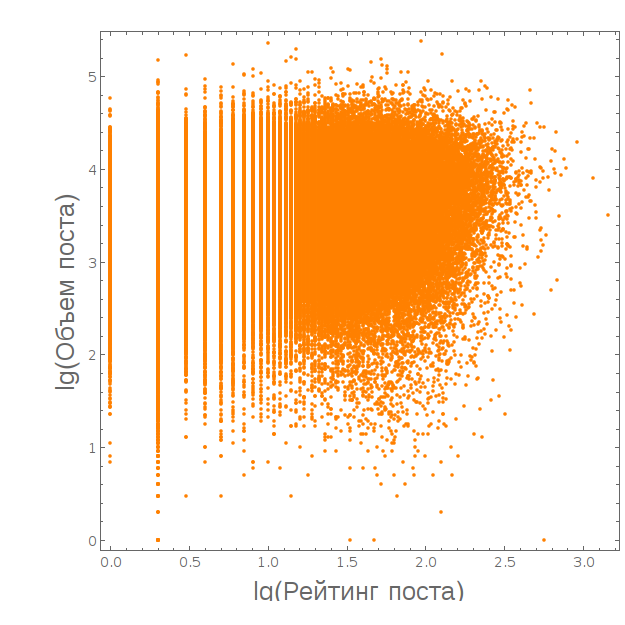


The average volume of a post on Habrahabr is 5199 characters.
The probability that a post with a volume not exceeding a specified number of characters will gain a rating not less than the specified one:
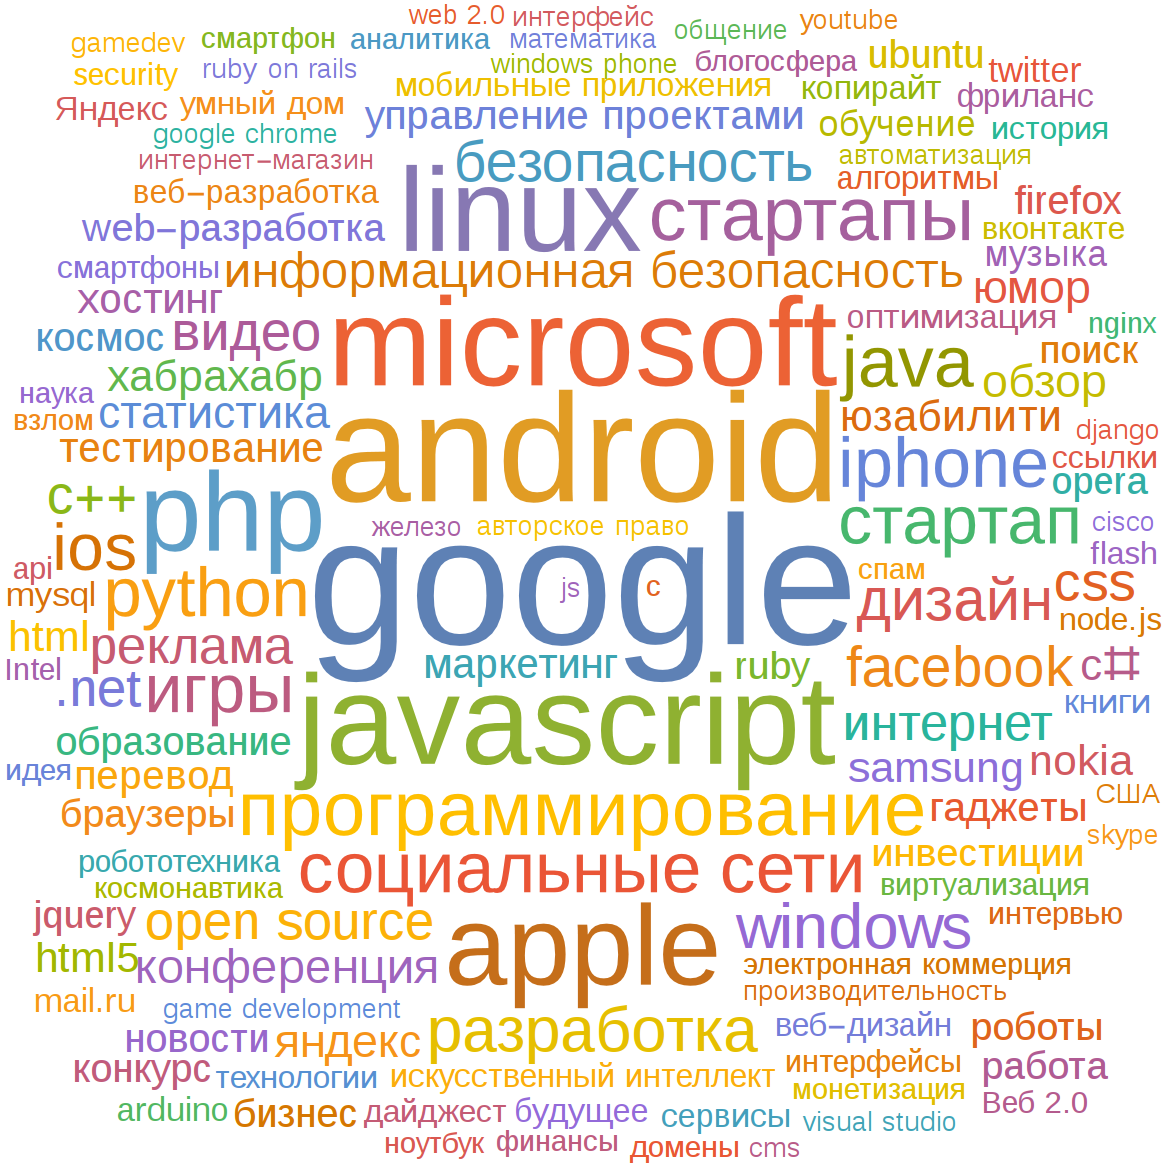
By the way about the frequency of words. Before using Wolfram in Jupyter Notebook using the pymorphy2 libraries, nltk built word clouds over the years, but for fewer articles. I took the 50 most frequent words in the article (excluding the stop words), and then combined the dictionaries in all the articles for a certain year. Clouds built in Tagul. KDPV is a word cloud for 2006. For 2016:

Posts with the maximum number
Images: " Review of mail clients for Android, or how I chose the mailer "
Comments: " How to distribute invites on Google+ "
Rating: " Making a private monitor from an old LCD monitor "
Number of tags: " Information and technological tools for the practical survival of social communities in the face of the Internet shutdown in 2014 "
Views: " Hack Wi-Fi in ... 3 seconds "
Number of videos: " DUMP-2016: video of all reports in one post. Free. Without SMS "
Number of references: " Pseudoscience and scam artists. Fake scientific journals "
Text: " Creating a Flappy Bird - Zombie Bird Clone "
Source: https://habr.com/ru/post/321206/
All Articles