Static analyzers for Swift and Objective-C
Foreword
There are a large number of articles devoted to static analyzers for C / C ++ / C #, Java, etc. With regard to research on the use of various static analyzers for native development for MacOS / iOS, they are paid much less attention.
An analysis of the application of static code analyzers used in various projects on ObjC and Swift is proposed. At the same time, this is not a review, but rather some notes on the use of various tools that allow one to find errors of one kind or another in code, ranging from memory leaks and ending with the search for vulnerabilities. However, the data do not claim objectivity and completeness of the findings, as well as the depth of analysis of the results obtained for each instrument.
Introduction
A few years ago, while still a novice iOS developer, I was faced with the problem of verifying the quality of code written in ObjC for an iOS application. Unfortunately, it was not always possible to find errors and discuss the code with more qualified colleagues for lack of such. Although the first negative reviews were perceived constructively, they nevertheless led to the loss of customers who wanted to evaluate examples of developer code before concluding a contract. As a result, there was a need to use tools that reveal the maximum code defects before being demonstrated to the customer. I note, it has always been important to have reports on the quality of the code in the Continuous Integration after all the committees to identify potential problems in the developed product.
We had to work in different teams with different projects from solo to distributed, with a team located on different continents. The skill level of colleagues ranged from entry level to architect. The composition of the teams likewise constantly underwent changes, and this despite the fact that every year new versions of Swift appeared, and ObjectiveC did not stand still .
')
All of these factors stimulated the search for tools to identify the maximum number of errors and make the code more consistent and easy to read.
Clang Static Analyzer
This is the first embedded analyzer that any XCode user encounters. In order to analyze the code each time the application is launched, it is necessary to make the settings described here . These recommendations should be used by all users as the first step of checking the code before each commit.
The lack of support for Swift greatly limits its scope. Of course, Xcode has Address Analyzer and Thread Sanitizer , which support Swift - however, these tools are not static analyzers and can only be used when the application is started, that is, at run time.
Suitable for proactive search for potential memory-leaks and errors in the code structure.
Faux pas
Faux Pas ( wrong step – fr. ) Is the first third-party static analyzer that was encountered with a full GUI as well as a CLI. After the start of its use, the quality of the code became noticeably higher. He helped to reveal in my projects on ObjC from 20% to 50% of hidden bugs. The most curious thing was that at the very first launch of the tool, the tool revealed exactly the errors indicated by the customer. This was the main argument why, in fact, it was decided to purchase this tool for the personal means of the developer, and not to wait until the whole company adopts it.
Unfortunately, not all colleagues accepted this tool positively - some thought that the analyzer should be free, others complained about a large number of settings, not wanting to understand them.
The main drawback is the lack of support for Swift, however, the developers promise to support it , although they still do not announce the date.
A less significant problem is that workspaces are supported indirectly - you have to check either through the command line (configure the workspace check) or each project individually, which, in turn, is not always convenient.
However, Faux Pas finds problem areas of the code that contradict the Apple Coding Guidelines. For example, using self.propety in init and dealloc reminds you about using Modern ObjC syntax , Missing NSNotificationCenter observer detachment, and so on . Easily integrated into CI .
It is better to convert the generated report to Json or plist into something more readable. The report contains a detailed description of the problem, it also provides external links to the rules. Despite the fact that, at times, there are links to stackoverflow, and not to the official documentation, this, nevertheless, is not a significant drawback.
An example of the result of the tool is shown below. You can use the CLI to run the analyzer in Xcode, for problem detection in detail.

To analyze the report presented in JSON, a small application was written that generates a report in Excel with a sample of each problem in a view in a GUI-like FauxPas.
As for the configuration of the analyzer, the tool is configured through:
GUI, CLI Arguments and Configuration Files. There is no way to create your own rules.
Oclint
For the first time, the analyzer met in a small, but long-lived project of a foreign company written in ObjC. The developers of this company were very conservative and did not want to switch to Swift, due to the complexity of the migration to all new versions of this language.
Although OCLint allows you to change and add rules through Scaffolding , this, however, takes a long time. According to the development process in this company, the code will not be transferred to the repository until all analyzer warnings are corrected. Some of the verification rules were not always processed correctly. To eliminate all analyzer warnings, it was necessary to use workarounds (crutches), which led the team to eventually abandon the support of this analyzer.
Nevertheless, the analyzer allows you to identify:
- Empty if / else / try / catch / finally statements without expressions,
- Unused local variables and parameters
- Reports high cyclomatic complexity
- Responds to redundant code from an if statement and unused brackets
- Allows detection of inverted logic and variable reassignment
The analysis time of a small project is quite large (compared to the Clang analyzer), and if this tool has not previously been used in your project, it can issue a huge number of warnings, which will make the initial analysis difficult. Therefore, if the desire to check the entire code base and receive a huge list of warnings is missing, then you can write a small script that checks only the changed files before the commit, which is relevant for any analyzer.
Standardly integrated into Xcode via build Script .
The tool is quite flexible, but, nevertheless, I would like a more advanced heuristic code analysis, since this tool has been around for a long time. Currently, there is a need for an extension plugin for Xcode of this analyzer, which would noticeably simplify its use.
Codebeat
The Codebeat cloud analyzer supports both ObjC and Swift, which was critical when the product was selected for use in a particular project. One of the drawbacks was that the check was done only after the commit hit on GitHub before the pull request, which made the development process a bit unstructured in our case. At the time of this writing, the developers have promised to release the automatic code review utility in order to completely minimize the participation of developers in this process. This is an urgent task, due to irregular or inattentive code checks in the development teams on some projects with a human review.
It supports Swift + Obj-C, Python and Ruby, which is very convenient for mobile development.
ObjC code analysis does not work well. This is due to the fact that the company focuses mainly on analysis of Swift code, and work with ObjC has been added recently and requires further refinement.
Regarding product support, it is on top. It was always possible to contact customer support during the day, and even on weekends the necessary assistance was provided.
As for configuring metrics , this can be done by creating your json file and changing the validation rules. However, the ability to create new validation rules or modify existing ones is absent. However, as the developers assured me, in the future this possibility is planned.
This tool is free for opensource projects, and for private repositories the price is not so high, besides, the trial period lasts 3 months, which can be considered quite democratic.
Infer
The facebook product, which opened its own code analyzer, is suitable not only for analyzing projects on iOS, but also for Android / Java development.
I didn’t manage to launch this analyzer at the command line for a test project, but after creating a request on Github, I was given some of the subtleties of setting it up. I even managed to integrate it into Xcode using the “Run build script” .
To launch the analyzer, an additional scheme was created - Infer in Xcode, by analogy with other analyzers using the CLI. In the particular case of the great benefits of its use have been identified. Perhaps it makes sense to use this tool in other larger cross-platform complex projects.
Swiftlint
A very popular analyzer for Swift developers, which has a plugin plugin for Xcode , which is very convenient.
GitHub's Swift Style Guide is taken as a baseline. It is possible to create regex-based own validation rules. In particular, it is very convenient to create rules relating to refactoring when a new functionality is added to the tool class extensions, for example, the NSLocalizedString () function becomes just a field in the NSString (or String) class extension.
In the specific case, the teams worked on distributed branches that were not refactored. Using the “autocorrect” option, you can easily bring the code to a single style when the code is merged on a single brunch.
SwiftLint was used in a large hybrid project containing both ObjC and Swift code. The author of the idea of introducing it into the project, unfortunately, did not read the article about the vicissitudes of use - the “autocorrect” option and inserted a check into “Run Script” in Xcode. Of course, in large projects with a team that does not have a common synchronization point, not everyone installed this tool right away. At the same time, there was a migration to Swift 3.0, which undoubtedly added confusion with new commits.
Starting from version 0.16.0, some false triggering rules appeared, for example, with large_tuple projects stopped compiling through the build script. In addition, not all rules are processed correctly, which is common to many analyzers and this forces the use of workarounds, from which the quality of the code suffers. This problem made it more accurate to apply SwiftLint to the “Build phases script” for each project.
This tool was also integrated into Jenkins, which obviously improved control over the code base of the project.
Tailor
Tailor is a cross-platform static analyzer for Swift. The fact that the Windows platform is supported is quite unusual.
Used as an alternative to SwiftLint on pilot projects. However, for the given period of time it supports only Swift 2, which does not correspond to modern requirements a bit. However, there is an issue enchantment to support Swift 3.0.1. Supports code style rules for The Swift Programming Language, GitHub, Ray Wenderlich, and Coursera.
The following recommendation is recommended for pods and workspace support.
The ability to create your own rules has not been found, although there is a possibility that it exists, but this should be carefully considered.
Integrated into Xcode through “Build Script”. To suppress warnings like trailing-whitespace , which immediately begin to cause inconvenience when you first use it,
It is recommended to use keys:
tailor --except=brace-style,trailing-whitespace If desired, the report can be output in HTML, JSON or in Xcode format, which is quite convenient for use in CI when publishing the results on a web server.
Formatting in Swift Style
Speaking of analyzers, it is impossible not to mention the “formatters” of the code for a particular style guide.
Despite the fact that they are not static code analyzers, they format the code to the Swift Style, nevertheless, they serve the same purpose of detecting errors by converting the code to a single style that allows the programmer to better perceive the code and, therefore, quickly identify problem sections of code.
SwiftFormat
Convenient in that it allows you to create your own rules to meet the code style of a specific command. Configuration occurs through the CLI, which may not appeal to everyone. However, it can be installed as a plugin in Xcode.
Swimat
The tool can be used as a CLI, and Xcode extension. This is indeed a good tool, even though it contains several critical bugs that cause Xcode to crash when used. However, the developer promptly eliminates them. The ability to add your own validation rules is present.
In the particular case, it was used to format the code of a small project, where it showed itself from the best side in terms of convenience and output.
Both formatters are conveniently used as extensions to Xcode, and are currently being maintained and improved.
Checkmarx
In practice, at times, there are projects from customers critical to the safety of the product being produced. For such projects, it is better to use the Static Application Security Testing (SAST) source code audit solution from Checkmarx.
This cloud solution, that is, a tool, can be located either on a local development server or on a Checkmarx company server. Rather advanced analyzer using its own patented technology. Checkmarx, which previously worked closely with the US Department of Defense, has a lot of interesting insights regarding the exploration of various vulnerabilities. It supports Swift, but in a specific case ObjC project was analyzed. Unfortunately, it does not have an Xcode extension plugin.
The reporting system is very informative and presentable. One of the pages is shown below.
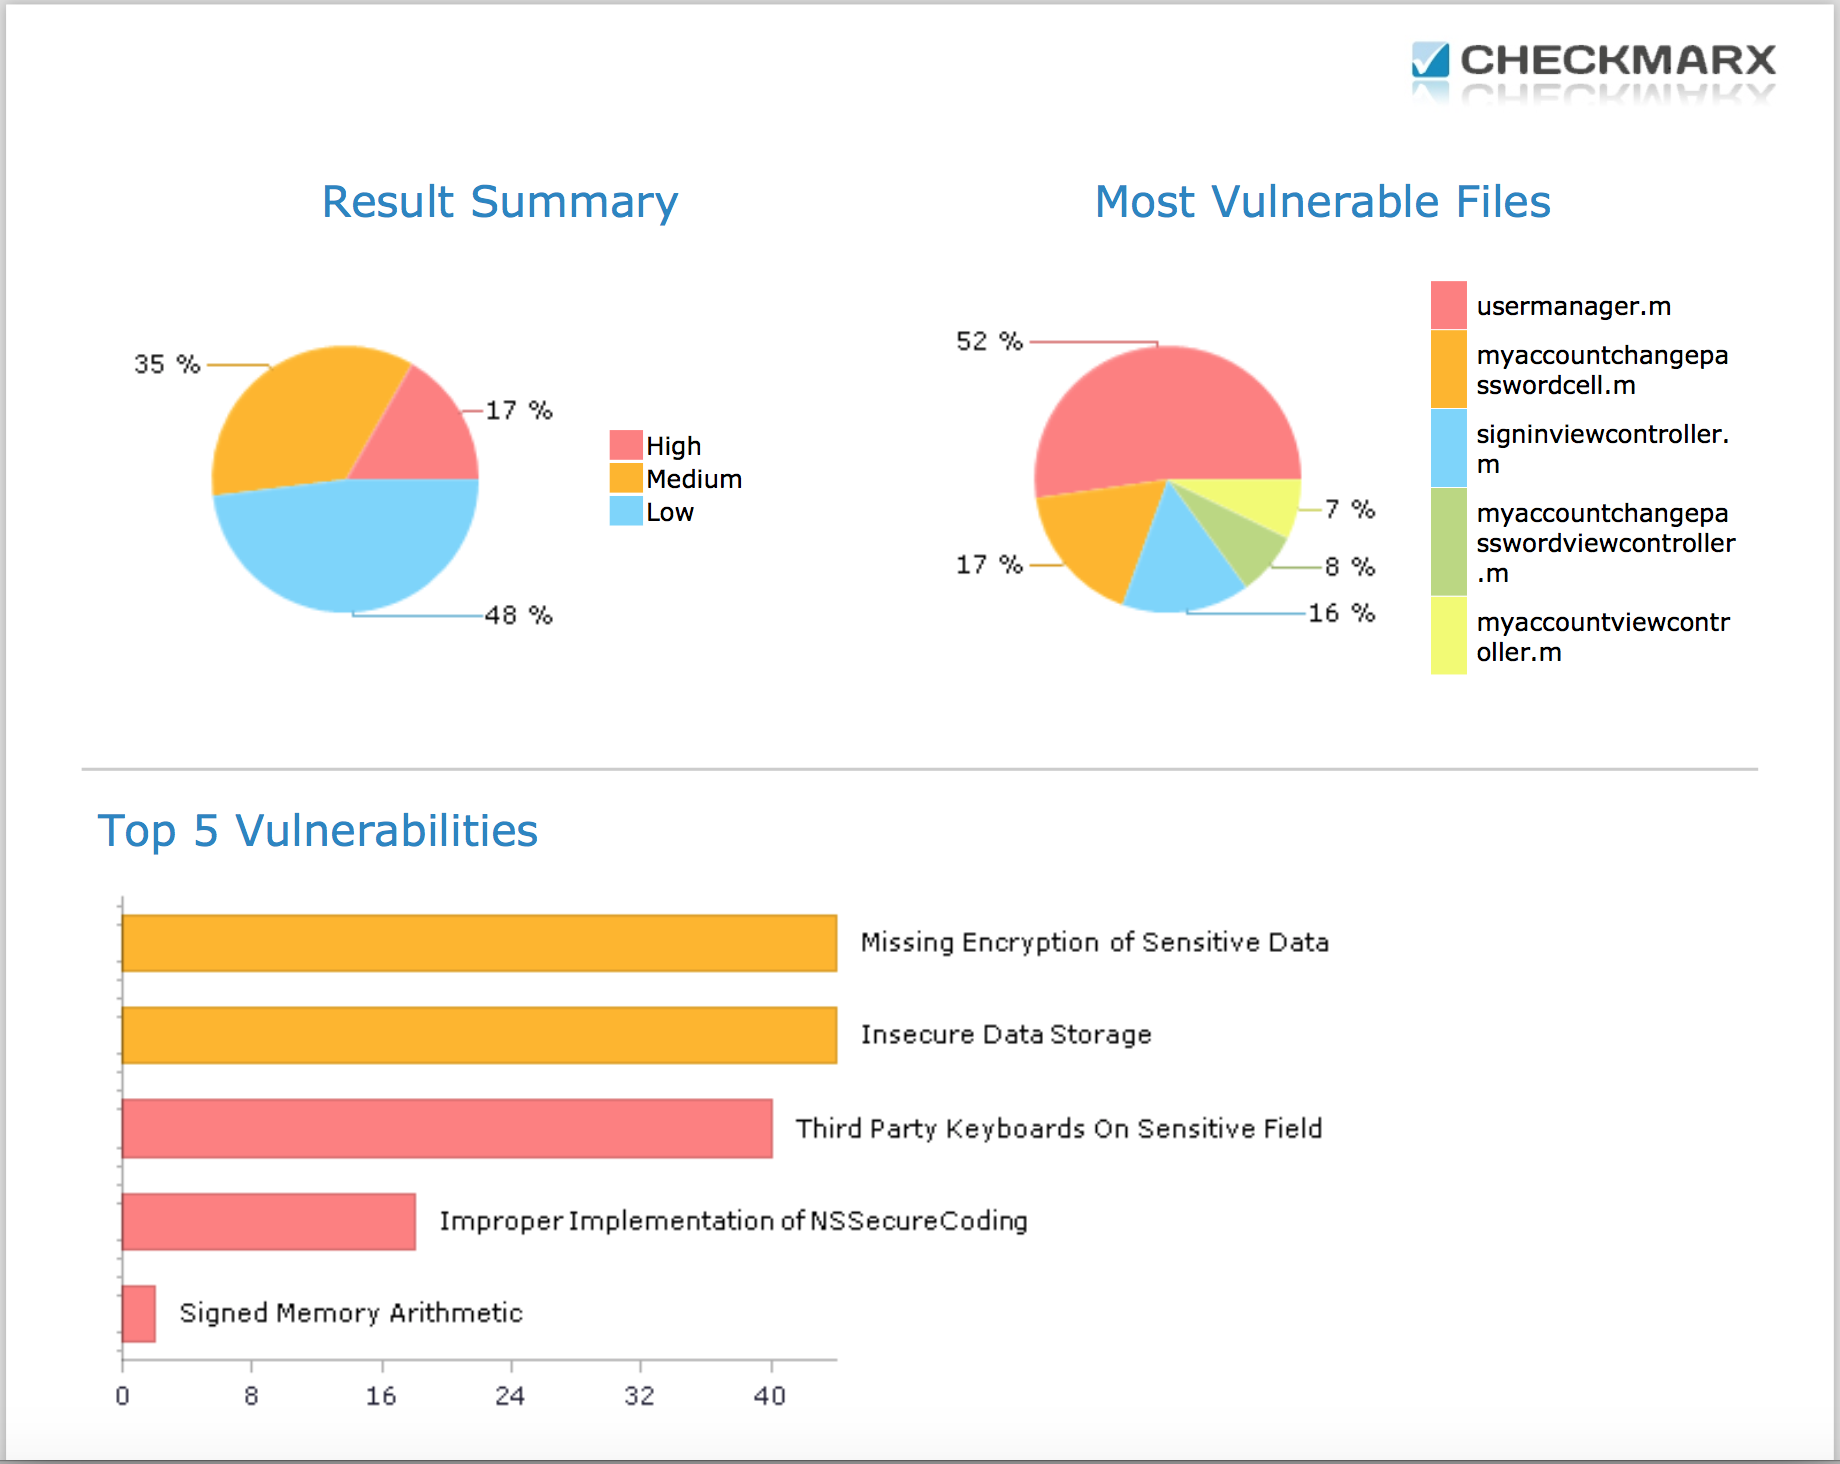
An informative report can contain from 10 to 300 pages depending on your project. The report also explains how to fix problems, and even provides examples. A common mistake for all projects that were analyzed was the “Third Party Keyboard Enabled”, which is associated with a possible vulnerability when installing third-party keyboards for iOS (although one of the analyzed applications did not contain keyboard input fields).
Afterword
I would still like to get acquainted with some tools of static code analysis in practice, for example, Sonar . However, due to the high cost of the product and the complexity of its installation, this possibility has not yet presented itself. At the same time, for some projects, it is interesting to try Solar inCode to look for vulnerabilities in the code for customers who worry about the security of their applications. To my regret, this product could not be obtained even in the Demo version.
Many of the above tools have helped make the products created more stable and more resistant to various vulnerabilities in the code. In principle, any analyzer is an unbiased judge, to whom you are indifferent and you have no personal complaints about him, which makes all the work more objective and orderly.
Nevertheless, it is obvious that there are no perfect tools, and even the use of all existing code analysis tools is not a panacea. Not to mention those cases of false triggering of tools when you have to use workarounds to meet the requirements of the analyzer. In this regard, a human review will always be relevant to at least identify semantic errors such as dragState, instead of drugState or cacheData, instead of cashData (although you can configure auto-replace ...).
useful links
- Static Analysis with OCLint
- Device and principles of operation of static analyzers
- Guide for Static Analysis.
- Getting the most out of static analyzers
- "Watch Your Language!": The Road to Cleaner Code with SwiftLint
- Thread Sanitizer and Static Analysis
- About Debugging with Xcode
- We control the quality of the code using the SonarQube platform
- Regular use of static code analysis in team development
Source: https://habr.com/ru/post/321162/
All Articles