Simple math for solving difficult problems

When reviewing the article devoted to the system of prioritization of calls to the technical service of JSC “Infovotch”, a logical question may arise: how were the weights calculated? “Laying down” the calculation algorithm in the commentary on the article, taking into account its volume, will be, to put it mildly, difficult. Therefore, foreseeing such questions, we decided to supplement the previous article with a step-by-step consideration of the algorithms for calculating these weights.
First of all, it is worth noting that the entire calculation is based on the tools used in the hierarchy analysis method (AHP). MAI is a mathematical tool for making management decisions by experts. The short meaning of this method, in theory, is to present the problem as a hierarchy. The top of this hierarchy is our goal. The lower level contains alternatives; the intermediate level contains criteria for evaluating these alternatives.

')
Figure 1. Estimated baseline data
The type of hierarchy directly depends on the task that we set before us when making decisions. In our case, the hierarchies will be two-level, since here we do not solve the problem of choice, but use this tool for calculating weights in an expert manner. In order to simplify the consideration of the computational algorithm, we consider in detail all the calculations using the example of determining weights by a basic indicator. Similarly, the calculation is made for floating indicators.
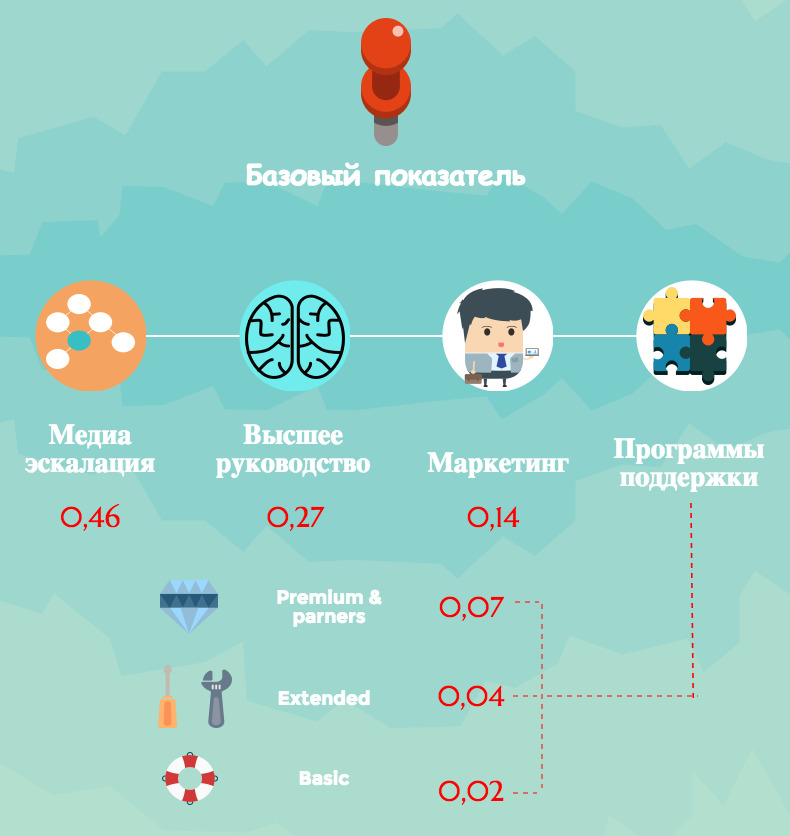
Figure 2. Estimated baseline data
In MAI theory, the calculation algorithm is implemented in five stages. However, we will use only two steps aimed at building a matrix of pairwise comparisons and calculating the corresponding vector of priorities containing the desired weight.
It should be noted that the presentation of the task as a hierarchy in practice is optional. Our hierarchy at the first level contains the “Base figure”, the second level of the hierarchy contains the components “Media escalation”, “Top management”, “Marketing”, as well as three support programs.
The next step is to determine the priorities of the components, which reflect the weight of one or another component in the group in question. It should also be noted that priority is in the range from zero to one. The sum of the priorities of all components subordinate to the base indicator is equal to one. To calculate these priorities, we will make a pair of component comparisons with respect to the baseline. At this stage, the inverse-symmetric matrix is calculated by property:

where the indices i and j are the row number and the column number at the intersection of which the element stands.
When comparing components with itself, we expose the unit. Task formalization has the form:

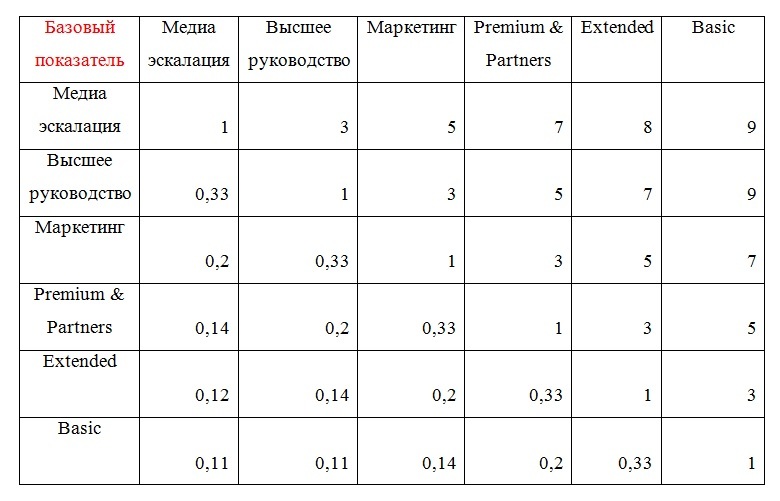
Matrices are constructed as follows. In the upper left corner, an element is recorded with respect to which a comparison is made in order of importance. The headings of columns and rows contain compared elements. For our task, we built five matrices, one for the base indicator, and four for floating indicators and their classification features.
Now let's see what the matrix represents for calculating weights on a baseline in general.
Table 1. Matrix level 2 hierarchy

If everything is clear with the diagonal (as we already said, when comparing an element with itself, a unit is set), then where do we get estimates of relative importance for all other cells? For these purposes, developed a universal scale of relative importance.
Table 2. Scale of relative importance

Thus, the expert, comparing the elements in the rows with the elements in the columns in order of importance from the point of view of the basic indicator, gradually filled this matrix using the property of inverse symmetry.
For example, from the matrix one can see that Media escalation exceeds the level of “Basic” support in relation to the base indicator very strongly, as evidenced by the intensity of relative importance “9” indicated by the expert.
It is worth noting that if there are disagreements among experts, the geometric mean of different estimates is determined as a general assessment of judgments:

The next step is the synthesis of priorities, which allows you to combine the results to determine the desired weights.
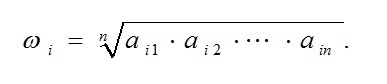
To determine the relative value of each element of our matrix, it is necessary to find the geometric mean and, for this purpose, multiply n elements of each row, and extract the roots of the nth degree from the result.
_____________________________________________________________________
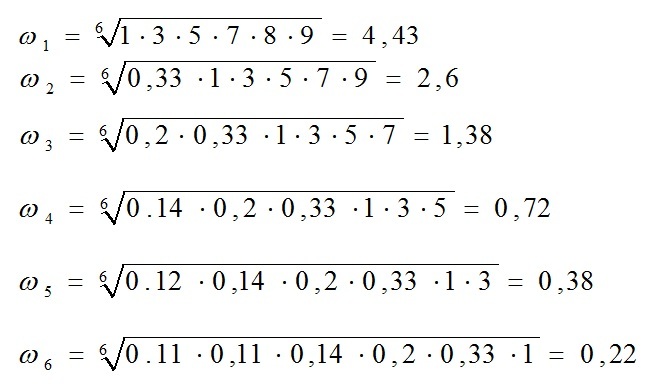
For the matrix under consideration, we obtain (the dimension of
 ):
):
To normalize the obtained numbers, we determine the normalizing factor r.

And each of the numbers
 divide by r.
As a result, we get the vector of priorities:

where the index "2" means that the priority vector belongs to the second level of the hierarchy.
_____________________________________________________________________
For the considered example, the normalization coefficient is:

And the vector of priorities:

Numbers

are components of component priority vector

We perform a similar procedure for all matrices of pairwise comparisons and obtain the result for all the required weights. In conclusion, it is worth noting that this computational algorithm is easily implemented using MS Excel.
Source: https://habr.com/ru/post/321012/
All Articles