Correct problem detection with Zabbix

Alexey Vladyshev ( alexvl )
My name is Alexey Vladyshev, I am the creator of Zabbix , and at the moment I am responsible for its architecture and roadmap.
This is an introductory lecture, first I will tell you what Zabbix is, then how Zabbix works in terms of high-level architecture and in terms of problem detection. We will talk about how to detect problems in relation to Zabbix, how to use Zabbix to detect problems.

')
What is Zabbix? If you go to our page, you will see that Zabbix is an Enterprise level Open Source monitoring solution, i.e. This is an open enterprise solution for monitoring. I understand the word "enterprise" in such a way that the solution should be easily integrated into the existing infrastructure. Those. if you have a large enterprise, you are already using some products - Helpdesk, Configuration Management, something else - the system should be easily integrated.
What distinguishes Zabbix from other products? I think that a big difference and a rather big advantage is that Zabbix is an open product, it’s really open source, i.e. we do not have any closed versions, we build a product 24/7 and give it away for free. Please visit our page and use our product. There are other benefits. I am not for the purpose of advertising, but simply in the educational sense - how are we different? Zabbix is an all-in-one solution, i.e. visualization, detection of problems, collection of information in various ways - all this is in Zabbix, you do not need to build your monitoring system from different separate blocks.

How does Zabbix work? For those who still do not really represent, we collect data. Zabbix server is the core of Zabbix, in which all the logic. We collect data in various ways. This data, information is stored in a database, history, then information is used for visualization, and the kernel is also involved in analyzing the flow of information. We detect problems and somehow react to problems. There are different kinds of reaction to problems.
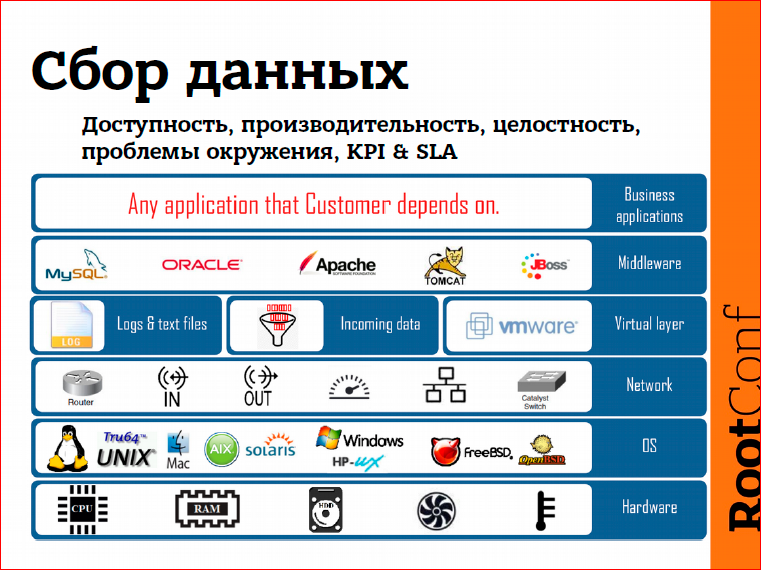
As for data collection, what problems can we catch? These are problems related to performance, availability - whether a service is available or not. We can immediately determine how fast the system is running. These are problems with performance, with data integrity. If we have changed some configuration file or, perhaps, an image of our system, which we deploy to cloude. The check-sum has changed - Zabbix will immediately tell you that our file has changed.
Zabbix also covers the business level of monitoring a little bit, i.e. in fact, we can detect problems at various levels of our IT infrastructure:
- This is the level of iron - something happened with some piece of iron, we will immediately find out about it,
- operating system level
- the network is mainly monitored via SNMP
- virtual level, i.e. Out of the box we offer, for example, monitoring of the WMware infrastructure, vCenter and vSphere,
- then comes the middleware,
- business applications.
Those. if we know how to detect problems in our application, and Zabbix does not support it “out of the box”, it can be screwed to Zabbix using scripts.
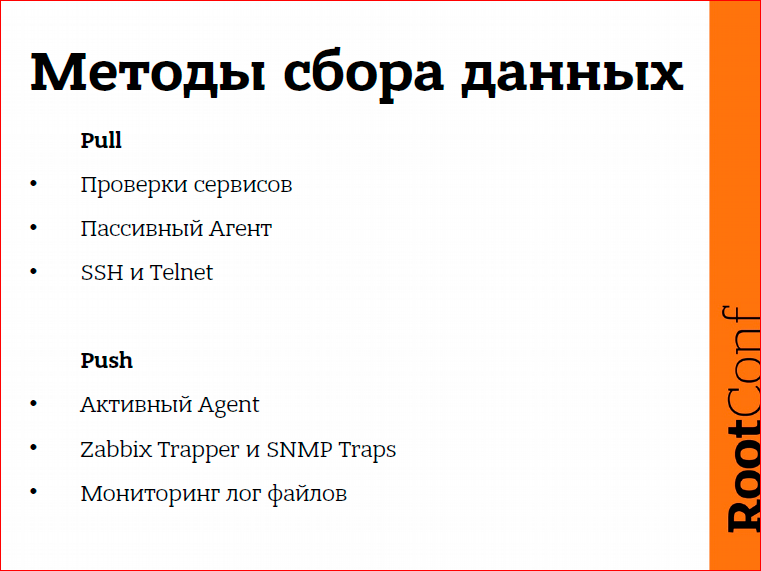
How can data be collected? There are two ways: Pull - when we pull data from the device; and the Push-method is when the device itself informs us, gives us information. Pull is the usual checks, say, SNMP, or service checks, when we connect to the service, say, SSH, and if the web page responds correctly, then everything is fine. Push is basically an active agent, various types of Traps and SNMP Traps. Data collection works through the push method.
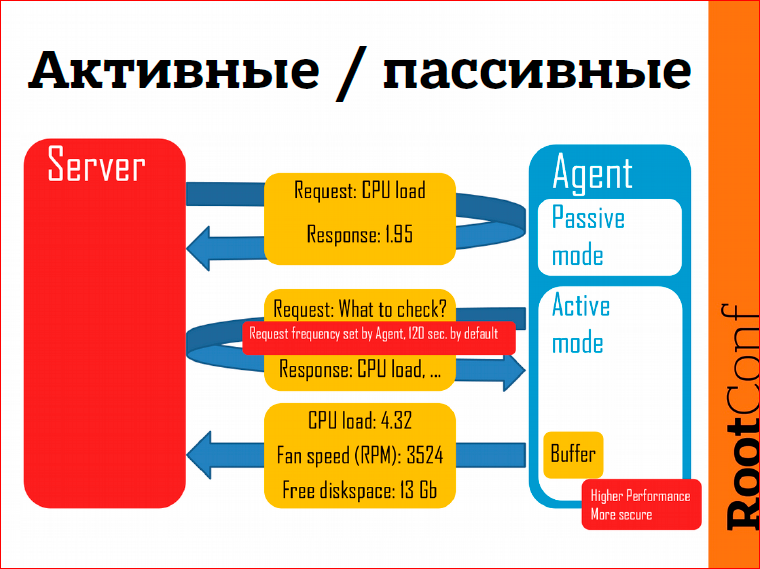
As for Zabbix agent. An agent is a program that can be installed on Linux, Windows or other operating systems. I wanted to talk about active mode. What are its advantages in detecting problems? If the passive mode is we are connecting to the agent, requesting information, the agent returns to us, say, the processor load, then in active mode the agent sends data to the monitoring server. Here are the advantages:
- it works fast, at least faster, because the server should not be engaged in the constant interrogation of devices, the devices themselves send information,
- more secure from an agent’s point of view, because the agent does not need to listen to any TCP connections or network connections.
- a small advantage, what is important to us today - in the active mode there is buffering. If the Zabbix server is unavailable for some reason, let's say we upgrade the Zabbix server, we have several minutes downtime, then the data will accumulate on the agent side. As soon as we start the server, the data will immediately go to the server side, and we will be able to process them.

In general, the question is: how often to poll the device, how often to collect data?
Of course, I would like to poll the data once a second, any devices to poll once a second, to collect some GBytes of information. As soon as a problem arises, immediately, in a second, we understand that we have a problem. But there is such a principle: we should not harm the system. As in quantum physics, the observer influences the process. If we observe for some reason, we already influence the process. The same with the monitoring system. If we start to collect too much information too often, we influence the system we are monitoring with a monitoring system. Therefore, here we need to choose a middle ground - on the one hand, to do no harm, on the other hand, we must discover the problem as quickly as possible.
Zabbix has several options. First, we can monitor some device or metric once every n seconds or once a minute we run some kind of check. It is possible to use a different frequency depending on the time interval. Suppose it doesn’t matter to us that the system does not work during off-hours, it’s important for us that the system works during work hours. Then we say to Zabbix: “Check, please, workstations from 9:00 to 18:00” and that's it. There is a possibility.
In Zabbix 3.0, a new opportunity for checking the type “ready for work”, “ready for business” will appear. This means that we will be able to say to Zabbix: “Do these checks at a specific time.” Suppose a bank branch opens at 9 o'clock in the morning, and at 8:55 we have a certain check list, and we check that the branch is really ready to work, that everything works well with workstation, that the services we depend on , in order that the previous one successfully closed and a new financial day opened, etc. Those. Starting with Zabbix 3.0, you can run checks at a specific time. If we say to Zabbix: “Check, please, this service at 8:55,” Zabbix will check the service at 8:55. It will also be possible to perform these checks at intervals, for example, at 9:00, at 10:00, at 11:00 - exactly at that time, as we indicated.

How to catch problems in the flow of information? There is a huge flow of information, Zabbix performs thousands, tens of thousands of various performance and accessibility checks per second, and we offer a solution - triggers. If you use Zabbix, you know what triggers are. This is, in fact, a description of the problem, i.e. we formulate the problem. At first, maybe in our own language, and then we try to translate this into a format of trigger expressions.
A simple trigger expression, for example, processor load on the server is greater than 5:

This is the simplest trigger. Triggers can be much more complex, we can use arithmetic-logical operations. It is very important that we are not limited to one metric: we analyze not only one metric, we can analyze almost everything, i.e. take data from various devices, use them in describing the problem. Also, Zabbix is available for analysis as real-time information that we have just received, and information that we have in the database, so-called. historical information.
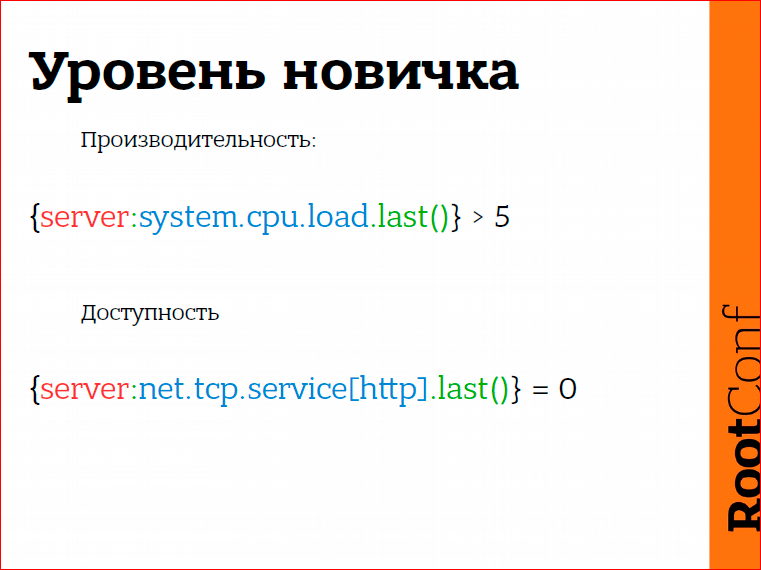
What beginners usually begin with, neophytes from monitoring? They get into the hands of Zabbix, such a powerful tool to detect problems, and immediately want to know everything about everything. It would be desirable, as soon as something happened somewhere, immediately receive an e-mail or SMS. What does this lead to? It would seem that everything seems to be in order, the system is overloaded, a “current processor load is greater than 5” trigger is created, triggers are created for accessibility, such as “http service is unavailable”, i.e. The last checkout said that the web server is unavailable and we believe that we have a problem. Why not do so well?

Such triggers, such problem descriptions are too sensitive. The CPU load has exceeded 5, and we believe that the system is overloaded, we connect via SSH, we launch TOP, and the CPU load is already 4.5. Or Zabbix told us that the web server is not working, in fact, we connected, and it works. So what happens?
Such things, this sensitivity leads to addiction. The monitoring system generates too many messages, and we stop responding to them, because these are not really real problems.
Just give an example. In Latvia some time ago there was such a case - an alarm system worked in the supermarket, and people, as usual, did not react to this. The staff, who should take all the people out of the supermarket, thought: “Oh, the alarm went off, no big deal.” Those people who were in the supermarket thought: "Well, okay, I will complete the purchase and go out." In fact, it was a forerunner of the fact that the entire overlap collapsed and many people died.
Why did this happen? Because people are used to the fact that the alarm went off, they looked around, there was no fire. Well, we continue to work or continue to have fun ... But this addiction is a very, very scary thing. Still, if the monitoring system says that we have a problem, there should be this problem, the monitoring system should not be too sensitive.
What to do? Here it is important to correctly formulate the problem and understand the essence. One has to ask the question: what really problem are we trying to describe. What does “system overload” mean or what means “service unavailable”?
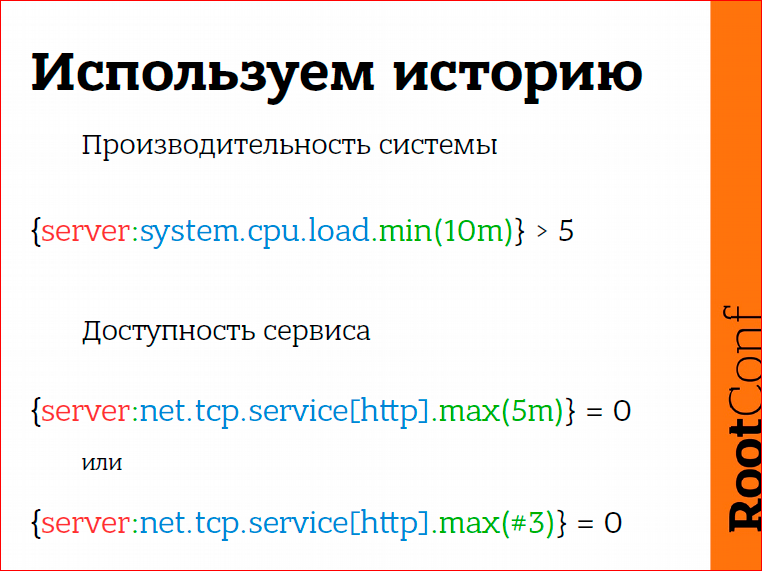
The system is overloaded, say, the processor load is more than 5 (I consciously use very simple examples today, that is, examples can be more complex, but this is such a simple example). The system is overloaded - this is not that we now have a processor load = 5, but still the system must be loaded for some period of time. And here we can analyze the story. Those. let's say, the last 10 minutes, the CPU load was more than 5, then yes, the system is really overloaded, maybe some process was frozen, or something else happened.
In case of service availability, what can we do? The same thing is to look into the story: “How was it before that?”. If the last 5 minutes, the system told us that http is not available, then probably http is not available.
Here it is still important to understand the essence of verification. How do we verify that the web server is available? We check as follows: we make a TCP connection, get-request, then we count the result, and here something can go wrong. For example, a timeout occurred. Yes, the timeout happened, but does this mean that the web server is not working? No, not necessarily. But if we had a timeout three times, like here, (# 3) - this means that the last three checks answered that the server is unavailable, then there is a very high probability that our web server is really unavailable, or problems with the network, for example .
Therefore, we still have to look at history, i.e. to base your decision on the last meaning is not entirely correct in most cases.

What else would I like to talk about? The solution to the problem is not equivalent to its absence. What does this mean?
For example, we do not have enough free disk space (again, I take very simple examples). How can this be formulated? For example, less than 10% of free disk space remains. The question is: as soon as we have 11% of free disk space, this problem was solved or not solved? It seems to me that the problem is still not quite resolved. Or we have 10% plus 1 byte there.
So, in Zabbix there is a mechanism that allows you to describe various conditions for a problem situation and for getting out of a problem situation.
Free disk space, say, less than 10%, but I want to get out of this problematic situation only if I have 30% free disk space, not 10%, but 30%. Only in this case I am 100% sure that someone did something, that someone deleted some files, the system administrator connected, expanded our file system, increased its size, in this case there is no more problem.
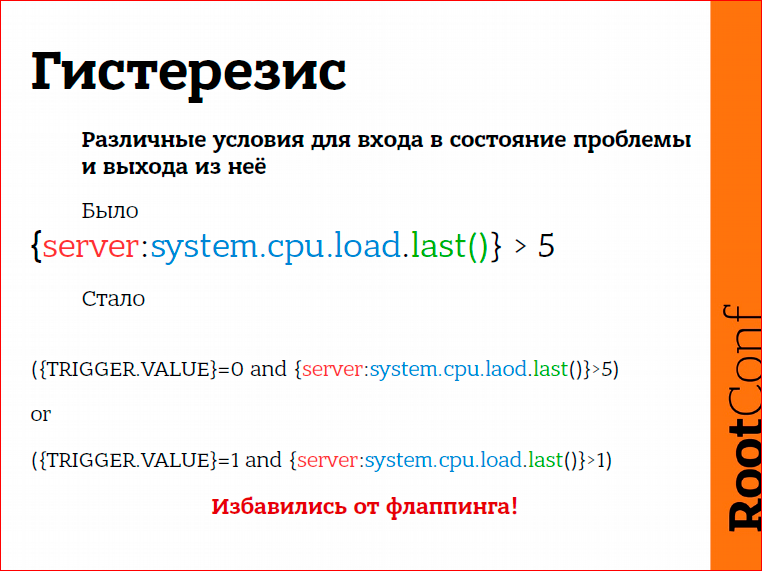
For this we use hysteresis. Hysteresis, in essence, means the following. Suppose we are looking at a photo of a car. It’s as if the car is worth it, but we don’t know its condition - it can stand, can move forward, back ... Without knowing the history of what happened before, we cannot say what condition the car is in right now. Those. we must still look a little at the story that happened before. And using various conditions to enter the problem state and exit the problem state, we get rid of the so-called. flapping.
What is flapping? Flapping is when very simple problem descriptions are used. For example, the processor load is more than 5, or the free disk space is less than 10. What happens if we have 10%, then 8%, then 11%, then 7%? This is a flapping. The problem arises, disappears, arises, disappears. We arrive in the morning, open our inbox and see a lot of messages from Zabbix that the problem was, the problem disappeared, was, disappeared, was, disappeared ... What does this mean? To the fact that we do not trust the monitoring system. This is the flapping. And if we use different conditions to get into the problem and get out of the problem, then we get rid of the flapping completely.
A few examples:
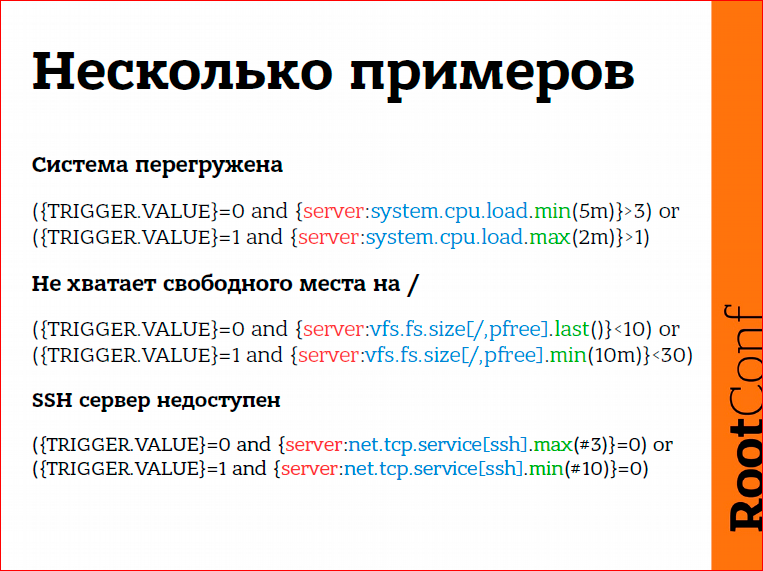
The system is overloaded, the processor load in the last 5 minutes exceeded the top three, but we exit the problem only when the last 2 minutes the processor load was less than one. Here another logic is used slightly, here the first condition is the entrance to the problem, the second condition is that we remain in the state of the problem as long as there is at least one value greater than one.
No free disk space. My example is less than 10%. The problem is because it is really a problem, we are 100% sure. And we come out of the state of the problem, when during the last 10 minutes we had more than 30% of free disk space. Because a system administrator can start, say, move some large files from one file system to another, copy something. If within 10 minutes we have a stable situation that there is more than 30% free disk space, we think that the problem has disappeared.
The same, SSH server is not available. The last three checks told us that the server is unavailable, we believe that the server is unavailable. But we only want to recover when the last 10 checks told us that the server is finally available. What happens in reality? We have problems with the service, begin to repair it, restart, maybe roll back to some old versions, the system works, it does not work. And here we just describe this period of availability. The last 10 checks are all right, now we can definitely go to bed, because we know that the service is good.

Anomalies. Generally, what are anomalies? Anomaly is a Greek word meaning deviation from the norm, i.e. there is a certain norm, and as soon as we deviate from the norm, it is considered an anomaly.

How can an anomaly be detected? In Zabbix, there is such a functionality when we take as a standard the state of the system in the past and compare it with what is at the moment. Suppose if the average processor load for the last hour is twice the processor load for the same period exactly a week ago ... Not yesterday, because if we compare it with yesterday, it can be a comparison of Sunday with Monday, Friday with Saturday - not quite correctly. Say, if today is Thursday, then we compare it with what was last Thursday. We believe that this is the norm - what happened last Thursday. If today we see that the CPU load has increased, then Zabbix can send a message to the administrators and say: "Hey, guys, please see some problems we have here." Perhaps the problem is not necessarily, of course. Because it is an informative message. Maybe they made an upgrade of any system, there were regressions in terms of performance, maybe something else ... This is important.
Good functionality, I suggest to start using it somehow. It is difficult to say whether it will bring any real practical benefits, but at least this is the thing that very often reflects the harbingers of more important problems, more serious problems. Pay attention to this.

And addictions. It would seem, seemingly, to get rid of flapping, from all such things, but we still know that we have problems that depend on each other.
The simplest example at the network level is when we have a device behind the switch. With a switch problem, the monitoring system thinks that all our devices have fallen off, we receive a lot of SMS messages. We cannot determine what really happened, which is the root cause of all these problems.
In Zabbix, we simply define how one problem depends on another.Let's say the CRM system depends on the database, depends on the network, depends on some middleware, something else. The database itself depends on disk space. In case we do not have disk space, we will receive the only message that we do not have disk space.
How to respond to problems?

The reaction may be different. Probably something that should be used, maybe not always, but often it is a good idea, after all, an automatic solution to the problem. Sometimes it is possible.
Sometimes we know that we have an application that eats memory. Eats the memory and everything, we have no solution, and this application just needs to be restarted from time to time. Sometimes there is a situation with the fact that we got some kind of kernel panic. Here, from time to time we receive kernel panic, we need to restart this server. All this can be assigned to the monitoring system. Those.in the case of kernel panic over IPMI, we can automatically reset at the hardware level. In the case of services, we can restart our services also automatically.
A reaction can simply be a message to a user or a group of users. Also, the reaction may be the opening of some tickets in the Helpdesk system. Those.You can react in absolutely different ways, and of course, the method of reaction depends on how serious the problem is. If the problem is not very serious, you should not immediately send an SMS message at 4 am, if this problem will still be solved at 10 am the next day.

Still have the opportunity to escalate problems. Those.a problem arose, and then we ask ourselves the question: what to do with it, whom to notify? Of course, we send a message to administrators, administrators do something, but I think that a very effective option is when the problem escalates to the level of a bureaucratic tree, to a higher level, the manager, maybe even the manager, maybe further - CEO. And the CEO will not receive messages of the form “some kind of disk volume has fallen off, something else there”, the CEO will receive from Zabbix just a message like “last half an hour we are losing money”. And everything, and then everything is clear.
You can respond immediately - a problem has arisen, we immediately do something. You can react with a delay, i.e. there was a problem, well, let's wait maybe another 5 minutes, and after 5 minutes we will send a message. And here the following is important. Alert if automatics did not work. Suppose we have a service, it does not work, we have configured Zabbix to automatically restart this server. How do we set up escalation in this case? We configure as follows: first, we restart the service, and after 10 minutes, if the problem still exists, send an alert to users. Or goes further escalation to higher levels.
And repeated alerts - this is also very important, especially for serious problems. Some things can be easily missed, you can skip SMS, you can skip an e-mail message, but for important problems you should still use repeated messages. This is also a very good incentive, we see that yes, there is a problem, and we need to work to solve it as soon as possible.

And, maybe, such a result. What is important here?
- Story.We base our decision not only on real-time monitoring, on operational information that we have just received, but also look into history. In the story you need to look. It is important.
- – . , , Zabbix, , . , – . - . .
- , , , - , , , . , Zabbix 3.0, , baseline monitoring. What does this mean? Baseline – , .. baseline . , baseline , , , , . Those. - , , . , , .
- . , , , , , , . - – , , , , – .
- And escalate the problem. A great incentive for administrators if we are doing escalation. Escalation does not mean that there is an administrator, chief, chief of chief, chief of chief of chief ... Escalation - this means that we will be able to react to the problem immediately in one way, then try again, maybe, automatically solve it in another way, and then, maybe After 5 minutes, if the problem still exists, try to solve it in the following way. First, we restart the service, the problem still exists, say, the exchange did not start the first time, what can we do then? We can restart the server at the physical level and then watch what happens.
Contacts
" Alexvl
" alex@zabbix.com
" Zabbix
— devops RootConf .
RootConf devops, , .
— " - ", , RootConf .
, , — , . , / — . .
Source: https://habr.com/ru/post/320678/
All Articles