Application Monitoring with Pinba
 Hi, Habr! We at Badoo try to actively participate in the life of the IT community: we use many open-source technologies and tools, and we also share our developments.
One of these tools is Pinba , a service for getting realtime statistics from running applications without the overhead of its collection. You can learn more in this article .
We try to help everyone who uses Pinba in their projects and are always happy to hear the success stories related to Pinba. This translation is one of similar stories from Dailymotion developers.
Introduction
Dailymotion uses many tools to monitor, analyze and optimize its applications, such as StatsD, Graphite, collectd and Datadog. But among them is the less well-known - Pinba (stands for PHP Is Not a Bottleneck Anymore).
We are currently working on migrating an outdated monolithic PHP application with a lot of legacy code. Instead, it is planned to deploy several modern microservices. With Pinba, we collect:
data about the current PHP application. This allows you to more efficiently perform maintenance and deployment (identify releases that adversely affect performance), as well as find and analyze possible problems. In addition, the data obtained help determine which components of the platform should be improved in the first place in order to obtain the greatest performance gains;
- data on new microservices. And, depending on the development language (at present it is Python or Go), we use different clients (although for them there are clients out of the box - approx. Lane).
What is Pinba?
Pinba's creator, tony2001 , describes it like this:
“This is a statistics server using MySQL as an interface. Pinba collects and processes data transmitted by a variety of PHP processes via the UDP protocol, and then displays the statistics in the form of simple and understandable reports. In addition, using a special interface, you can access raw data in read-only mode to generate more detailed reports. ”
How it works?
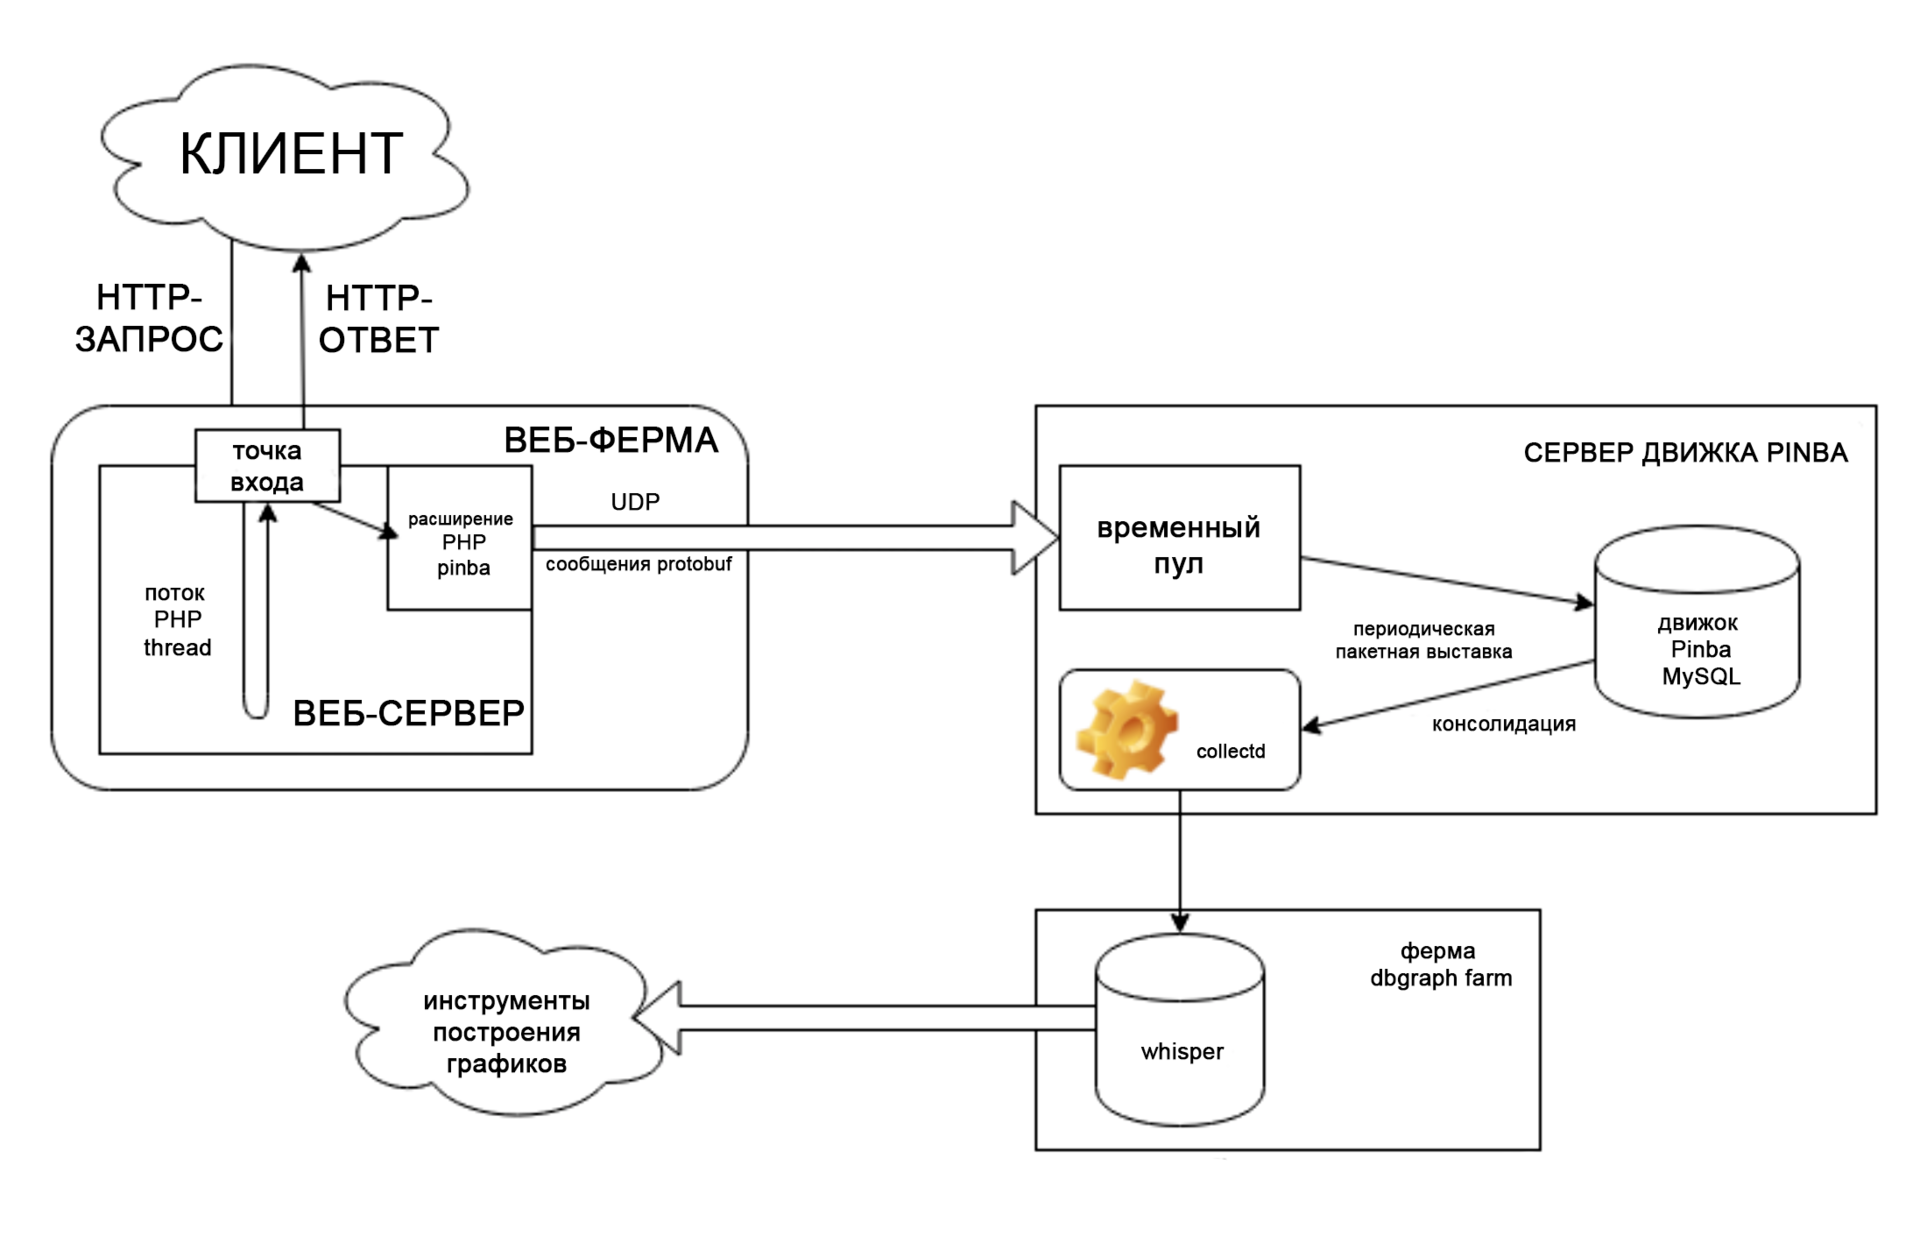
The Pinba extension for PHP is installed on all servers in our web farm. It collects technical data for each PHP stream and, after the response is sent to the client, sends the received metrics to the central Pinba server via UDP (using the Google Protobuf data exchange format). On the central server, the Pinba engine aggregates the contents of these messages and, pretending to read-only the MySQL engine, provides data in the form of tables that can be viewed and sampled from them using any familiar MySQL client. Convenient and efficient.
Despite common misconceptions, Pinba is not a debugger or graphical tool. It’s just a data viewer that takes a picture of what’s happening in your production application (a real-time slice is created in the last minute or two). It allows you to use dynamic metrics to build graphs of time series without sacrificing performance and, accordingly, in time to identify possible problems.
Of course, Pinba is not a panacea and will not solve all problems. One of the common mistakes associated with using this service to collect accurate data (for example, as a counter of events that took place in the last minute). Pinba is not designed for this type of task (as you already know, in order to improve performance, protobuf messages are sent via UDP, so some packets may be lost along the way). Use this tool to track trends, it is not suitable for accurate quantification of actions.
Our architecture
What metrics can be monitored using the service?
The range of technical metrics tracked by default in all PHP processes is very wide:
doc_size - the size of the response;
mem_peak_usage - allocated memory (maximum capacity);
request_time - time taken to create the process (processing microsend);
ru_utime / ru_stime - statistical data on the use of server resources (by the user and the system);
status - HTTP response code;
- memory_footprint - the amount of memory occupied by the process.
The engine stores metrics for each process in the request table, allocating one line for each PHP response for the last pinba_stats_history seconds (in our case, 60 seconds).
mysql> SELECT script_name, doc_size, mem_peak_usage, status, memory_footprint, hostname FROM request LIMIT 10; | script_name | doc_size | mem_peak_usage | status | memory_footprint | hostname |
|---|---|---|---|---|---|
| [PROD] video_item | 5.422 | 10240 | 200 | 54728 | web-065 |
| [PROD] widget_dispatch_v3 | 38.056 | 14848 | 200 | 31624 | web-031 |
| [PROD] video_list | 154.369 | 20736 | 200 | 87176 | web-004 |
| [PROD] rest_api | 0.235 | 22784 | 200 | 51568 | web-128 |
| [PROD] rest_api | 9.306 | 34048 | 200 | 55624 | web-024 |
| [PROD] rest_api | 5.448 | 35072 | 200 | 54676 | web-041 |
| [PROD] controller_dispatch | 2.003 | 11776 | 200 | 36388 | web-033 |
| [PROD] widget_v3_chunks | 22.525 | 12544 | 200 | 33544 | web-165 |
| [PROD] cdn_director | 0 | 9984 | 302 | 42892 | web-034 |
| [PROD] rest_api | 0.019 | 20736 | 200 | 32500 | web-085 |
The request table contains metrics for each PHP process, and accessing raw data can be quite difficult in the case of heavy traffic:
mysql> SELECT COUNT(1) from request; | COUNT (1) |
|---|
| 1197502 |
That is, within the framework of our entire web farm, in 19 seconds, 1 197 502 PHP responses were generated.
Fortunately, the engine simultaneously performs instant aggregation by placing summary metrics in the report_ * table. Metrics, grouped by value in the script_name field, are in the report_by_script_name table, so we can analyze the metrics for specific script_name values. For example, we can get statistics on the ten most frequently called routes:
mysql> SELECT script_name, req_count, req_per_sec, memory_footprint_total, req_time_median FROM report_by_script_name ORDER BY req_count DESC LIMIT 10; | script_name | req_count | req_per_sec | memory_footprint_total | req_time_median |
|---|---|---|---|---|
| [PROD] rest_api | 276508 | 4608.47 | 12916600000 | 0.0514983 |
| [PROD] embed_player | 162808 | 2713.47 | 8074990000 | 0.109837 |
| [PROD] cdn_director | 122526 | 2042.1 | 5103160000 | 0.0280768 |
| [PROD] widget_dispatch_v3 | 105822 | 1763.7 | 4349350000 | 0.049904 |
| [PROD] history_logger | 98481 | 1641.35 | 4060860000 | 0.0127946 |
| [PROD] video_item | 66250 | 1104.17 | 3563420000 | 0.254091 |
| [PROD] autocomplete_list | 56313 | 938.55 | 2322790000 | 0.0104993 |
| [PROD] webapp_ads_mopub | 52187 | 869.783 | 2183980000 | 0.0326299 |
| [PROD] gravity_report | 45992 | 766.533 | 1895290000 | 0.0167253 |
| [PROD] player_data | 33584 | 559.733 | 1724540000 | 0.113651 |
We can also calculate the average amount of allocated memory just by running a query.
memory_footprint_total/req_count AS avg_mem_footprint By default, the engine also consolidates metrics in several other convenient tables:
report_by_server_name;
report_by_hostname;
report_by_server_and_script;
report_by_hostname_and_server;
- report_by_hostname_server_and_script.
To obtain detailed information, use a table that combines data from several dimensions. These can be, for example, the most frequently used scripts on the host and server:
mysql> SELECT hostname, server_name, script_name, req_count, req_per_sec, req_time_median FROM report_by_hostname_server_and_script ORDER BY req_count DESC LIMIT 2; | hostname | server_name | script_name | req_count | req_per_sec | req_time_median |
|---|---|---|---|---|---|
| web-121 | api.dailymotion.com | [PROD] api_oauth_token | 4144 | 69.0667 | 0.0104435 |
| web-038 | api.dailymotion.com | [PROD] rest_api | 3455 | 57.5833 | 0.0441618 |
Collect your own metrics
As you can see, Pinba provides a lot of useful information without additional settings, but that's not all! In addition to report tables, you can use tag report tables *. Metrics are consolidated in these tables according to the tag values that you define in your code.
For example, in the old Dailymotion code base we have two kinds of tags:
I / O: any access from the outside, blocking the execution of the process (access to
servers like MySQL, Elastic, Redis, memcached or external API,
for example, Facebook or Twitter);- algo: the algorithms we want to watch.
For example, for memcache we use tags like this:
Client code
$pinbaTimer = $this->pinbaService->startTimer([ 'group' => 'memcached', 'memcached' => $this->pinba_pool, 'method' => 'get', 'namespace' => 'dm_cache' ]); $value = $this->memcache->get($this->prefix . $key); $this->pinbaService->stopTimer($pinbaTimer); Pinba service
public function startTimer(array $tags) { if (!$this->isPinbaInstalled) { return null; } $timerId = 't' . ++$this->incr; $this->timers[$timerId] = pinba_timer_start($tags); return $timerId; } public function stopTimer($timerId) { if ($this->isPinbaInstalled && isset($this->timers[$timerId])) { pinba_timer_stop($this->timers[$timerId]); unset($this->timers[$timerId]); } } Then we create custom tables in the Pinba database, using comments explaining to the engine what to store in them.
For example, this is how a table for storing metrics describing the use of memcached looks
CREATE TABLE `tag_report_memcached_method_namespace` ( `script_name` varchar(128) DEFAULT NULL, `memcached` varchar(64) DEFAULT NULL, `method` varchar(64) DEFAULT NULL, `namespace` varchar(64) DEFAULT NULL, `req_count` int(11) DEFAULT NULL, `req_per_sec` float DEFAULT NULL, `hit_count` int(11) DEFAULT NULL, `hit_per_sec` float DEFAULT NULL, `timer_value` float DEFAULT NULL, `timer_median` float DEFAULT NULL, `index_value` varchar(256) DEFAULT NULL ) ENGINE=PINBA DEFAULT CHARSET=latin1 COMMENT='tagN_report:memcached,method,namespace'; And so - a table for storing metrics about application I / O parameters:
CREATE TABLE `tag_report_group_method` ( `script_name` varchar(128) DEFAULT NULL, `group` varchar(64) DEFAULT NULL, `method` varchar(64) DEFAULT NULL, `req_count` int(11) DEFAULT NULL, `req_per_sec` float DEFAULT NULL, `hit_count` int(11) DEFAULT NULL, `hit_per_sec` float DEFAULT NULL, `timer_value` float DEFAULT NULL, `timer_median` float DEFAULT NULL, `index_value` varchar(256) DEFAULT NULL ) ENGINE=PINBA DEFAULT CHARSET=latin1 COMMENT='tag2_report:group,method'; Note to yourself: next time, do not use SQL reserved words (group, ...) as column names.
These tables allow us to obtain detailed statistical data, for example, about all I / O operations for a particular route:
mysql> SELECT `group`, SUM(req_count) AS req, AVG(timer_median) AS timer_median, SUM(timer_value)/SUM(hit_count) AS tph, SUM(timer_value)/SUM(req_count) AS tpr, SUM(timer_value) AS timer_total FROM tag_report_group_method WHERE script_name='[PROD]video_item' AND `group` != "int_api" GROUP BY `group` ORDER BY timer_total DESC; | group | req | timer_median | tph | tpr | timer_total |
|---|---|---|---|---|---|
| mysql | 118124 | 0.009819403290748596 | 0.003329653064723691 | 0.05909533790217434 | 6980.5776943564415 |
| memcached | 188049 | 0.00976656749844551 | 0.0003179184672595343 | 0.01067464985796328 | 2007.3572311401367 |
| Elastic | 32049 | 0.011334048118442297 | 0.016838098360988627 | 0.026841974640797184 | 860.2584452629089 |
| Redis | 48999 | 0.009611431136727333 | 0.011986066101148827 | 0.012204265879965226 | 597.9968238524161 |
| DMX | 61436 | 0.009767306968569756 | 0.0016191925102048436 | 0.0073448760845254615 | 451.23980712890625 |
| Curl | 24882 | 0.06987743234882753 | 0.008533559191620778 | 0.008533559191620778 | 212.3320198059082 |
| cleeng | 50 | 0.12915635108947754 | 0.1352721940790749 | 1.0902938842773438 | 54.51469421386719 |
| Facebook API | 22 | 0.5436198115348816 | 0.5515929568897594 | 0.5515929568897594 | 12.135045051574707 |
| Live API | one | 0.01953125 | 0.0049230000004172325 | 0.0049230000004172325 | 0.0049230000004172325 |
MySQL SELECT details:
mysql> SELECT mysql, method, timer_value, timer_value/req_count AS avg_timer_value, hit_count/req_count AS avg_op_count, timer_value/hit_count AS avg_op_value, hit_count, req_count FROM tag_report_mysql_method WHERE method='select' AND script_name='[PROD]video_item' AND req_count > 200 ORDER BY avg_op_count DESC LIMIT 4; | mysql | method | timer_value | avg_timer_value | avg_op_count | avg_op_value | hit_count | req_count |
|---|---|---|---|---|---|---|---|
| video | select | 3971.99 | 0.10144789052722653 | 16.6880 | 0.006079103953896177 | 653384 | 39153 |
| video_view_summary | select | 264.027 | 0.007824405328308366 | 12.6024 | 0.000620868312581275 | 425254 | 33744 |
| static_asset_video_sprite | select | 15.4905 | 0.022613802443455604 | 7.6496 | 0.0029561936400318875 | 5240 | 685 |
| video_has_repost | select | 1468.93 | 0.027541118671605483 | 6.7955 | 0.0040528553527407 | 362444 | 53336 |
We track the use of select queries. If their number becomes very large, it is possible that caching is performed inefficiently.
Additional features
We also use another interesting feature of Pinba - tags that allow you to distinguish between requests of different types. Requests are tagged with the tags you defined. For example, we use tags for the following queries:
format: response format (html, rss, atom, ...);
site_content: languages of site content (en, de, fr, jp, ru, ...);
bot: real client or bot? (yes / no);
auth: user authenticated (logged in)? (yes / no);
- provider: determine the differences between PHP versions: standard PHP or HHVM, etc.
Then we create the tables and in the comments for the engine specify what and where to store. For example, we can create a table based on report_by_script_name, in which the engine stores data only for PHP processes with a value of no for the bot request tag and a value of no for the auth request tag. In other words, these are real users who have not logged in to the system - a common situation.
CREATE TABLE `auth_no_bot_no_report_by_script_name` ( `req_count` int(11) DEFAULT NULL, `req_per_sec` float DEFAULT NULL, ... `req_time_median` float DEFAULT NULL, `index_value` varchar(256) DEFAULT NULL ) ENGINE=PINBA DEFAULT CHARSET=latin1 COMMENT='report1::tag.auth=no,tag.bot=no'; Plotting
Pinba only stores metrics for one or two minutes. Therefore, to plot data, you need to consolidate on external resources. Here we use collectd paired with the MySQL plugin. In doing so, queries are made to the Pinba database, and the results are stored in Whisper. We then query Whisper using Graphite and Tessera or Grafana.
Conclusion
Using Pinba with our outdated PHP application allowed us to:
detect possible sources of problems in the application;
identify errors (unreasonably large number of requests to servers on some routes);
- Build charts and set up alerts to detect performance degradation after release.
We also use Pinba in our Python projects. A specialized version of Pynba was created by our old friend (and now a colleague) johnnoone.
The only thing we noticed while using Pinba: the extension does not always correctly “forget” the information about old queries. Sometimes report tables contain phantom results - activity data that took place more than a minute ago. This can be a problem if you need to make sure with Pinba that something is not happening (usually after deploying a new code on production). This is one of the few cases when the cause of the error is not in your code.
The easiest way to fix it is to restart the Pinba engine. As a result, small gaps will appear on the graphs, but phantom data will definitely disappear. (Note: TRUNCATE TABLE doesn't suit you, as it is not MySQL engine.)
Useful Resources for Pinba Users
- GitHub: https://github.com/tony2001/pinba_engine
- Documentation: https://github.com/tony2001/pinba_engine/wiki
- Monitoring PHP code performance with Pinba:
https://habrahabr.ru/company/badoo/blog/149695/
')
Source: https://habr.com/ru/post/319934/
All Articles