Performance comparison of analytical HPE Vertica and Exasol DBMS using TPC-H Benchmark
 In this article I want to continue the topic of database comparison, which can be used to build a data warehouse (DWH) and analytics. Earlier, I described test results for the Oracle In-Memory Option and In-Memory RDBMS Exasol . This article will focus on Vertica DBMS. For all the tests described, tpc-h benchmark was used on a small amount of input data (2 GB) and the database configuration on one node. These restrictions allowed me to repeat the benchmark many times in different variations and with different settings. To select an analytical database for a specific project, I urge readers to test on their cases (data, requests, equipment, and other features).
Brief information about Vertica DBMS
Vertica is a relational analytic column-oriented MPP database. Habré has enough articles describing the main features of this DBMS (at the end of the article there are links to some of them), so I will not describe them and mention only a few, in my opinion, facts about Vertica:
- Facebook uses Vertica for its internal analytical tasks. 2 years ago there was a cluster of hundreds of servers and dozens of petabytes of data ... I did not find relevant information about this project, maybe someone will share a reliable link in the comments.
- Vertica was developed by a team led by Michael Stonebreaker (originally called the C-Store ). It was written from scratch specifically for analytical tasks, taking into account Michael's large previous experience (Ingres, Postgres, Informix and other DBMS). To compare the approaches, we can recall Vertica's competitor Greenplum (now owned by Dell), this is an MPP DBMS, which is based on a modified PostgreSQL database.
') - In 2016, Hewlett-Packard Enterprise (HPE) sold its software business with Micro Focus to Vertica. How this will affect the development of Vertica is not yet clear, but I really hope that this deal will not destroy a great product.
- In the context of comparison with Exasol, it is important to note that Vertica is not an in-memory database and, moreover, Vertica does not have a buffer pool . That is, the database is intended primarily for processing data volumes that significantly exceed the size of the RAM, and by refusing to support the buffer cache, you can save a significant portion of server resources. At the same time, Vertica effectively uses the file system features and in particular caching.
TPC-H Benchmark
For those who have not read my previous 2 articles, I will briefly describe the tpc-h benchmark . It is designed to compare the performance of analytical systems and data warehouses. This benchmark is used by many manufacturers of both DBMS and server hardware. There are many results available on the tpc-h page, for publication of which it is necessary to fulfill all requirements of the specification on 136 pages. I did not intend to publish my tests officially, so I did not strictly follow all the rules. I note that in the ranking there is no test DBMS Vertica.
TPC-H allows you to generate data for 8 tables using the specified scale factor , which determines the approximate amount of data in gigabytes. For all tests which results I publish, I was limited to 2 GB.

The benchmark includes 22 SQL queries of varying complexity. I note that the queries generated by the qgen utility need to be adjusted for the features of a specific DBMS, but like Exasol, Vertica supports ANSI SQL-99 standard and all queries for these 2 DBMS were absolutely identical. For the test, 2 types of load were generated:
- 8 virtual users in parallel 3 times in a circle perform all 22 requests
- 2 virtual users in parallel 12 times in a circle perform all 22 requests
As a result, in both cases, the execution time of 528 SQL queries was estimated.
Test pad
A laptop with the following features:
Intel Core i5-4210 CPU 1.70GHz - 4 virt. processors; DDR3 16 Gb; SSD Disk.
OS:
MS Windows 8.1 x64
VMware Workstation 12 Player
Virtual OS: Ubuntu 14.04.4 x64 (Memory: 8 Gb; Processors: 4)
DBMS:
Vertica Analytic Database v7.2.2-1 ( single node )
Physical data model in Vertica
Disk space and query performance in Vertica is highly dependent on the sort order and the projection column compression algorithm. Based on this, I performed my tests in several stages. At the first stage, only super projections were created in this way:
CREATE TABLE ORDERS ( O_ORDERKEY INT NOT NULL, O_CUSTKEY INT NOT NULL, O_ORDERSTATUS CHAR(1) NOT NULL, O_TOTALPRICE NUMERIC(15,2) NOT NULL, O_ORDERDATE DATE NOT NULL, O_ORDERPRIORITY CHAR(15) NOT NULL, O_CLERK CHAR(15) NOT NULL, O_SHIPPRIORITY INT NOT NULL, O_COMMENT VARCHAR(79) NOT NULL) PARTITION BY (date_part('year', ORDERS.O_ORDERDATE)); The two most voluminous ORDERS and LINEITEM tables were partitioned by year. Since the benchmark was conducted at 1 node, there was no segmentation (sharding). At subsequent stages, the physical structure was optimized using the Database Designer, more on this below.
Data upload to Vertica
To load data from a text file, I used the following script:
COPY tpch.lineitem FROM LOCAL 'D:\lineitem.tbl' exceptions 'D:\l_error.log'; Download time for all files was 5 minutes. 21 sec (in Exasol 3 min. 37 sec.). In this way, data is initially loaded line by line into RAM in WOS containers (default wosdata pool settings: maxmemorysize = 25% ), then automatically to disk in a row in ROS containers. I also tested downloading from files and from Oracle using the Pentaho DI ETL tool (aka Kettle), it turns out much slower even with a special plug-in for Vertica.
Test results
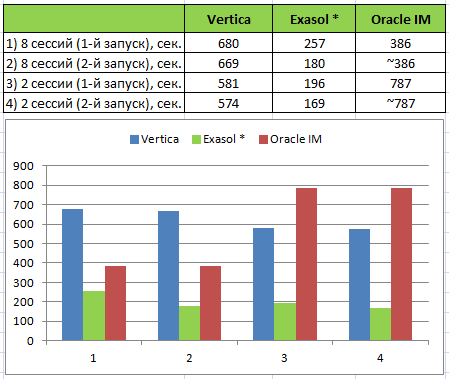
* In the previous test, the execution of queries in Exasol took significantly less time due to caching the results (some of the queries in the test do not change, for a part, the values of the parameters are generated). In Vertica, there is no such caching and for equalizing chances, I have disabled it in Exasol:
alter session set QUERY_CACHE = 'OFF'; Vertica Testing Sequence
Stage 1. 1st start
The first run of the test was performed after loading the data into super projections without collecting statistics . The execution time was 581 seconds for 2 sessions and 680 seconds for 8 sessions. When you re-run, the time is reduced minimally (see the table above).
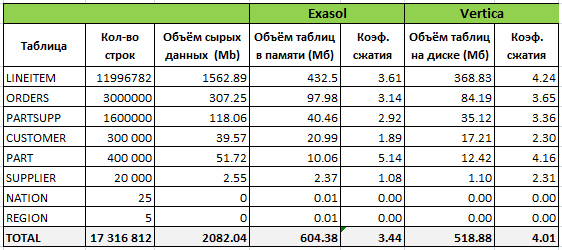
The following table provides information on how the data was organized in Exasol and Vertica after the initial load:
Request for information on disk space and memory in Vertica:
SELECT ANCHOR_TABLE_NAME, PROJECTION_NAME, USED_BYTES/1024/1024 as USED_Mb, ROS_USED_BYTES/1024/1024 as ROS_Mb, WOS_USED_BYTES/1024/1024 as WOS_Mb FROM PROJECTION_STORAGE WHERE ANCHOR_TABLE_SCHEMA='tpch' order by 1,3 desc; The table shows that Vertica compressed the data a little better, despite the fact that the projections were not created in an optimal way. In the process of testing, I also tried to optimize the structure using DB Designer based on the loaded data and excluding queries. The compression ratio was equal to 6.
Stage 2. Collecting statistics
After collecting statistics on the tables, the execution time unexpectedly increased by about 30%. An analysis of statistics and query execution plans showed that for most requests, the execution time decreased slightly or did not change, but significantly increased for a couple of requests. In these queries, multiple tables were joined, including ORDERS and LINEITEM , and the lower cost corresponded to a longer execution time.
Stage 3. Structure optimization using DB Designer
Comprehensive design was created with the Query perfomance (larger footprint) option based on the 21st query of the tpc-h benchmark (1 is skipped because the view is created for it before execution). The result is the following figures:
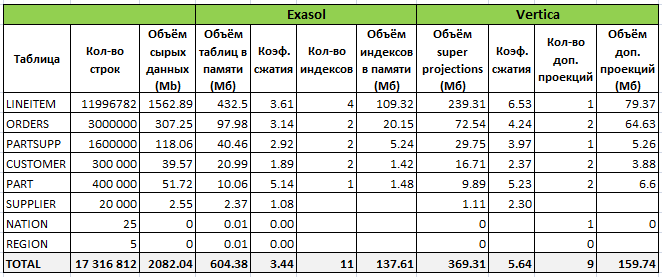
Thus, 9 additional projections were created, but the total amount of data on the disk almost did not change due to the structure optimization (the order of the columns and various compression algorithms). However, the new structure slowed down even more problematic requests and, accordingly, the total execution time.
Stage 4. Manual optimization
Considering my previous experience with Vertica on other data models (mostly star schema), I expected better results from the database, so I decided to look deeper into bottlenecks. For this, the following actions were performed:
- Analysis of statistics and query execution plans - system tables v_monitor: query_requests, query_plan_profiles, execution_engine_profiles, query_events;
- Analysis of database recommendations based on the result of the ANALYZE_WORKLOAD () function;
- Creating several additional projections;
- Change parameters for general pool.
All this did not bring significant results.
Next, the problem query was rewritten, which took about 30% of the execution time for all queries:
Request source code:
select nation, o_year, sum(amount) as sum_profit from ( select n_name as nation, extract(year from o_orderdate) as o_year, l_extendedprice * (1 - l_discount) - ps_supplycost * l_quantity as amount from part, supplier, lineitem, partsupp, orders, nation where s_suppkey = l_suppkey and ps_suppkey = l_suppkey and ps_partkey = l_partkey and p_partkey = l_partkey and o_orderkey = l_orderkey and s_nationkey = n_nationkey and p_name like '%thistle%' ) as profit group by nation, o_year order by nation, o_year desc; Rewrote request code using optimizer hint:
select /*+SYNTACTIC_JOIN */ n_name as nation, extract(year from o_orderdate) as o_year, sum(l_extendedprice * (1 - l_discount) - ps_supplycost * l_quantity) as amount from lineitem join orders on o_orderkey = l_orderkey join partsupp on ps_suppkey = l_suppkey and ps_partkey = l_partkey join part on p_partkey = l_partkey and p_name like '%thistle%' join supplier on s_suppkey = l_suppkey join nation on s_nationkey = n_nationkey group by n_name, extract(year from o_orderdate) order by 1, 2 desc; As a result, the query accelerated about 4 times.
As a result, the minimum test run time in 2 sessions with the structure created by DB Designer and the correction of 1 query was 531 seconds (the very first launch without optimizations lasted 581 seconds).
I stopped at this, since there was no goal to squeeze the maximum by rewriting requests, changing the model and other not entirely “honest” ways.
findings
This test once again confirms the rule that it is always necessary to choose the tools and implementation options that will be optimal for your specific task / project. The tpc-h benchmark with my given constraints is “inconvenient” for Vertica DBMS for the following reasons:
- All data was placed in RAM, and Vertica is not in-memory DB;
- Normalized tpc-h model and optimizer errors. When the priority requirement is the performance of ad-hoc queries, a denormalized model (for example, star schema) is better suited for the presentation storage layer in Vertica. A Exasol DB does an excellent job with the normalized model, which, in my opinion, is its great advantage, since it is possible to reduce the number of DWH layers.
Vertica is not overloaded with unnecessary functionality and is relatively simple to develop and administer, but Exasol in this regard is even simpler and does almost everything for you. What is better flexibility or simplicity depends on the specific task.
Vertica and Exasol license prices are comparable, and free versions with restrictions are available. In the process of choosing an analytical database, I would recommend to consider both products.
Useful links about Vertica
- An overview of the architecture and main features;
- Most of all share practical experience in Russian, probably, Alexey Konstantinov ascrus . Thanks to him for this, I recommend all his publications on Habré and in the blog ;
- Introductory article and practical experience from alexzaitsev ;
- The choice of methodology for storage on Vertica from Nicholas Head azathot . An interesting and unexpected choice for Vertica is Anchor Modeling (6 NF). Nikolay often shares practical experience at various events, for example, at Higload ++ or HPE conferences ;
- Official on-line documentation with many examples;
- A brief article about what is not in Vertica, but what many are looking for.
Thank you for your attention, Teradata is one of the leaders among the analytical databases .
Source: https://habr.com/ru/post/319902/
All Articles