Hey request! Are you alive? How to easily handle locks in PostgreSQL
Good time of day! Administration and maintenance of relational databases is often a non-trivial task. Sometimes queries that worked quickly suddenly begin to “slow down” for unknown reasons, the size of the tables grows and overall database performance decreases.
Often the reason for this behavior is blocking various resources that occur in the database, and, accordingly, the increased waiting time for these resources. For example, difficulties begin in situations where two or more queries in different sessions try to simultaneously change the same data in the tables or the structure of the table itself.
In order to understand the current situation, the DBA needs to understand which process is blocking and which process is blocked, and also be able to cancel or kill the blocking process and finally check the result.
')
In this article I want to touch on the topic of locks in PostgreSQL and talk about tools for working with them. But first, let's try to understand the topic itself.
What is the lock in the database? Wikipedia offers the following definition: “Lock (in English) lock ) in a DBMS is a mark about an object being captured by a transaction with limited or exclusive access in order to prevent collisions and maintain data integrity.”
PostgeSQL maintains data integrity by implementing the MVCC model. MVCC (MultiVersion Concurrency Control) is one of the mechanisms for providing parallel access to the database, which consists in providing each user with a so-called “snapshot” of the database. A special “property” of such a snapshot is that changes made by the user to the database are invisible to other users until the transaction is committed.
PostgreSQL guarantees integrity for even the strictest transaction isolation level using the innovative SSI isolation level (Serializable Snapshot Isolation).
For a better understanding of the topic, you can read the article on Habré and the article in the blog of Alexander Zhuravlev about locks, their work and competitive access in general.
Unfortunately, there are situations when the implemented mechanisms to ensure data integrity still cannot cope with incoming requests without the occurrence of locks. It happens rarely, but if there is a situation that any query has blocked a whole table for a long time, this can lead to trouble.
For example, if you start a long-running query to a table with 1000 entries, to which 100 UPDATE requests occur per second, in 5-6 hours the size of the table will increase to 1.8 million entries, respectively, the physical size of the table also increases (since the database stores all versions rows until a long transaction completes its work.
Consider this situation in more detail.
Suppose we have a pgsqlblocks_testing table in some database and it has a rule_pgsqlblocks_testing rule. We emulate to it a “long” query for 10 minutes, for example, using the pgAdmin SQL editor:
Pid of process 16728
Open another editor and execute another request to delete the rule:
Pid of process 16726
And here DROP RULE is blocked by SELECT request. MVCC in this case could not do without explicitly locking the pgsqlblocks_testing table.
How do we view the available locks? You can write your own query for the pg_locks lock table and the pg_stat_activity view, or use the tool built into pgAdmin.
pgAdmin is a fairly convenient and simple software for working with PostgreSQL databases. Currently, the current versions are pgAdmin III and pgAdmin IV, which was released only at the end of September.
Displaying information about locks and active processes in pgAdmin III requires the presence of the adminpack extension in the database. After installing this extension, the window we need opens via the Tools - Server Status menu.
In this window, we see a table with processes and a table with existing locks in the database. In order not to get lost among a large number of processes, we can adjust the colors of processes depending on their status: active, blocked, inactive, or “slow”.
In the table, each blocking and blocking process is represented by separate lines, and it is not possible to quickly determine who is blocking whom. To solve this problem, we will have to compare different strings among themselves in an attempt to find strings combined by the common value of the relation column and different values of the granted column.
To cancel or terminate the selected process in the window there are two buttons. After terminating any of the processes, you need to refresh the window and match the lines again in order to evaluate the result.
So, pgAdmin III can be used as a tool for working with locks, but it has a couple of drawbacks: it requires a preliminary DB setting and shows locks in a flat view (without a tree display of blocking-blocking processes), which complicates the search for problematic processes and the assessment of their termination. This makes it not the most convenient tool for our tasks.
After installing and running pgAdmin IV, we will be able to view the existing locks in the same way as in pgAdmin III.

But ... that's all we can do here. The pgAdmin IV has lost the toolbar for actions on processes, and we can no longer cancel or terminate processes from this view, which makes pgAdmin IV an inconvenient tool for working with locks.
There are many different implementations of queries on the network for viewing blocked and blocking queries in the database.
The first result in the search engine for the query “pg_locks monitoring” gives a link with the query variant:

Request 1:
Open the editor and enter the request to get information about locks:
It looks quite difficult, but the result is pleasing to the eye. In general, the PostgreSQL community has created and maintains a lot of resources that help and facilitate the search for information for ordinary database administrators. For example, the same wiki wiki.postgresql.org
So, we see who is blocking whom. There are more variants of such requests, where you can display information about how long the process has been waiting for its turn, and so on.
The second link (from official, by the way, documentation) offers a very simple request:
Request 2:
The meaning of all these variations is essentially the same query: displaying information about locks. We received the necessary information, but the answer does not lie directly on the surface. Especially if there are many queries to the database. Sit down and figure it out yourself, who is blocking whom and why! Not everyone can build a graph of blocked resources in his head!
In addition, we need to destroy or stop the blocking process. And yes, it will have to be done manually, through another request indicating the pid process -
or
To check the result, run Query 1 again or
I want to show you one more tool and share what it is so convenient with - pgSqlBlocks. The pgSqlBlocks tool was written by us for ourselves, and was created precisely in order to facilitate the solution of problems with locks in PostgreSQL, which we have been using for over a year.
This is what the pgSqlBlocks window looks like in the case of our two-process example (here they have pid 29981 (SELECT) and 28710 (DROP RULE)).
In the left part of the window there is a list of databases in which information on the connection to the database is displayed (connected, disconnected, updating information, connection error, there are locks in the database).
The main part of the application is occupied by the process tree that currently exists in the selected database. Blocked processes have an icon of a closed gray lock and are descendants of blocking processes, whose icon is a red lock. The normal process icon is a green dot.
Such a presentation of processes allows us to easily navigate in them, to obtain information about the blocking and waiting processes, as well as about their relationship to each other. It is possible for greater clarity to hide the usual (not blocked and not blocking) processes.
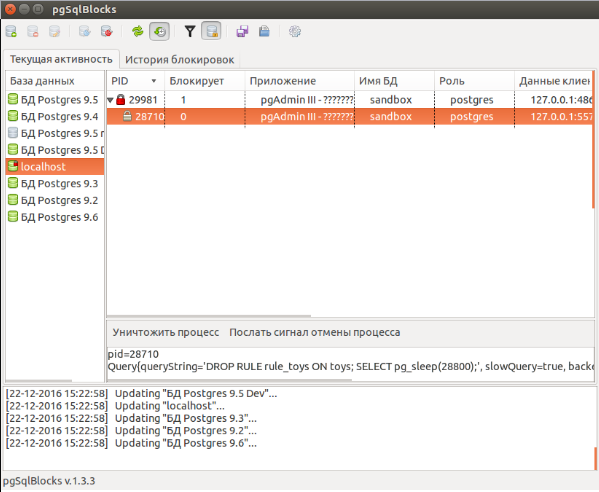
We clearly see that a process with pid 29981 with a long SELECT query blocks the process with pid 28710.
If necessary, you can send a signal to cancel or destroy any process. For example, if you destroy the blocked process 28710, the information in the process tree is immediately updated and we will see the result - the process 29981 with a long SELECT query does not block anyone else. Quick and convenient.
Another of the small and pleasant features of the application can be noted:
- Save lock history to file and download back to the application. A sort of snapshot of all locks at the time of saving, which allows you to view and analyze at any convenient time what locks were in the database;
- The tray icon changes if a lock appears in at least one of the connected databases;
- Notifications in the tray when blocking occurs;
- Customizable auto-update process list.
How to install pgSqlBlocks and how is it convenient compared to the options described above?
The system must have JRE 8 preinstalled.
Go to the address pgcodekeeper.ru/pgsqlblocks and select the latest current version of the program. The folder will contain 4 jar-files. Choose the one that is suitable for the OS and the digit capacity of your system. Download, run and voila!
This is all you need to run the application. Everything works out of the box.
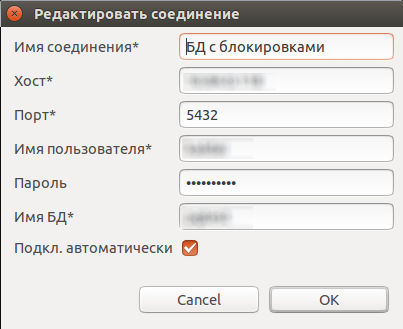
To start working with the application it is worth filling out the list with the databases. To add a new database, click the database icon with a "+" icon above the database list and fill in the necessary data in the dialog that appears. Password is best stored in the pgpass file.
Tested on PostgreSQL versions 9.2-9.6.
Additionally, you can configure the frequency of updating information from the database, the need to show idle processes, the list of displayed columns.
The problem of blocking queries in the database can be very serious and lead to a noticeable slowdown of the database and the exhaustion of disk space. Therefore, it is important to have a convenient and fast tool for detecting locks and taking (sometimes) operational actions.
Such a tool for us is pgSqlBlocks - an application that allows you to easily navigate among the processes and receive information about blocking and pending requests.
Its advantages include the visibility of the information provided, as well as the convenience of performing typical tasks - viewing information about processes, finding problems among the list of processes, canceling or terminating a process, and evaluating the result. In addition, a pleasant opportunity is to save the lock history to a file for further analysis of the current situation. All this makes your work with locks in the PostgreSQL database quick and easy.
PS: The MSSQL Blocks utility was the inspiration for creating this application. But it is designed specifically for working with the MSSQL database. For PostgreSQL, there were no analogues of it.
→ Download the latest version for your OS here .
Often the reason for this behavior is blocking various resources that occur in the database, and, accordingly, the increased waiting time for these resources. For example, difficulties begin in situations where two or more queries in different sessions try to simultaneously change the same data in the tables or the structure of the table itself.
In order to understand the current situation, the DBA needs to understand which process is blocking and which process is blocked, and also be able to cancel or kill the blocking process and finally check the result.
')
In this article I want to touch on the topic of locks in PostgreSQL and talk about tools for working with them. But first, let's try to understand the topic itself.
It is a little theory: an educational program about locks
What is the lock in the database? Wikipedia offers the following definition: “Lock (in English) lock ) in a DBMS is a mark about an object being captured by a transaction with limited or exclusive access in order to prevent collisions and maintain data integrity.”
PostgeSQL maintains data integrity by implementing the MVCC model. MVCC (MultiVersion Concurrency Control) is one of the mechanisms for providing parallel access to the database, which consists in providing each user with a so-called “snapshot” of the database. A special “property” of such a snapshot is that changes made by the user to the database are invisible to other users until the transaction is committed.
PostgreSQL guarantees integrity for even the strictest transaction isolation level using the innovative SSI isolation level (Serializable Snapshot Isolation).
For a better understanding of the topic, you can read the article on Habré and the article in the blog of Alexander Zhuravlev about locks, their work and competitive access in general.
Unexpected situations
Unfortunately, there are situations when the implemented mechanisms to ensure data integrity still cannot cope with incoming requests without the occurrence of locks. It happens rarely, but if there is a situation that any query has blocked a whole table for a long time, this can lead to trouble.
For example, if you start a long-running query to a table with 1000 entries, to which 100 UPDATE requests occur per second, in 5-6 hours the size of the table will increase to 1.8 million entries, respectively, the physical size of the table also increases (since the database stores all versions rows until a long transaction completes its work.
Consider this situation in more detail.
Blocking example
Suppose we have a pgsqlblocks_testing table in some database and it has a rule_pgsqlblocks_testing rule. We emulate to it a “long” query for 10 minutes, for example, using the pgAdmin SQL editor:
SELECT * FROM public.pgsqlblocks_testing LIMIT 1000; SELECT pg_sleep(600); Pid of process 16728
Open another editor and execute another request to delete the rule:
DROP RULE rule_pgsqlblocks_testing ON public.pgsqlblocks_testing; Pid of process 16726
And here DROP RULE is blocked by SELECT request. MVCC in this case could not do without explicitly locking the pgsqlblocks_testing table.
Tools for working with locks
How do we view the available locks? You can write your own query for the pg_locks lock table and the pg_stat_activity view, or use the tool built into pgAdmin.
PgAdmin server status
pgAdmin is a fairly convenient and simple software for working with PostgreSQL databases. Currently, the current versions are pgAdmin III and pgAdmin IV, which was released only at the end of September.
pgAdmin III
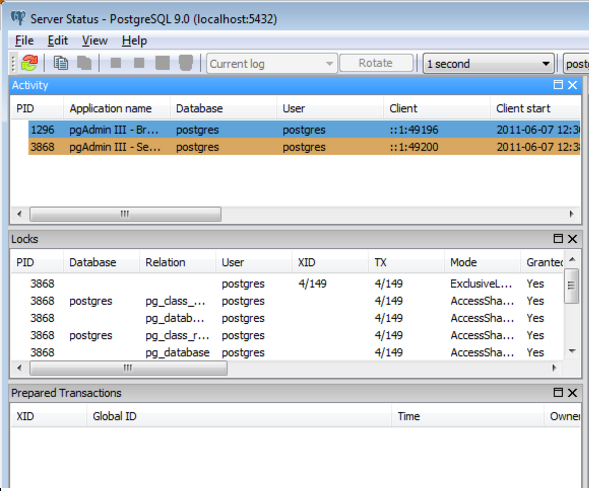
Displaying information about locks and active processes in pgAdmin III requires the presence of the adminpack extension in the database. After installing this extension, the window we need opens via the Tools - Server Status menu.
In this window, we see a table with processes and a table with existing locks in the database. In order not to get lost among a large number of processes, we can adjust the colors of processes depending on their status: active, blocked, inactive, or “slow”.
In the table, each blocking and blocking process is represented by separate lines, and it is not possible to quickly determine who is blocking whom. To solve this problem, we will have to compare different strings among themselves in an attempt to find strings combined by the common value of the relation column and different values of the granted column.
To cancel or terminate the selected process in the window there are two buttons. After terminating any of the processes, you need to refresh the window and match the lines again in order to evaluate the result.
So, pgAdmin III can be used as a tool for working with locks, but it has a couple of drawbacks: it requires a preliminary DB setting and shows locks in a flat view (without a tree display of blocking-blocking processes), which complicates the search for problematic processes and the assessment of their termination. This makes it not the most convenient tool for our tasks.
pgAdmin IV
After installing and running pgAdmin IV, we will be able to view the existing locks in the same way as in pgAdmin III.
But ... that's all we can do here. The pgAdmin IV has lost the toolbar for actions on processes, and we can no longer cancel or terminate processes from this view, which makes pgAdmin IV an inconvenient tool for working with locks.
Queries to the database
There are many different implementations of queries on the network for viewing blocked and blocking queries in the database.
The first result in the search engine for the query “pg_locks monitoring” gives a link with the query variant:
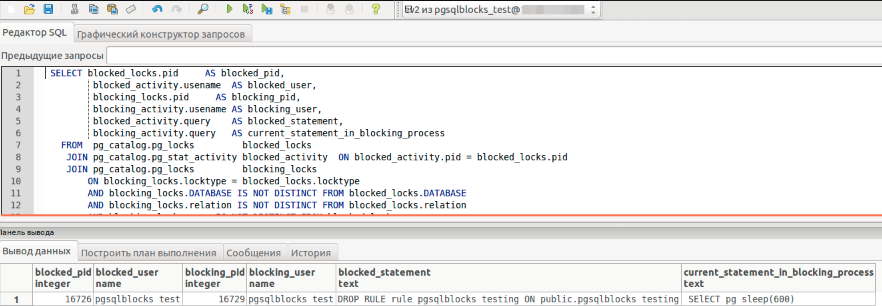
Request 1:
SELECT blocked_locks.pid AS blocked_pid, blocked_activity.usename AS blocked_user, blocking_locks.pid AS blocking_pid, blocking_activity.usename AS blocking_user, blocked_activity.query AS blocked_statement, blocking_activity.query AS current_statement_in_blocking_process FROM pg_catalog.pg_locks blocked_locks JOIN pg_catalog.pg_stat_activity blocked_activity ON blocked_activity.pid = blocked_locks.pid JOIN pg_catalog.pg_locks blocking_locks ON blocking_locks.locktype = blocked_locks.locktype AND blocking_locks.DATABASE IS NOT DISTINCT FROM blocked_locks.DATABASE AND blocking_locks.relation IS NOT DISTINCT FROM blocked_locks.relation AND blocking_locks.page IS NOT DISTINCT FROM blocked_locks.page AND blocking_locks.tuple IS NOT DISTINCT FROM blocked_locks.tuple AND blocking_locks.virtualxid IS NOT DISTINCT FROM blocked_locks.virtualxid AND blocking_locks.transactionid IS NOT DISTINCT FROM blocked_locks.transactionid AND blocking_locks.classid IS NOT DISTINCT FROM blocked_locks.classid AND blocking_locks.objid IS NOT DISTINCT FROM blocked_locks.objid AND blocking_locks.objsubid IS NOT DISTINCT FROM blocked_locks.objsubid AND blocking_locks.pid != blocked_locks.pid JOIN pg_catalog.pg_stat_activity blocking_activity ON blocking_activity.pid = blocking_locks.pid WHERE NOT blocked_locks.GRANTED; Open the editor and enter the request to get information about locks:
It looks quite difficult, but the result is pleasing to the eye. In general, the PostgreSQL community has created and maintains a lot of resources that help and facilitate the search for information for ordinary database administrators. For example, the same wiki wiki.postgresql.org
So, we see who is blocking whom. There are more variants of such requests, where you can display information about how long the process has been waiting for its turn, and so on.
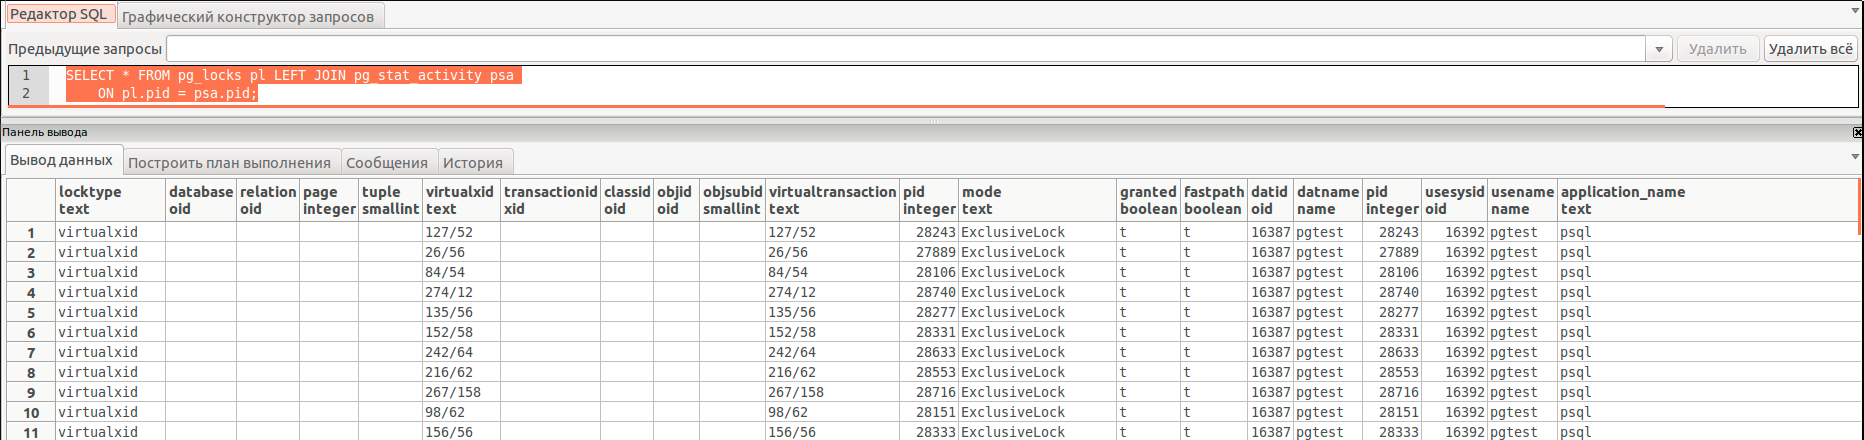
The second link (from official, by the way, documentation) offers a very simple request:
Request 2:
SELECT * FROM pg_locks pl LEFT JOIN pg_stat_activity psa ON pl.pid = psa.pid; The meaning of all these variations is essentially the same query: displaying information about locks. We received the necessary information, but the answer does not lie directly on the surface. Especially if there are many queries to the database. Sit down and figure it out yourself, who is blocking whom and why! Not everyone can build a graph of blocked resources in his head!
In addition, we need to destroy or stop the blocking process. And yes, it will have to be done manually, through another request indicating the pid process -
select pg_backend_pid(16728); or
select pg_terminate_backend(16728); To check the result, run Query 1 again or
SELECT * FROM pg_catalog.pg_stat_activity WHERE pid=16728; .Everything is simple and convenient with pgSqlBlocks!
I want to show you one more tool and share what it is so convenient with - pgSqlBlocks. The pgSqlBlocks tool was written by us for ourselves, and was created precisely in order to facilitate the solution of problems with locks in PostgreSQL, which we have been using for over a year.
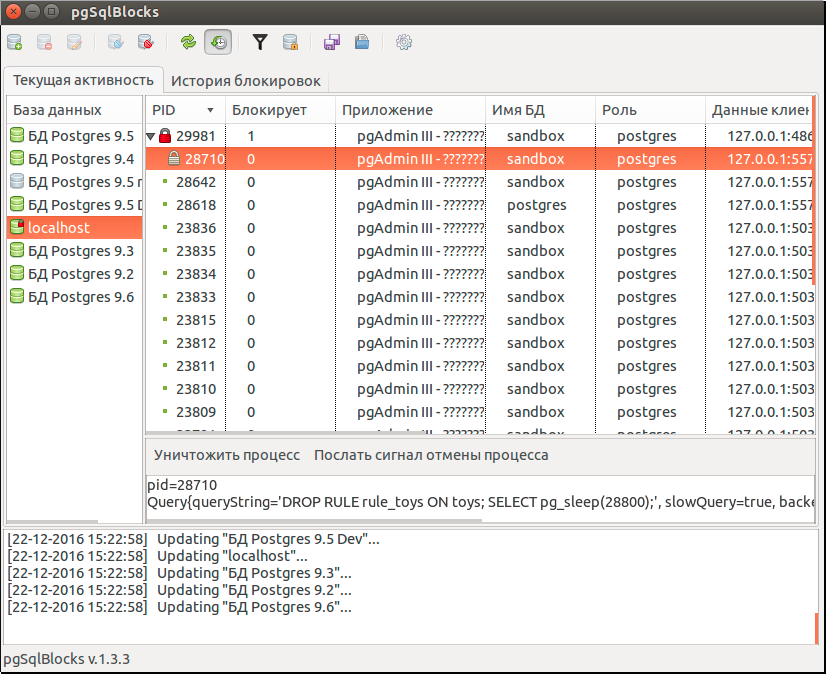
This is what the pgSqlBlocks window looks like in the case of our two-process example (here they have pid 29981 (SELECT) and 28710 (DROP RULE)).
In the left part of the window there is a list of databases in which information on the connection to the database is displayed (connected, disconnected, updating information, connection error, there are locks in the database).
The main part of the application is occupied by the process tree that currently exists in the selected database. Blocked processes have an icon of a closed gray lock and are descendants of blocking processes, whose icon is a red lock. The normal process icon is a green dot.
Such a presentation of processes allows us to easily navigate in them, to obtain information about the blocking and waiting processes, as well as about their relationship to each other. It is possible for greater clarity to hide the usual (not blocked and not blocking) processes.
We clearly see that a process with pid 29981 with a long SELECT query blocks the process with pid 28710.
If necessary, you can send a signal to cancel or destroy any process. For example, if you destroy the blocked process 28710, the information in the process tree is immediately updated and we will see the result - the process 29981 with a long SELECT query does not block anyone else. Quick and convenient.
Another of the small and pleasant features of the application can be noted:
- Save lock history to file and download back to the application. A sort of snapshot of all locks at the time of saving, which allows you to view and analyze at any convenient time what locks were in the database;
- The tray icon changes if a lock appears in at least one of the connected databases;
- Notifications in the tray when blocking occurs;
- Customizable auto-update process list.
How to install pgSqlBlocks and how is it convenient compared to the options described above?
Installation and Setup
The system must have JRE 8 preinstalled.
Go to the address pgcodekeeper.ru/pgsqlblocks and select the latest current version of the program. The folder will contain 4 jar-files. Choose the one that is suitable for the OS and the digit capacity of your system. Download, run and voila!
This is all you need to run the application. Everything works out of the box.
To start working with the application it is worth filling out the list with the databases. To add a new database, click the database icon with a "+" icon above the database list and fill in the necessary data in the dialog that appears. Password is best stored in the pgpass file.
Tested on PostgreSQL versions 9.2-9.6.
Additionally, you can configure the frequency of updating information from the database, the need to show idle processes, the list of displayed columns.
Conclusion
The problem of blocking queries in the database can be very serious and lead to a noticeable slowdown of the database and the exhaustion of disk space. Therefore, it is important to have a convenient and fast tool for detecting locks and taking (sometimes) operational actions.
Such a tool for us is pgSqlBlocks - an application that allows you to easily navigate among the processes and receive information about blocking and pending requests.
Its advantages include the visibility of the information provided, as well as the convenience of performing typical tasks - viewing information about processes, finding problems among the list of processes, canceling or terminating a process, and evaluating the result. In addition, a pleasant opportunity is to save the lock history to a file for further analysis of the current situation. All this makes your work with locks in the PostgreSQL database quick and easy.
PS: The MSSQL Blocks utility was the inspiration for creating this application. But it is designed specifically for working with the MSSQL database. For PostgreSQL, there were no analogues of it.
→ Download the latest version for your OS here .
Source: https://habr.com/ru/post/319832/
All Articles