Monitoring of engineering infrastructure in the data center. Part 1. Highlights
Part 1. Monitoring of engineering infrastructure in the data center. Highlights.
Part 2. How is the monitoring of power supply in the data center.
Part 3. Monitoring of cold supply by the example of the NORD-4 data center.
Part 4. Network infrastructure: physical equipment.
We promised an article about the monitoring device in the data center in September. The topic is extensive, one article does not get rid of, so we decided to make a series of posts. Let's start with the basic points about which it is important to remember when designing and setting up monitoring. Then we will dwell on the main engineering systems (power supply and cold supply) and tell you about the tools for their monitoring.
In the articles we will share our experience, the fact that we tried and use ourselves in our own data centers. We do not pretend to be complete, but everything will be from life, not from the textbook.
')
In the comments, you can try to influence the editorial policy and suggest aspects of monitoring that are interesting for you.
We sort of dealt with organizational issues, let's start the monitoring alphabet in the DataLine edition :). So, today we will talk about conceptual things that need to be considered at the design stage, implementation and adjustment of the monitoring system. We consider the subject on the example of our monitoring, built on the basis of Nagios and Cacti.
In this series of articles we will talk about “classic” monitoring, i.e. without automated control.
Monitoring can be interpreted in different ways: as a system and as a process. In our case, these are two sides of the same coin - one cannot exist without the other.
Monitoring how the system helps to continuously collect, store and analyze the parameters of equipment and systems. It provides data on the basis of which the engineer draws conclusions about the current state and possible future behavior of the observed object.
The monitoring system provides only introductory information, then it is up to people and processes. Clear regulations in normal and emergency situations, a built-in notification system for responsible persons - all this makes monitoring from a simple data collection into a useful tool for managing the infrastructure.
At the same time, when you start designing the engineering infrastructure. If you are engaged in monitoring after the launch of the data center, then for some time the operation service will work blindly. On-duty engineers will not be able to track errors in the operation of the equipment, will miss the emergency situations. The only available way to monitor in this situation is the physical bypass of all engineering systems and IT equipment.
Example 1: the data center was put into operation. The first months the hall was almost empty and only one of the three air conditioners worked. With the filling of the hall, the temperature in the hall increased. Since there is no monitoring, it will be difficult for the operational service to determine when to turn on the second, and in case of an accident, the backup one.
It will be difficult and sometimes impossible to make up the monitoring gap during the operational phase without stopping the server or data center. For example, to install current analyzers in switchboards, one would have to disconnect at least one beam. In the worst case, there may be no space for them, then a completely new cabinet will need to be upgraded or changed altogether.
There is a good expression: it is impossible to control that which cannot be measured. This is just about the operation of engineering infrastructure without monitoring. Think over monitoring in advance.
Monitoring of engineering infrastructure should be conducted at three levels where possible: autonomous sensors, equipment and systems in general.
By autonomous sensors, we primarily mean leakage sensors, temperature sensors, volume and motion sensors.
Equipment should be monitored whenever possible: UPS, DGS, air conditioners, PDU, AVR, cameras, etc. For each, it is important to receive the following information:
It is not enough to keep track of each piece of equipment in isolation. To understand the big picture, track the system entirely . So you can see the interconnection of equipment in a single chain, and it will be easier to understand at what stage the malfunction occurred. Equipment interconnections in the system can be visualized with the help of schematic diagrams.
Example 2: the switchboard in the engine room is turned off. If we monitor the equipment separately, it will take time to understand the source of the breakdown - the shield or the UPS from which it is powered. If we have a diagram of the whole system before our eyes, then we will quickly see a weak link.

A power supply system diagram showing all the equipment in one chain.
As we determine the objects and parameters of monitoring, we compile the system documentation. In it we fix:
This is also best done at the design stage so that the operation service has complete documentation from the very beginning and they understand:
Without such a cheat sheet, the operations department will have to investigate the monitoring system again.
Under monitoring, it is better to use separate server and network equipment with a dedicated network segment.
Servers should be reserved so that when one of the servers fails, monitoring continues to work on the second. Very well, if the cluster servers are spaced apart in different machine halls. In one of the following posts we will consider in detail the structure and operation of such a cluster.
The monitors to which the circuits are displayed, the notifications must also be connected to uninterrupted power with a reserve. The network also - power sockets are connected to different switches. So the engineers on duty will not be left alone extinct screens, when something interesting happens in the data center.
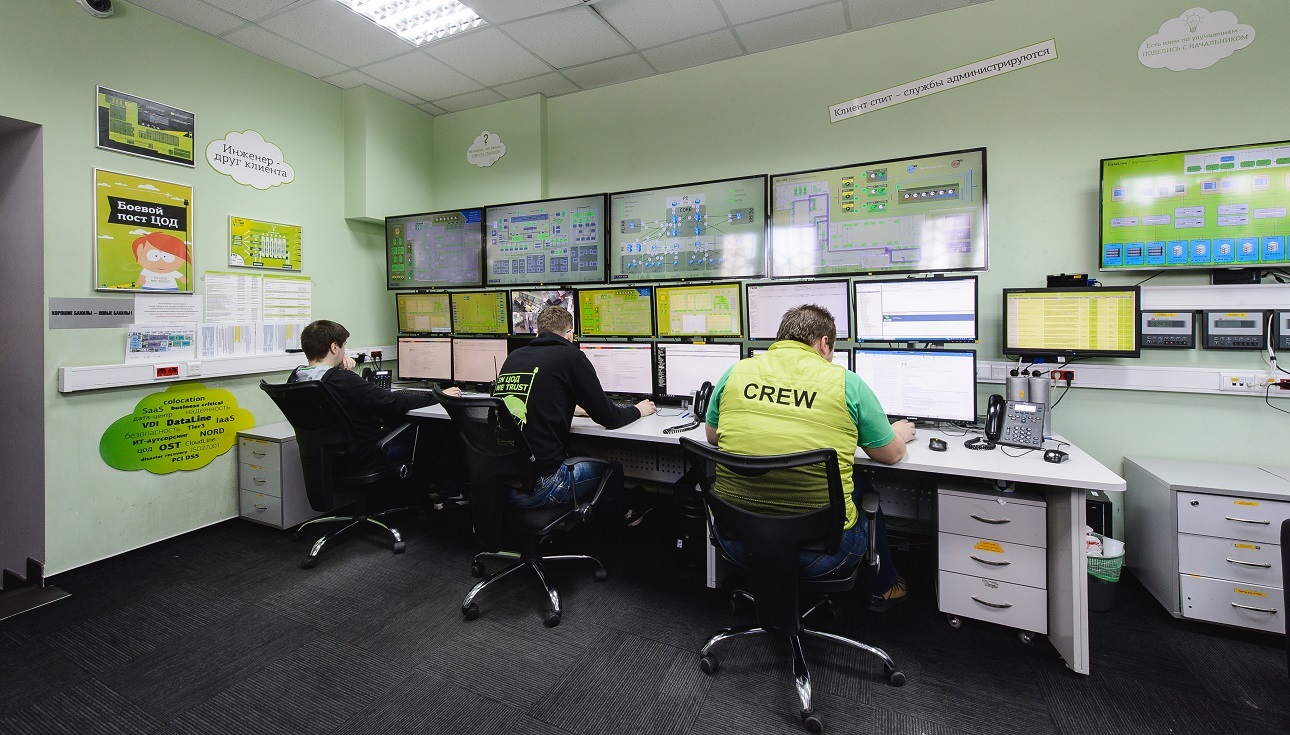
All information from sensors, equipment and systems must be reduced to a single interface and selectively displayed on screens in the monitoring center.
All this farm should be monitored around the clock at least one engineer on duty. Here, all notifications are recorded in the form of incidents on responsible persons or departments.
This is a kind of MCC and the first line of defense in the event of an accident in the data center.

The monitoring center at the site OST.
In each profile department, you can additionally hang up screens with diagrams and alerts that fall within the area of responsibility of this department: for operation engineers - some screens, for networkers - others.
You can follow the work of the data center only with the help of notifications, but for clarity, the main engineering systems and their parameters should be visualized in the form of diagrams and maps.

Summary of the data center OST-2.
With the scheme, it will be easier for the engineer on duty to understand in which machine room the broken air conditioner is located, what happens to the temperature in the nearest cold corridor. In addition, visualization provides an opportunity to see the relationship between the individual elements of the engineering system and quickly identify the source of the problem.
Consider the specifics of engineering systems when setting up a polling time. For a power supply system, the more often the readings are taken, the better. For example, in our monitoring, the voltage values are removed every second. And for air conditioners, this is too often, a minute interval is enough.
Set different polling times for different systems. So you do not miss important events and do not overload the system with too frequent requests.
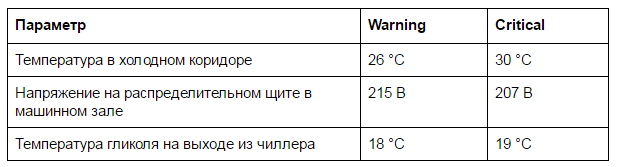
Record the critical values at which the alerts will be triggered. It is better to provide at least two levels of alert - warnings and critical errors. In Nagios, for example, this separation corresponds to warning and critical:
Proper separation of notifications will reduce the number of false alarms. It is difficult to draw a clear line between warning and critical, but understanding comes with experience. If the monitor is permanently red from accidents, then something is configured incorrectly. For an engineer, such monitoring will quickly become uninformative, false alarms will occur, and real accidents may go unnoticed among routine alerts.
If necessary, adjust the threshold values for different types of notifications.
Warning and alarm examples
All accident reports must be current. If the accident message hangs on the screen, it means that it has just happened. As soon as this notice is registered as an incident to the person in charge, it should disappear from the screen.
It is important not to miss the accident, but it is even more important to react to it correctly and start the incident response process.
The engineer on duty should have a clear instruction on which he acts, and contacts of people who need to be notified in case of an emergency.
All information must be before the eyes and clearly formulated so that the engineer does not have to waste time searching or deciphering the instruction points.
For the convenience of engineers on duty, each notification can be accompanied by a pop-up tip with the contacts of the responsible person and instructions. Regulations are prescribed in advance and checked for viability during routine testing.
Do not force the engineer on duty to come up with a plan of action from scratch when there is an accident in the data center.
A thing useful when used correctly. For small server-based such alerts, I can replace the round-the-clock duty engineer. In a large data center is a kind of reservation engineer on duty. But here it is important not to overdo it and not to send notifications to responsible persons on any sneeze.
If there are a lot of alerts for non-critical errors (we called them warning above), then over time they will simply be ignored, and a serious accident will go unnoticed.
In addition to online monitoring, it is useful to collect and long-term statistics. This will allow to evaluate the parameters in dynamics, to identify the values leading to emergencies. With this statistics, it is possible to draw conclusions on the operation of equipment under different loads, different weather conditions. The same information is then used for debriefing after accidents.
These are all points that we would like to note separately before embarking on stories about monitoring specific engineering systems. In the next article we will discuss what and how to monitor the power supply system of the data center and the server.
Part 2. How is the monitoring of power supply in the data center.
Part 3. Monitoring of cold supply by the example of the NORD-4 data center.
Part 4. Network infrastructure: physical equipment.
We promised an article about the monitoring device in the data center in September. The topic is extensive, one article does not get rid of, so we decided to make a series of posts. Let's start with the basic points about which it is important to remember when designing and setting up monitoring. Then we will dwell on the main engineering systems (power supply and cold supply) and tell you about the tools for their monitoring.
In the articles we will share our experience, the fact that we tried and use ourselves in our own data centers. We do not pretend to be complete, but everything will be from life, not from the textbook.
')
In the comments, you can try to influence the editorial policy and suggest aspects of monitoring that are interesting for you.
We sort of dealt with organizational issues, let's start the monitoring alphabet in the DataLine edition :). So, today we will talk about conceptual things that need to be considered at the design stage, implementation and adjustment of the monitoring system. We consider the subject on the example of our monitoring, built on the basis of Nagios and Cacti.
What is monitoring
In this series of articles we will talk about “classic” monitoring, i.e. without automated control.
Monitoring can be interpreted in different ways: as a system and as a process. In our case, these are two sides of the same coin - one cannot exist without the other.
Monitoring how the system helps to continuously collect, store and analyze the parameters of equipment and systems. It provides data on the basis of which the engineer draws conclusions about the current state and possible future behavior of the observed object.
The monitoring system provides only introductory information, then it is up to people and processes. Clear regulations in normal and emergency situations, a built-in notification system for responsible persons - all this makes monitoring from a simple data collection into a useful tool for managing the infrastructure.
When you need to bother with the monitoring system
At the same time, when you start designing the engineering infrastructure. If you are engaged in monitoring after the launch of the data center, then for some time the operation service will work blindly. On-duty engineers will not be able to track errors in the operation of the equipment, will miss the emergency situations. The only available way to monitor in this situation is the physical bypass of all engineering systems and IT equipment.
Example 1: the data center was put into operation. The first months the hall was almost empty and only one of the three air conditioners worked. With the filling of the hall, the temperature in the hall increased. Since there is no monitoring, it will be difficult for the operational service to determine when to turn on the second, and in case of an accident, the backup one.
It will be difficult and sometimes impossible to make up the monitoring gap during the operational phase without stopping the server or data center. For example, to install current analyzers in switchboards, one would have to disconnect at least one beam. In the worst case, there may be no space for them, then a completely new cabinet will need to be upgraded or changed altogether.
There is a good expression: it is impossible to control that which cannot be measured. This is just about the operation of engineering infrastructure without monitoring. Think over monitoring in advance.
What you need to follow
Monitoring of engineering infrastructure should be conducted at three levels where possible: autonomous sensors, equipment and systems in general.
By autonomous sensors, we primarily mean leakage sensors, temperature sensors, volume and motion sensors.
- Leak sensors are always needed, especially if the data center uses a cooling system with a heat transfer fluid or a freon one with moisture. We place them under each air conditioner, node and tap of the pipeline, i.e. in those places where it can drip.
- temperature sensors are installed in cold and hot corridors of machine rooms, in rooms with engineering infrastructure (pump rooms, rooms of the battery, MSB, etc.).
- sensors of volume / movement, opening and closing of doors of racks. Unlike previous ones, they are optional. They can be used in halls or for a group of racks, enclosed by a fence (cage).
Equipment should be monitored whenever possible: UPS, DGS, air conditioners, PDU, AVR, cameras, etc. For each, it is important to receive the following information:
- does it work;
- what mistakes occur in the work;
- the values of individual parameters (voltage in the UPS, amperage, fuel level in the diesel generator set tank, temperature at the inlet and outlet of the air conditioner, fan speed, etc.).
It is not enough to keep track of each piece of equipment in isolation. To understand the big picture, track the system entirely . So you can see the interconnection of equipment in a single chain, and it will be easier to understand at what stage the malfunction occurred. Equipment interconnections in the system can be visualized with the help of schematic diagrams.
Example 2: the switchboard in the engine room is turned off. If we monitor the equipment separately, it will take time to understand the source of the breakdown - the shield or the UPS from which it is powered. If we have a diagram of the whole system before our eyes, then we will quickly see a weak link.
A power supply system diagram showing all the equipment in one chain.
Monitoring documentation
As we determine the objects and parameters of monitoring, we compile the system documentation. In it we fix:
- list of sensors and equipment for monitoring;
- the place of their installation;
- monitored parameters and specific values;
- wiring diagrams;
- thresholds for emergency notifications
This is also best done at the design stage so that the operation service has complete documentation from the very beginning and they understand:
- Are all objects of interest monitored?
- where to look for a problem in case of a failure of the monitoring system itself;
- what threshold values are used.
Without such a cheat sheet, the operations department will have to investigate the monitoring system again.
Independence and redundancy monitoring system
Under monitoring, it is better to use separate server and network equipment with a dedicated network segment.
Servers should be reserved so that when one of the servers fails, monitoring continues to work on the second. Very well, if the cluster servers are spaced apart in different machine halls. In one of the following posts we will consider in detail the structure and operation of such a cluster.
The monitors to which the circuits are displayed, the notifications must also be connected to uninterrupted power with a reserve. The network also - power sockets are connected to different switches. So the engineers on duty will not be left alone extinct screens, when something interesting happens in the data center.
Unified monitoring center
All information from sensors, equipment and systems must be reduced to a single interface and selectively displayed on screens in the monitoring center.
All this farm should be monitored around the clock at least one engineer on duty. Here, all notifications are recorded in the form of incidents on responsible persons or departments.
This is a kind of MCC and the first line of defense in the event of an accident in the data center.
The monitoring center at the site OST.
In each profile department, you can additionally hang up screens with diagrams and alerts that fall within the area of responsibility of this department: for operation engineers - some screens, for networkers - others.
Visualization
You can follow the work of the data center only with the help of notifications, but for clarity, the main engineering systems and their parameters should be visualized in the form of diagrams and maps.
Summary of the data center OST-2.
With the scheme, it will be easier for the engineer on duty to understand in which machine room the broken air conditioner is located, what happens to the temperature in the nearest cold corridor. In addition, visualization provides an opportunity to see the relationship between the individual elements of the engineering system and quickly identify the source of the problem.
Different polling time for different systems
Consider the specifics of engineering systems when setting up a polling time. For a power supply system, the more often the readings are taken, the better. For example, in our monitoring, the voltage values are removed every second. And for air conditioners, this is too often, a minute interval is enough.
Set different polling times for different systems. So you do not miss important events and do not overload the system with too frequent requests.
Correctly selected thresholds for notifications
Record the critical values at which the alerts will be triggered. It is better to provide at least two levels of alert - warnings and critical errors. In Nagios, for example, this separation corresponds to warning and critical:
- warning warns that some parameters of the equipment or system are approaching a critical value;
- critical means an emergency situation, when something broke, an error in the equipment.
Proper separation of notifications will reduce the number of false alarms. It is difficult to draw a clear line between warning and critical, but understanding comes with experience. If the monitor is permanently red from accidents, then something is configured incorrectly. For an engineer, such monitoring will quickly become uninformative, false alarms will occur, and real accidents may go unnoticed among routine alerts.
If necessary, adjust the threshold values for different types of notifications.
Warning and alarm examples
All accident reports must be current. If the accident message hangs on the screen, it means that it has just happened. As soon as this notice is registered as an incident to the person in charge, it should disappear from the screen.
Clear procedures for emergency situations
It is important not to miss the accident, but it is even more important to react to it correctly and start the incident response process.
The engineer on duty should have a clear instruction on which he acts, and contacts of people who need to be notified in case of an emergency.
All information must be before the eyes and clearly formulated so that the engineer does not have to waste time searching or deciphering the instruction points.
For the convenience of engineers on duty, each notification can be accompanied by a pop-up tip with the contacts of the responsible person and instructions. Regulations are prescribed in advance and checked for viability during routine testing.
Do not force the engineer on duty to come up with a plan of action from scratch when there is an accident in the data center.
Alert by email and SMS
A thing useful when used correctly. For small server-based such alerts, I can replace the round-the-clock duty engineer. In a large data center is a kind of reservation engineer on duty. But here it is important not to overdo it and not to send notifications to responsible persons on any sneeze.
If there are a lot of alerts for non-critical errors (we called them warning above), then over time they will simply be ignored, and a serious accident will go unnoticed.
Statistics collection
In addition to online monitoring, it is useful to collect and long-term statistics. This will allow to evaluate the parameters in dynamics, to identify the values leading to emergencies. With this statistics, it is possible to draw conclusions on the operation of equipment under different loads, different weather conditions. The same information is then used for debriefing after accidents.
These are all points that we would like to note separately before embarking on stories about monitoring specific engineering systems. In the next article we will discuss what and how to monitor the power supply system of the data center and the server.
Source: https://habr.com/ru/post/319446/
All Articles