FPS and let your code wait
Greetings, dear readers of Habr. This article is about frontend, javascript and fps. And today I would like to share my thoughts on the "blind" code, which in fact does not take into account the performance of the execution environment. And, of course, we will write another bike-stand - where without them.
There was a recent article on Geektimes - “Mozilla released the hardware statistics on client PCs . ” And an excellent comment from schetilin expressing the main problem -
And there was also an article “The Truth about Traditional JavaScript Benchmarks . ” The essence of which is that parrots are good for comparing parrots, but not for real use.
Imagine a situation - Vasya, a super developer, is sitting and writing his cool code, running it on his no less steep "Mac". And ... the site works great, the animation is beautiful, the scrolling is fast and smooth.
')
But the user Petya sat down at his laptop and decided to go to the website of the online store for which, by the way, Vasya writes the code. And ... it started - animated galleries, banners, pop-up windows, and somewhere else in the depths, the parsing of some data from the server is started. All this is periodically accompanied by a wait icon. Petya's laptop is in a state of shock, and Petya himself starts cursing Vasya in absentia. Let's figure out who the "extreme".
“Petya is anun- advanced user, let him update the hardware,” you say. But the user is not obliged to adjust to each site; this is the business of the site to provide a quality interface.
“Vasya is a bad developer!” You say. And in vain, Vasya does his best to optimize his code, but he cannot test it on all platforms for all hardware configurations. And here a question arises to browser developers, why not provide the web developer with at least some information about the performance of the system on which the JS code is executed. Well, is it true that, for example, what knowledge does the browser use? This gives the developer knowledge of what syntax and API he can use. And how it will help, for example, in choosing a timeout when splitting a resource-intensive task into parts. For each version of the browser / engine, for each operating system and hardware configuration, the optimal timeout will be different.
Imagine if the web developer had at least an approximate performance index that would take into account the type of OS and the hardware configuration. Then it would be at index 2 out of 10, it would be possible to disable all animations altogether and vice versa at 10 to use in full. Well, it would be nice to have statistical tables with typical tasks execution time (for example, inserting 100 rows into a table) for each index. But as far as I know, there is nothing like that.
Well, we don’t have direct data on the performance of the system on which our code is executed. But there is FPS (Frames Per Second) - a great indirect indicator. High FPS is what the user needs for comfortable navigation, and this is what the developer can measure. And if we can measure, then we can use this metric in some conditions. Fine, we go further ...
Help:
So, we need to measure FPS. It is known that browsers try to update the interface about 60 times per second (i.e., the ideal FPS is 60). And there is the requestAnimationFrame () method, which allows you to schedule the execution of our code before the next interface redraw. This method is strongly recommended to use for all animations, instead of setTimeout / setInterval, which can cause forced redrawing, which increases the load on the system.
We write FPS counter:
The meter thinks well, you can see this in the console. But it operates with seconds, and the code is executed much faster - units and fractions of milliseconds. Let's try to shorten the counting period as much as possible, for example, to 100 ms. Of course, this will inevitably reduce the accuracy, but the speed increase will be as much as 10 times.
FPS fast counter:
And then it dawned on me - why not use both counters. Get some system of counters - one quick and one accurate. We'll see…
Now we can at least somehow assess the current state of the execution environment. But, all the same, I had the feeling that everything was not done. And again I decided to experiment ...
The figure shows that we spend one cycle (frame) to reset the counter, and the real counting begins with the next cycle. Reduce the counting time, while we will not reset the counter. It will also give a small gain in FPS counting speed. The new counting period is defined as (100/6) * 5 = 83 for a fast counter and (1000/60) * 59 = 983 for an exact.
The metric that we will focus on is mined. Now we need a mechanism for managing the time of code execution. And since we need such parameters as timeout and delta, the value of the timeout change. But, the question immediately arises, how to determine the optimal value of these parameters? The answer is simple - immediately, no way. Need data, need statistics. Although the timeout control mechanism itself is quite possible to determine. It will be extremely simple:
From the code it can be seen that the landmark goes by an amount of 20 FPS (fastFPS * 10), or rather a slightly larger one - " <= ". Values of 16 and 1000 are limits. The minimum timeout is 16, it is 60 FPS. And the maximum is chosen as 1000, corresponding to 1 FPS.
It is assumed that the timeout correction function will be called each time a new FPS counter is set.
We measure FPS, timeout is manageable. Now we need an executor - a function that, on the basis of this data, will control the execution of the code, or, more precisely, just slow down calls when necessary. We write ...
This function is intentionally named similar to requestAnimationFrame , since it is this method that underlies it. Those. we do any interface updates via requestAnimationFram. But since using this method you cannot set a timeout, we make wrappers with setTimeout.
On the basis of a chain of promises, an asynchronous queue is organized, which firstly allows you to set a timeout, and secondly prevents the "avalanche" execution of the code.
The requestAdaptiveAnimation algorithm is as follows:
It is time to put everything together and test it. And besides, there is still an unsolved problem with timeout and delta. For testing, I wrote a small stand , and began to look at different ratios of the timeout and the delta.
Initially, I decided to correlate the timeout and delta with the number of animated objects. And I had such considerations - the more elements, the greater the start timeout value, and the delta is correspondingly less, otherwise there will be strong fluctuations in timeout and animation.
Thus, the calculation was reduced to:
But it worked poorly, and I decided to introduce a correction factor - ratio . The calculation came down to:
I began to change this coefficient and watch the graphs.
100 objects:
500 objects:
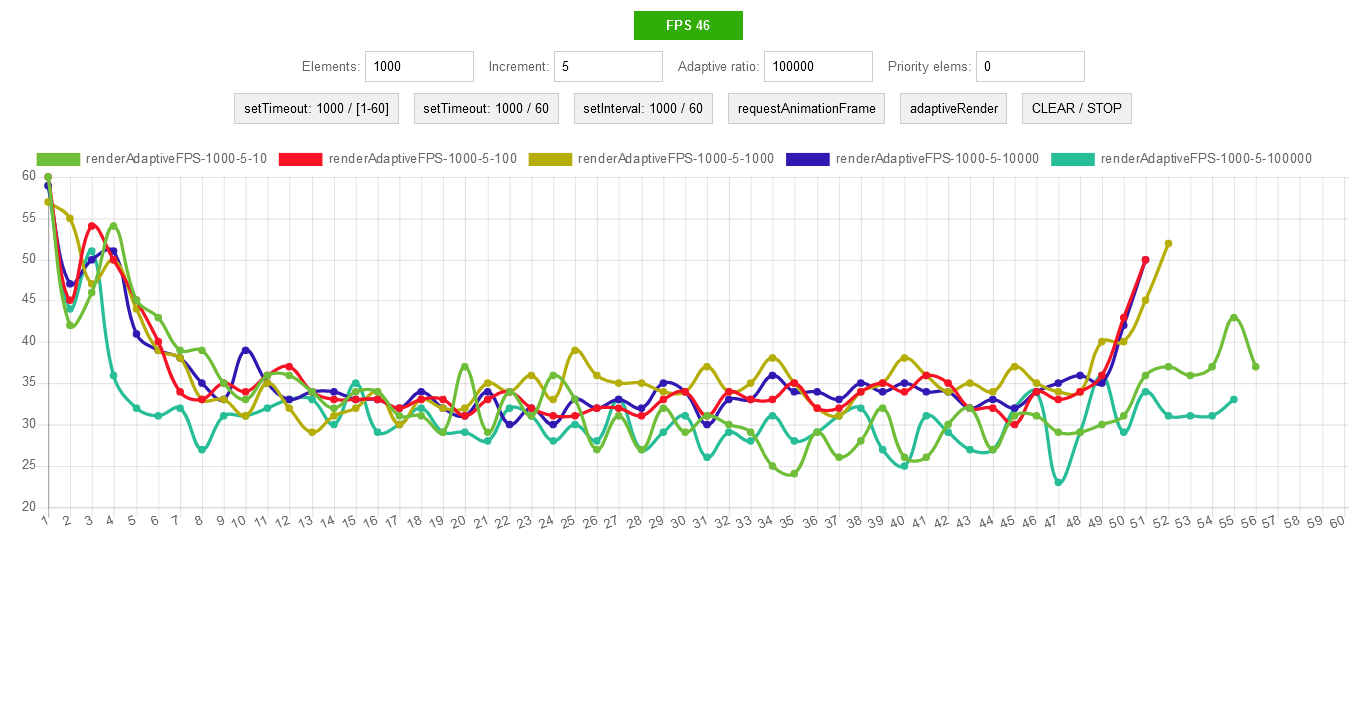
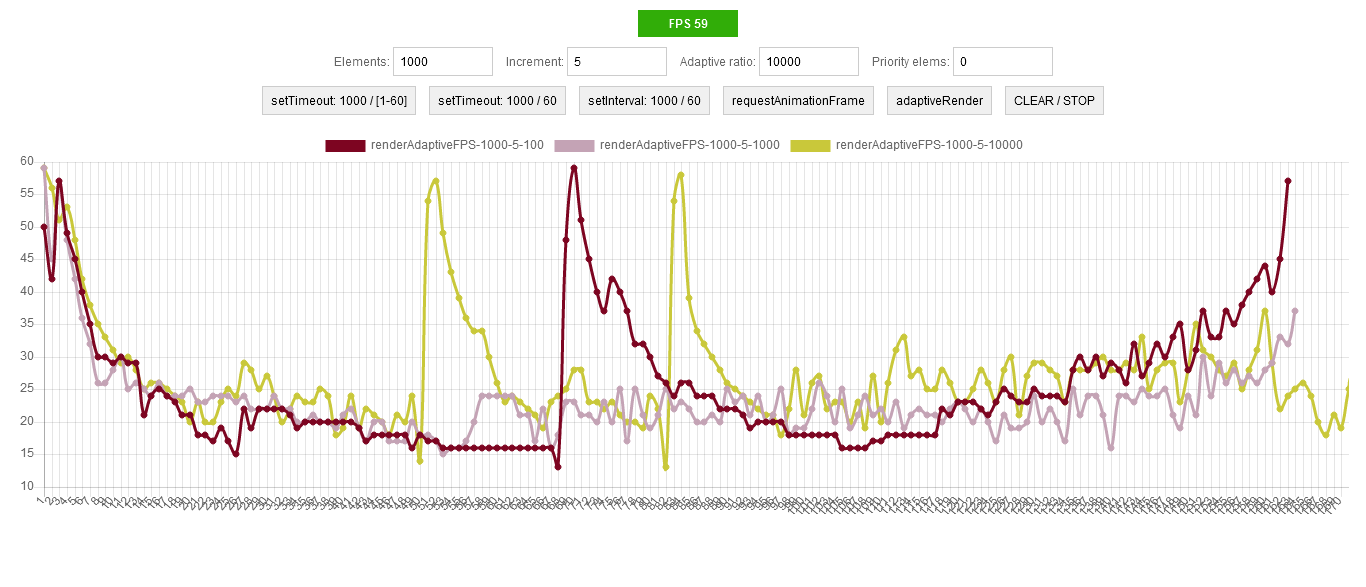
1000 objects:
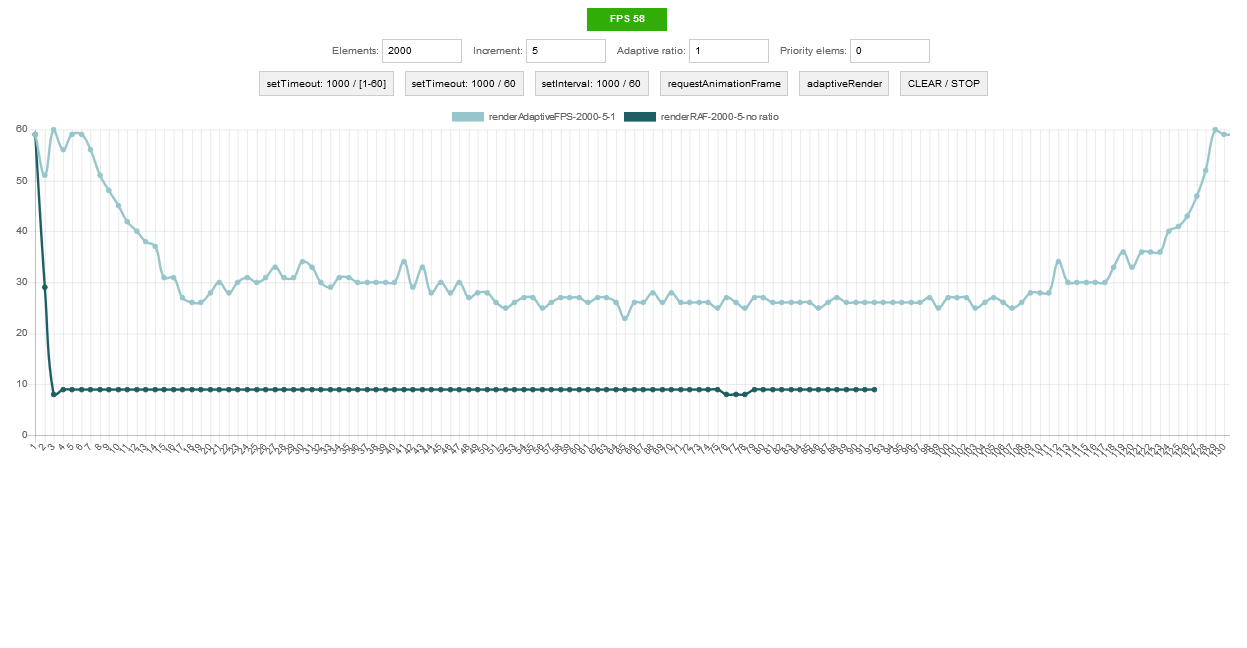
2000 objects:

This chart is interesting because it shows the inclusion of the "saving" queue mechanism with FPS below 15 frames.
Comparative plate:

On the plate we select the best options and continue to test.
Here it is necessary to explain a little. Although we specify to animate 1000 elements, in fact, because of the queue of initial calls, at the same time I have animated no more than 300. This is due to the fact that at the beginning of the animation, for example, the 300th element, the animation of the first has already ended.
Here is what it looks like (a piece of about 300 elements):

1000 objects, short animations (comparison of the best from the table):

Now we will increase the length of the animation (I just did the maximum scaling of the page) and again we will start.
How it looks now (all elements - 1000):

Now you can see that all elements are animated at the same time.
1000 objects, long animations (comparison of the best from the table):
The graph shows that the “saving” queue mechanism is not activated only when timeout (elements / ratio) and delta (ratio / elements) equal 1 - the pink line on the graph.
So, with the timeout and delta determined. Now it's time to compare with native methods - setInterval , setTimeout , requestAnimationFrame :

From the graph it is clear that with a small number of elements we have a minimal overhead projector. When the adaptation mechanism is turned on, the duration of the code execution certainly increases, but the FPS remains at level 30 . Native methods drain FPS to 7-8 .
It would seem that's all. But no, I ran all the tests on a laptop, and the original purpose of all this writing is to work on different systems with different configurations. Therefore, we check all the same, but on the desktop.
Comparison with native methods on short animations:

Comparison with native methods on long animations:
It can be seen that on the laptop (CPU: A8, RAM: 8Gb) and on the desktop (CPU: i5, RAM: 8Gb) the operation is similar - FPS remains at level 30. The only difference is in how much the code execution stretches in time .
Good:
Poorly:
“Well, now, that's it,” I thought. But that strange feeling ... and I decided again ...
Good mood to you all. Comments and criticism are welcome. The only request, if you put a minus, then drop a few lines for what it is.
Foreword
There was a recent article on Geektimes - “Mozilla released the hardware statistics on client PCs . ” And an excellent comment from schetilin expressing the main problem -
Here our statistics writers would see this statistics. And now they are creating sites for which i7 32Gb is not enough.
And there was also an article “The Truth about Traditional JavaScript Benchmarks . ” The essence of which is that parrots are good for comparing parrots, but not for real use.
Blah blah blah...
Imagine a situation - Vasya, a super developer, is sitting and writing his cool code, running it on his no less steep "Mac". And ... the site works great, the animation is beautiful, the scrolling is fast and smooth.
')
But the user Petya sat down at his laptop and decided to go to the website of the online store for which, by the way, Vasya writes the code. And ... it started - animated galleries, banners, pop-up windows, and somewhere else in the depths, the parsing of some data from the server is started. All this is periodically accompanied by a wait icon. Petya's laptop is in a state of shock, and Petya himself starts cursing Vasya in absentia. Let's figure out who the "extreme".
“Petya is an
“Vasya is a bad developer!” You say. And in vain, Vasya does his best to optimize his code, but he cannot test it on all platforms for all hardware configurations. And here a question arises to browser developers, why not provide the web developer with at least some information about the performance of the system on which the JS code is executed. Well, is it true that, for example, what knowledge does the browser use? This gives the developer knowledge of what syntax and API he can use. And how it will help, for example, in choosing a timeout when splitting a resource-intensive task into parts. For each version of the browser / engine, for each operating system and hardware configuration, the optimal timeout will be different.
Imagine if the web developer had at least an approximate performance index that would take into account the type of OS and the hardware configuration. Then it would be at index 2 out of 10, it would be possible to disable all animations altogether and vice versa at 10 to use in full. Well, it would be nice to have statistical tables with typical tasks execution time (for example, inserting 100 rows into a table) for each index. But as far as I know, there is nothing like that.
Counters
Well, we don’t have direct data on the performance of the system on which our code is executed. But there is FPS (Frames Per Second) - a great indirect indicator. High FPS is what the user needs for comfortable navigation, and this is what the developer can measure. And if we can measure, then we can use this metric in some conditions. Fine, we go further ...
Help:
FPS is the number of frames per second on the monitor screen. For browsers, this is the number of times per second when the browser updates the interface.
In general, the process of drawing in the browser is not so simple. The browser tries not to redraw the entire page, splits the page into layers and a whole lot more, God knows what. Climb into the wilds of this process, now there is no meaning, and the rendering algorithm can vary from version to version. In principle, it’s enough to remember one rule - if you often refer to a DOM element, you need to pull it out of the main structure, i.e. position it fixed or absolutely.
So, we need to measure FPS. It is known that browsers try to update the interface about 60 times per second (i.e., the ideal FPS is 60). And there is the requestAnimationFrame () method, which allows you to schedule the execution of our code before the next interface redraw. This method is strongly recommended to use for all animations, instead of setTimeout / setInterval, which can cause forced redrawing, which increases the load on the system.
We write FPS counter:
let frameCount = function _fc(timeStart){ let now = performance.now(); let duration = now - timeStart; if(duration < 1000){ _fc.counter++; } else { _fc.fps = _fc.counter; _fc.counter = 0; timeStart = now; console.log(_fc.fps); } requestAnimationFrame(() => frameCount(timeStart)); } frameCount.counter = 0; frameCount.fps = 0; frameCount(performance.now()) The meter thinks well, you can see this in the console. But it operates with seconds, and the code is executed much faster - units and fractions of milliseconds. Let's try to shorten the counting period as much as possible, for example, to 100 ms. Of course, this will inevitably reduce the accuracy, but the speed increase will be as much as 10 times.
FPS fast counter:
let frameCount = function _fc(timeStart){ let now = performance.now(); let duration = now - timeStart; if(duration < 100){ _fc.counter++; } else { _fc.fps = _fc.counter * 10; _fc.counter = 0; timeStart = now; console.log(_fc.fps); } requestAnimationFrame(() => frameCount(timeStart)); } frameCount.counter = 0; frameCount.fps = 0; frameCount(performance.now()) And then it dawned on me - why not use both counters. Get some system of counters - one quick and one accurate. We'll see…
let frameCount = function _fc(fastTimeStart, preciseTimeStart){ let now = performance.now(); let fastDuration = now - (fastTimeStart || _fc.startTime); let preciseDuration = now - (preciseTimeStart || _fc.startTime); if(fastDuration < 100){ _fc.fastCounter++; } else { _fc.fastFPS = _fc.fastCounter * 10; _fc.fastCounter = 0; fastTimeStart = now; console.log(_fc.fastFPS); } if(preciseDuration < 1000){ _fc.preciseCounter++; } else { _fc.preciseFPS = _fc.preciseCounter; _fc.preciseCounter = 0; preciseTimeStart = now; console.log(_fc.preciseFPS); } requestAnimationFrame(() => frameCount(fastTimeStart, preciseTimeStart)); } frameCount.fastCounter = 0; frameCount.fastFPS = 0; frameCount.preciseCounter = 0; frameCount.preciseFPS = 0; frameCount.startTime = performance.now(); frameCount() Now we can at least somehow assess the current state of the execution environment. But, all the same, I had the feeling that everything was not done. And again I decided to experiment ...
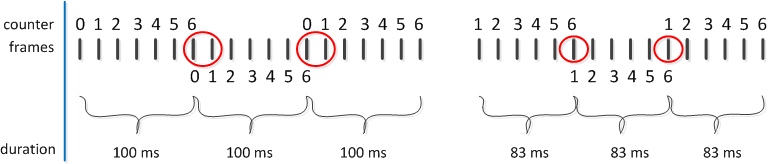
The figure shows that we spend one cycle (frame) to reset the counter, and the real counting begins with the next cycle. Reduce the counting time, while we will not reset the counter. It will also give a small gain in FPS counting speed. The new counting period is defined as (100/6) * 5 = 83 for a fast counter and (1000/60) * 59 = 983 for an exact.
Time-out
The metric that we will focus on is mined. Now we need a mechanism for managing the time of code execution. And since we need such parameters as timeout and delta, the value of the timeout change. But, the question immediately arises, how to determine the optimal value of these parameters? The answer is simple - immediately, no way. Need data, need statistics. Although the timeout control mechanism itself is quite possible to determine. It will be extremely simple:
timeoutCorrection(){ if(fastFPS <= 2 && timeout < 1000){ timeout += delta; } else if(fastFPS > 2 && timeout > 16) { timeout -= delta; } } From the code it can be seen that the landmark goes by an amount of 20 FPS (fastFPS * 10), or rather a slightly larger one - " <= ". Values of 16 and 1000 are limits. The minimum timeout is 16, it is 60 FPS. And the maximum is chosen as 1000, corresponding to 1 FPS.
It is assumed that the timeout correction function will be called each time a new FPS counter is set.
Executor
We measure FPS, timeout is manageable. Now we need an executor - a function that, on the basis of this data, will control the execution of the code, or, more precisely, just slow down calls when necessary. We write ...
let requestAdaptiveAnimation = function _raa(cb, priority, timeout, ...args){ if( !_raa.cbsStore.has(cb) || timeout){ _raa.cbsStore.add(cb); _raa.queue = _raa.queue.then(()=>{ return new Promise((res)=>{ setTimeout(()=>{ requestAnimationFrame(()=>{ cb(...args); res(); }); }, timeout || 0); }); }); return; } if(frameCount.fastFPS >= 4 || priority){ requestAnimationFrame(()=>cb(...args)); return; } if( frameCount.preciseFPS < 15){ _raa.queue = _raa.queue.then(()=>{ return new Promise((res)=>{ requestAnimationFrame(()=>{ cb(...args); res(); }); }); }); return; } setTimeout(()=>{ requestAnimationFrame(()=>cb(...args)); }, _raa.timeout); } requestAdaptiveAnimation.cbsStore = new Set(); requestAdaptiveAnimation.queue = Promise.resolve(); This function is intentionally named similar to requestAnimationFrame , since it is this method that underlies it. Those. we do any interface updates via requestAnimationFram. But since using this method you cannot set a timeout, we make wrappers with setTimeout.
On the basis of a chain of promises, an asynchronous queue is organized, which firstly allows you to set a timeout, and secondly prevents the "avalanche" execution of the code.
The requestAdaptiveAnimation algorithm is as follows:
- If the transferred callback is used for the first time or the timeout is set, then the callback execution is placed in a common queue.
- If it is an animation and the same callback is called several times, then when the FPS fast counter is high, you can directly call the requestAnimationFram.
- If the FPS exact counter value fell below the critical threshold of 15 , then the callback is queued. Visually, it looks like a temporary freezing animation. The number 15 is chosen subjectively, in my opinion, the value of the page scroll can still be called acceptable.
- By default, we call requestAnimationFrame, through a corrected timeout.
Tests
It is time to put everything together and test it. And besides, there is still an unsolved problem with timeout and delta. For testing, I wrote a small stand , and began to look at different ratios of the timeout and the delta.
Initially, I decided to correlate the timeout and delta with the number of animated objects. And I had such considerations - the more elements, the greater the start timeout value, and the delta is correspondingly less, otherwise there will be strong fluctuations in timeout and animation.
Thus, the calculation was reduced to:
timeout = numberObjects; delta = 1/numberObjects; But it worked poorly, and I decided to introduce a correction factor - ratio . The calculation came down to:
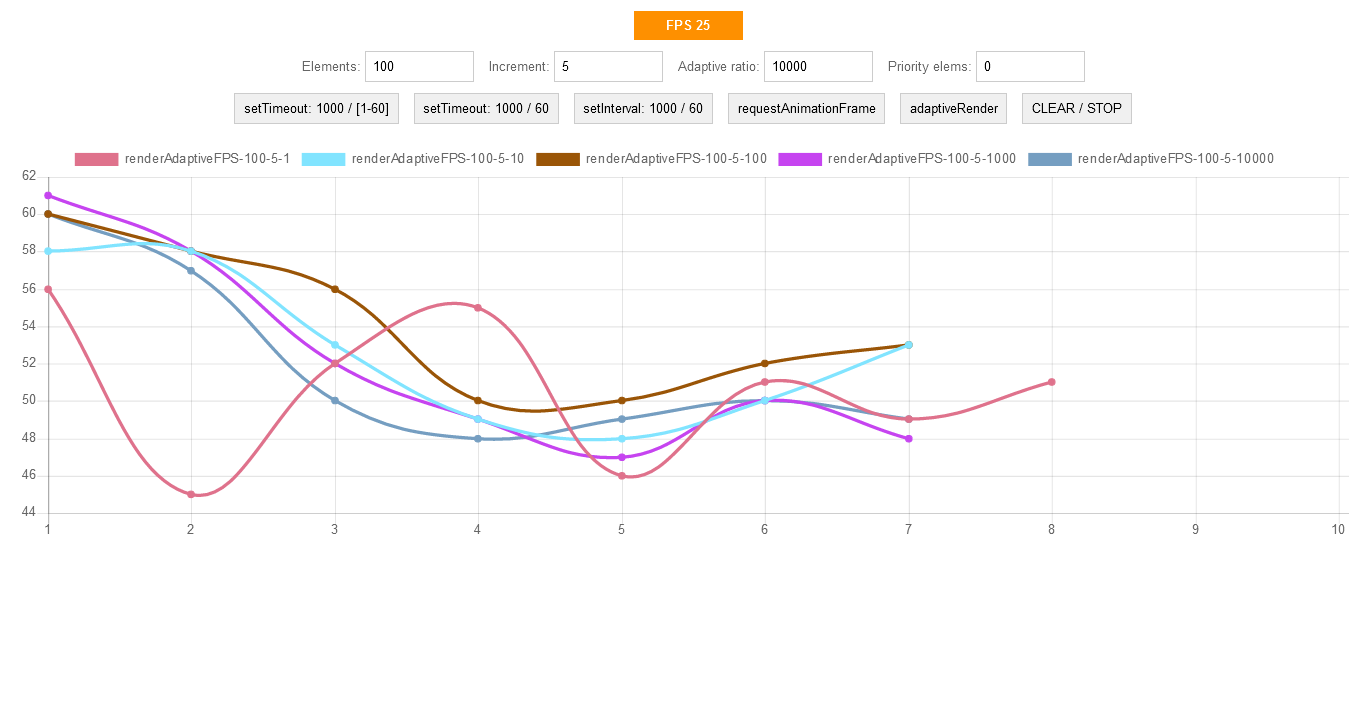
timeout = numberObjects/ratio; delta = ratio/numberObjects; I began to change this coefficient and watch the graphs.
100 objects:
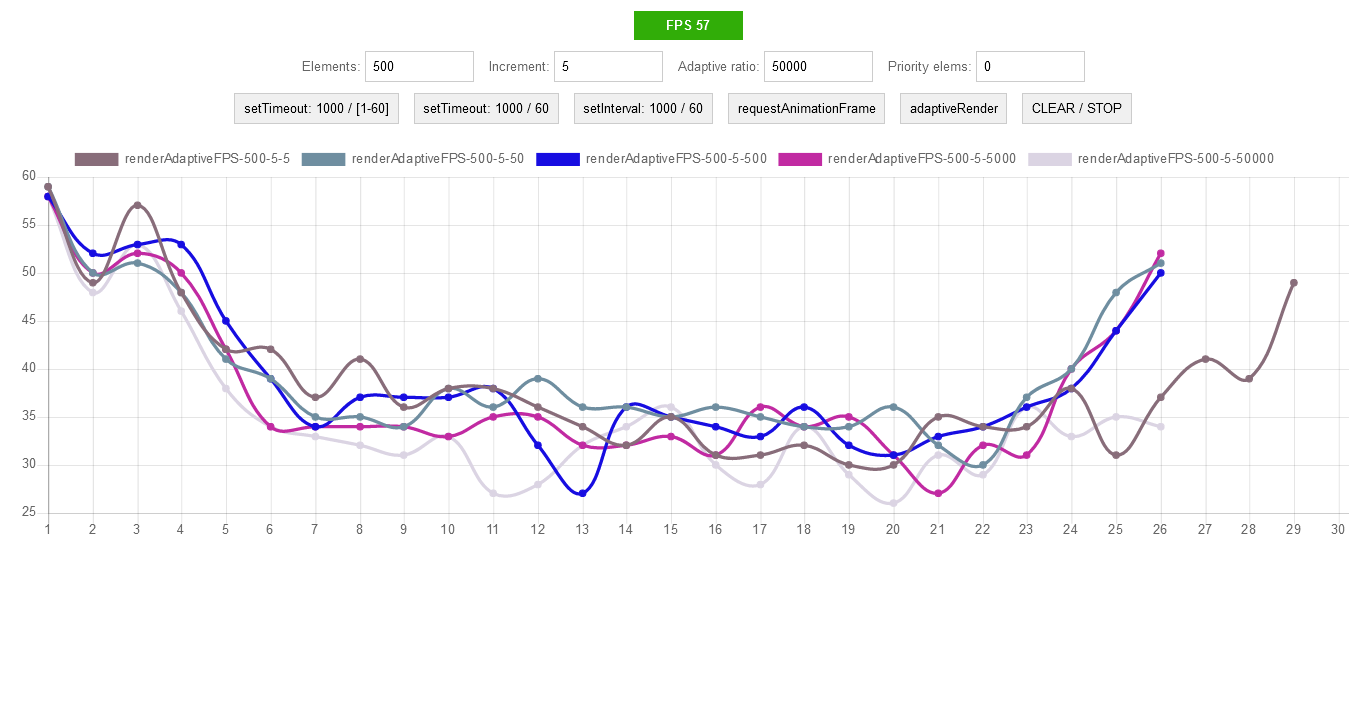
500 objects:
1000 objects:
2000 objects:
This chart is interesting because it shows the inclusion of the "saving" queue mechanism with FPS below 15 frames.
Comparative plate:
On the plate we select the best options and continue to test.
Here it is necessary to explain a little. Although we specify to animate 1000 elements, in fact, because of the queue of initial calls, at the same time I have animated no more than 300. This is due to the fact that at the beginning of the animation, for example, the 300th element, the animation of the first has already ended.
Here is what it looks like (a piece of about 300 elements):
1000 objects, short animations (comparison of the best from the table):
Now we will increase the length of the animation (I just did the maximum scaling of the page) and again we will start.
How it looks now (all elements - 1000):
Now you can see that all elements are animated at the same time.
1000 objects, long animations (comparison of the best from the table):
The graph shows that the “saving” queue mechanism is not activated only when timeout (elements / ratio) and delta (ratio / elements) equal 1 - the pink line on the graph.
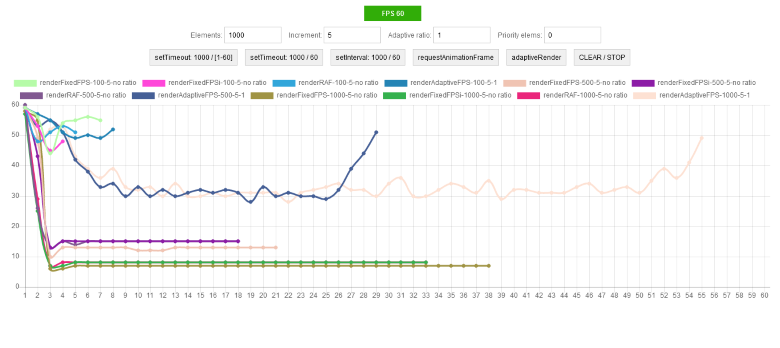
So, with the timeout and delta determined. Now it's time to compare with native methods - setInterval , setTimeout , requestAnimationFrame :
From the graph it is clear that with a small number of elements we have a minimal overhead projector. When the adaptation mechanism is turned on, the duration of the code execution certainly increases, but the FPS remains at level 30 . Native methods drain FPS to 7-8 .
It would seem that's all. But no, I ran all the tests on a laptop, and the original purpose of all this writing is to work on different systems with different configurations. Therefore, we check all the same, but on the desktop.
Comparison with native methods on short animations:
Comparison with native methods on long animations:
It can be seen that on the laptop (CPU: A8, RAM: 8Gb) and on the desktop (CPU: i5, RAM: 8Gb) the operation is similar - FPS remains at level 30. The only difference is in how much the code execution stretches in time .
Results
Good:
- The mechanism works, FPS is saved
- Saving the FPS level regardless of the browser (Firefox, Chrome)
- Maintain FPS level regardless of system performance
Poorly:
- Independence among themselves of different animations. Because of this, animations that are started later under certain conditions may end earlier.
“Well, now, that's it,” I thought. But that strange feeling ... and I decided again ...
PS
Good mood to you all. Comments and criticism are welcome. The only request, if you put a minus, then drop a few lines for what it is.
Source: https://habr.com/ru/post/319302/
All Articles