Arithmetic average: physical meaning and visualization
Variable - an attribute (property) of a system that changes its numeric value. The set of values for a variable can be:
A person analyzes this kind of numerical data and makes decisions. Knowledge of air temperature helps to dress properly. Currency rate says buy it or sell it.
When one or several values, then no difficulties arise. But when the values are tens or hundreds, it is difficult for a person to immediately understand what the data mean. Integral characteristics of value sets and visualization come to the rescue.
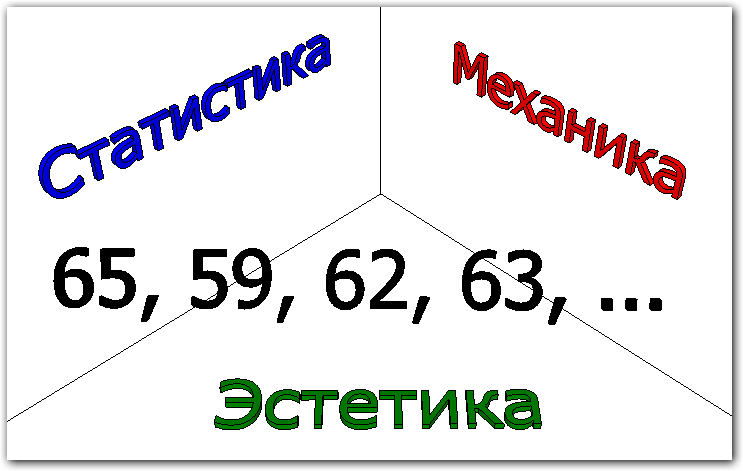
One of the integral characteristics of the set of values of a variable is the arithmetic average. Let's look at it from the point of view of statistics, physics (mechanics) and aesthetics.
The arithmetic average of two numbers
Let's start with the minimum set of numbers for which you can calculate the arithmetic average. Here are two numbers:

Their average is:

Two observations:
- The arithmetic average is in the middle of two numbers (more than less, but less than more).
- The arithmetic average is not always included in the analyzed set of numbers (not equal to any of the two numbers) .
The physical meaning of the arithmetic mean
Let's draw two initial numbers and their arithmetic average on the number axis:
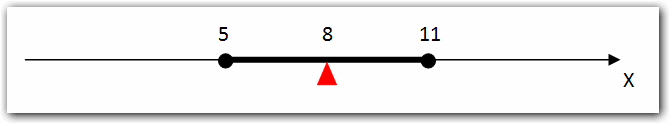
Numbers are marked with black circles, and the arithmetic average is a red triangle. The resulting construction is a scale. For weights in equilibrium, the rule of lever requires that the moments of forces be equal. Scales do not lean in one or the other, as there is no torque.

In mechanics, the moment of force is the product of force F and distance l :

On the shoulders of the scales, a force generated by the weight of the points "cargo". Denoting the distance from the cargo to the support point l 1 and l 2 , we get:

Points "cargo" differ only in the coordinate on the axis. We will consider their weight the same. Then:

Denoting the m coordinate of the pivot point of the balance, we get:

Similarly, from the formula of equality of moments for an arbitrary number N of points- "weights" with the same weight w, the formula for the arithmetic mean is derived. Equal moments for both shoulders of scales:

Coordinate support scales m :

The formula for the arithmetic mean gives the coordinate of the balance point of the balance .
Visual perception of balance
Balance in art plays a crucial role. If the creation of the picture does not reach the balance of its elements, then the work will not be complete. In each picture, the artist creates a balance of various visual forces.
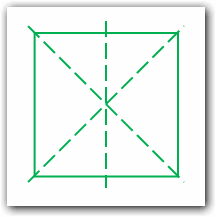
Rudolf Arnheim notes that human vision is capable of detecting the slightest deviations from the center of balance in an image:
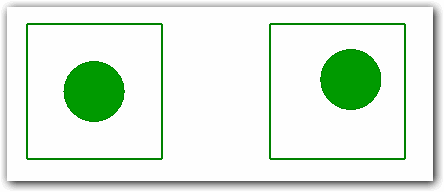
In the example above, the circle on the left is in a state of equilibrium, but not on the right. Although the equilibrium point (the center of the square) is not marked in any way in the figure, a person can determine with great accuracy whether a circle is at this point or not.
Although the equilibrium point may not be depicted, the person perceives it as part of the visual structure:
The arithmetic average is similar: it is not necessarily included in the set of numbers, but significant for its perception and evaluation.
Mathematical expectation of a random variable
For a random variable, the mathematical expectation is an analog of the arithmetic mean. The probability at the same time can be considered the weight of the point- "load". Equal moments formula with different weights:

Now the pivot of the balance in balance is μ:

The sum of all probabilities is 1. Therefore, the sum of the weights is equal to 1. Then the formula for the coordinate of the weights point in equilibrium is equal to:

This is the expectation formula.
bar chart
A histogram is a visualization (a geometric image) of the values of a variable quantity, taking into account probabilities. The histogram shows for sampling values, which of them appear frequently, which are less common, and which are very rare.
On the histogram, possible values are plotted along the horizontal axis, and weights along the vertical axis. The range of values in the vertical is obvious - from 0 to 1 (probability values). The horizontal range must include the expected values of the variable.
The histogram is a simple picture (a copy of fine art). The viewer expects that the equilibrium point of the set of values will be exactly in the middle of the histogram :
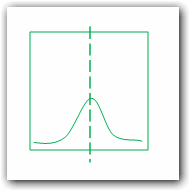
Based on this, the range of values for the horizontal axis of the histogram should be selected. Then you will immediately see the deviation of the properties of the sample values from the expected:
This kind of deviation can be caused by outliers. Emissions are values that are very different from the others. Thanks to the lever rule, even a small amount of emissions changes the equilibrium point and the arithmetic average :
Give me a foothold and I will flip the Earth. Archimedes
findings
- The arithmetic average is the integral characteristic of a set of numerical data (sampling). Used as a descriptive characteristic in conjunction with others.
- Normally, the mean is not in the data set. The arithmetic average cannot replace the full description of the sample obtained.
- The interval of histogram values should be chosen so that the expected arithmetic average is in the middle. Then the deviation of the sampling parameters from the expected values will be immediately visible.
- The arithmetic average is influenced by emissions — values that are very different from other values of a variable.
Links
- Wikipedia: Variable , Moments in statistics and mechanics , Moment of force , Mathematical expectation
- Rudolf Arnheim. Art and visual perception: fragments
- Demonstration of histogram, expected average and average sample: source code for PyOpenGL
')
Source: https://habr.com/ru/post/319168/
All Articles