Delivery speed to user
Anatoly Orlov ( anatolix ), Denis Nagornov ( Yandex )
Anatoly Orlov: Hello everyone! My name is Anatoliy. I worked in the last 10 years in Yandex. In Yandex, I did different things, but it turned out that at HighLoad I always do reports about speeds of different types. I have a co-rapporteur - Denis Nagornov, he still works at Yandex and is engaged, among other things, do not believe it, also at speed.
The report is called "Speed with delivery to the user." As you know, a huge number of companies are trying to optimize the loading of their pages. Some companies are so proud of the results achieved that they write these results on their pages, and not even at the bottom, but at the top.
')
For example, a screenshot from Google:
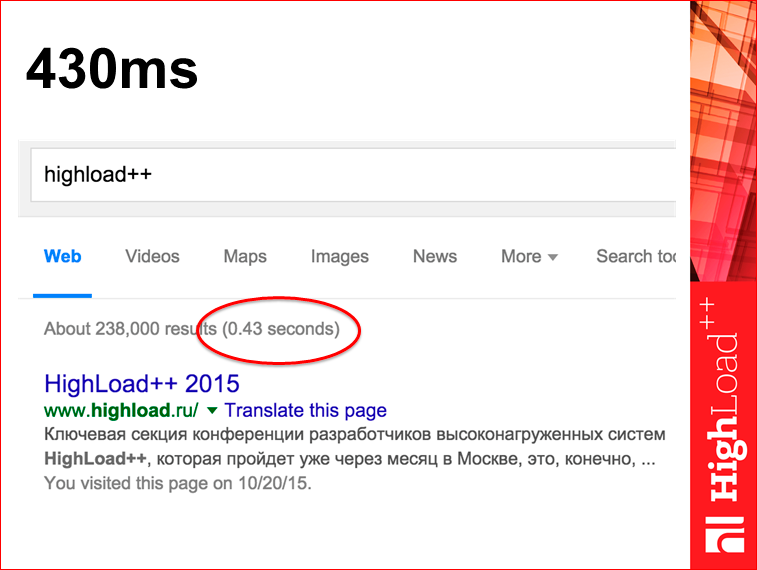
If you look at the same page in the Developer Tools in the browser, you will see that the number will be slightly different, not 430 ms, but 625.
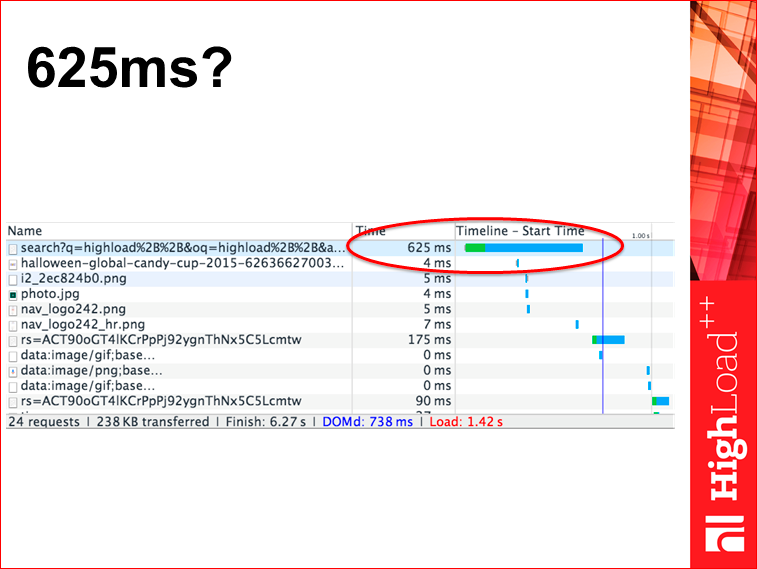
Intuitively, it is more or less clear to all that 430 is somewhere on the Google server, and 625 is here in your browser. Question: which tsiferka more suited to be a metric of speed? It seems to me that the tsiferka that you have in your browser is more useful, because you can be proud of the dial-up on the server, but there is no longer any benefit from it. A tsiferka in the browser really speeds up the user experience.

We want to make a certain speed metric on the client. Here the question immediately arises - what to measure and how to measure?
How to measure - the question is simple. And what to measure is not very trivial, because the page loading is a kind of complex process, about which full reports are made. But, imagine, you download a file with “War and Peace” from lib.ru and there you can read it almost immediately, and it will load in a few minutes, perhaps. This is an example that it is not clear which point to choose during the download.
There are a huge number of sites that, for example, instantly work when you go from page to page - you instantly open navigation, because it is all cached, but it takes some time to load the results.
The answer to the question of what needs to be measured for all sites around the world does not exist. For your particular site, you can come up with such an answer. For a search engine, probably, the download of the first issue is just the mark that should be measured.
There is a phrase: if you have only a hammer out of tools, then all your problems look like nails. In this area there are so many hammers:
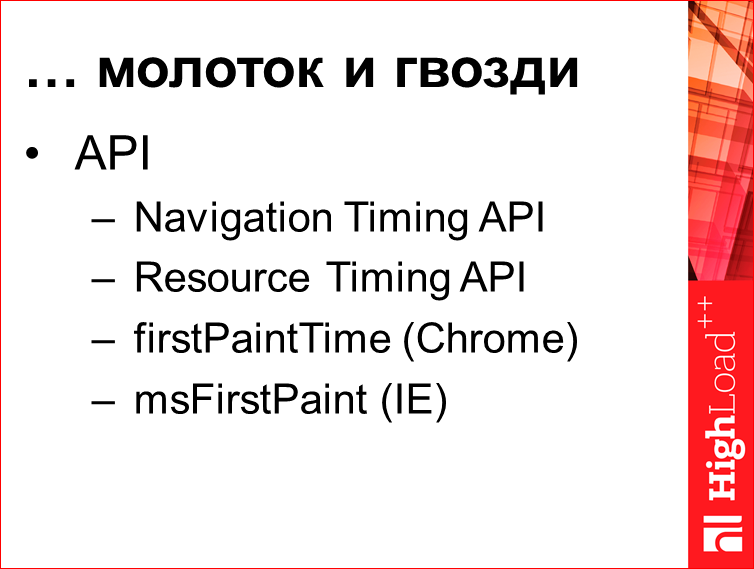
Those. There are two more or less standard APIs and two properties, one of which is implemented in Chrome, and the other in IE. And so you can not measure everything. You do not know when, for example, the first result of the issue appeared.
What can be measured? There is some very simplified scheme (actually it is 5 times more) of what is happening in your browser:
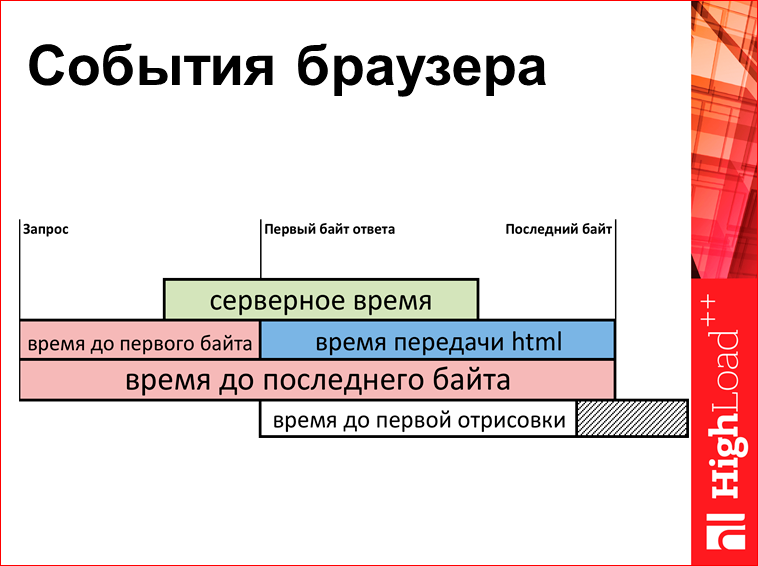
There is a point in time when the browser asked for a server request. Then the server starts to produce HTML. First comes the first byte, then quietly the rest of the baytik, then the last byte. And here we have a certain set of metrics. You can measure the time to the first byte, you can measure the transmission time, you can measure the time to the last byte, and this is all pulled out with Java Script, uploaded to the server and on the server to build charts.
For comparison. This is some first byte of the fast server, the server is somewhere not very far from Moscow. How it looks in different cities of Russia:
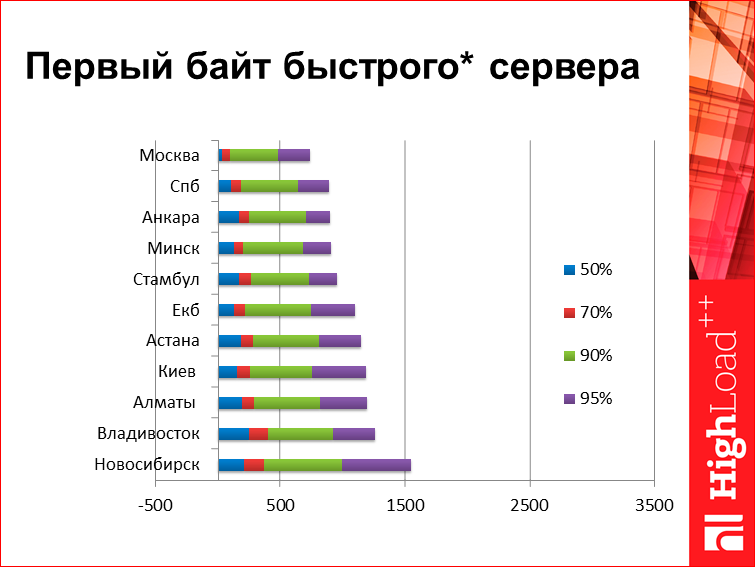
Here in each line there are several values, this is so-called. percentile. For those who do not know, the 50th percentile means that 50% of user responses are faster than this value, 50% more. Well, 95% is the same. What do we see on this chart? Here is the server, which is conditionally responsible for 0, i.e. From the server, the first baytik flies right away. The size of the page for the first byte does not matter, because it is the first byte - it came as it came. From interesting data here, for example, we will look at Vladivostok - for some reason he confidently “does” Novosibirsk at high percentiles, then, if we look at low percentages. Low percentiles are conventionally determined by the speed of light, and high percentiles are not clearly defined by what. To me, here from this graph, it seems that in Novosibirsk there is some kind of problem with connectedness.
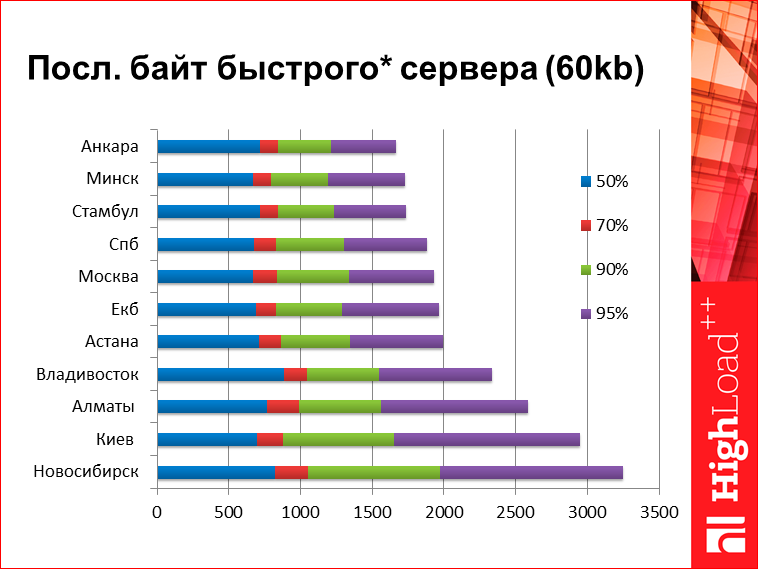
The last byte of the fast server. In fact, this is a kind of synthetic metric here I have drawn. Those. here I took the time of issuing the search, but since here the server time is not much zero, I just subtracted it from the results. That is, roughly speaking, how much would take a search response, if the server time was zero. Here we see numbers quite large. From the interesting - here again, Novosibirsk is breaking out into some kind of anti-leaders, Vladivostok is unexpectedly cool, he “makes” Almaty and Kiev. Something like this. I gave the numbers for you to understand the order. There on the bottom tsiferke, 95th percentile, 3 seconds with a penny. Ie, roughly speaking, if you optimize your server for 100 ms, you understand that you are not quite optimizing for some time.

On the previous two slides was statistics. There is a saying that there is a lie, a blatant lie and statistics. This is a statistic.
When we talk about statistics, we need to talk about restrictions. First, these APIs are not supported by all browsers. Those. on the desktop, everything is not bad with this, but on mobile phones, these APIs can only Chrome on Android. Secondly, we must understand that browsers give different numbers. Those. different property names in Chome based browsers and in IE, they say that we measure something different.
Then, if it is possible to understand from Chrome what this tsiferka means, because there are sources, then tsiferka means in IE, in fact, it is impossible to understand. Therefore, it is not very correct to compare them formally, but on the other hand, if you are not the author of the browser, and are not trying to overtake IE, you really do not care, because you have approximately the same distribution of browsers on the site, compare it with what was and normal. And various statistical conclusions are subject to different cognitive errors.
Let's look at something more interesting. Here we have a split time to the first byte in a section on different browsers:
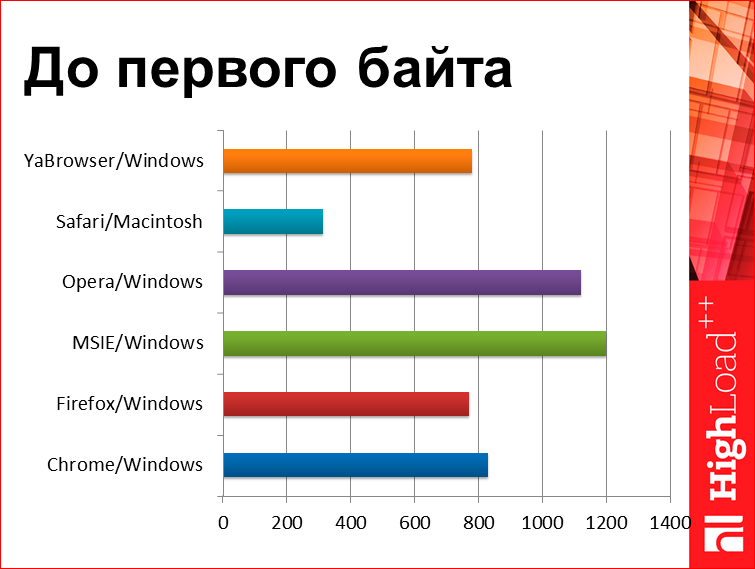
What do we see here? We see that Chrome is faster than IE, Opera unexpectedly performs poorly. And here we have a super browser, called Safari, which works 2.5 times faster than all other browsers. This is a classic example called bias. The situation is very simple - if you look around, then Macintosh is at every second, relatively speaking. So, if you go somewhere in the forest to Lake Baikal, Macintosh will be yours only, there are no other poppies, so yes, it’s true that all people in Safari very quickly open pages, but this is not because Safari is good, but because they usually have a good Internet. They are in Moscow, they are IT specialists and all that. No wonder that such a picture exists. This is to the fact that when you see some hypotheses, they must somehow be considered and tested.

There is such a magic protocol, it is called HTTPS. We all love him, everything goes to him. What do we know about him? In general, the protocol should be slower. Everyone understands that there are all kinds of public key calculations, any kind of handshake, there is an extra roundtrip. In general, everyone knows that HTTPS is slower, this is a common understanding.
If we look at these graphs, the first byte in HTTPS comes faster. I will not show you the schedule, it is not the most important here. I believe that this is a certain choice of statistics, i.e. Most likely, the browser considers the first byte of handshake to be the first byte of HTML, so they say it is a little faster. But there is still such a strange conclusion that it generally becomes faster in sum. That's real, https is faster. And for some time this conclusion turned out to be highly paradoxical for us; we began to dig what the problem was there.
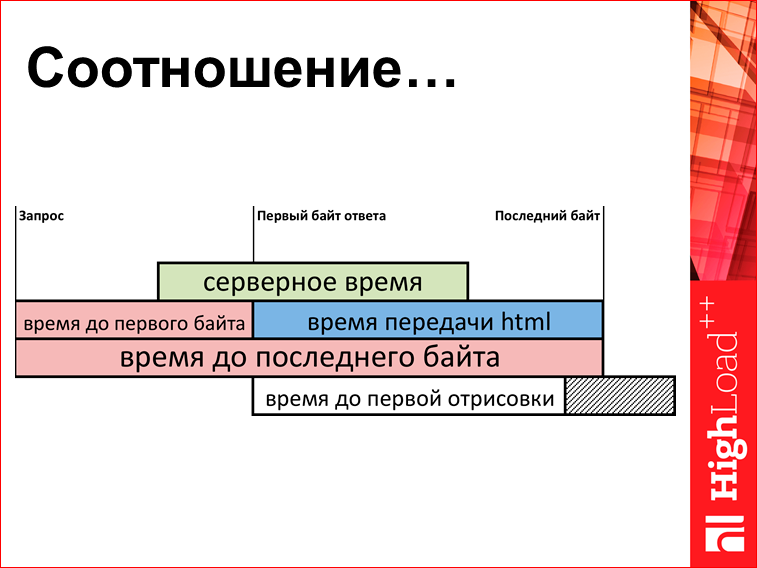
I already showed it. But since everyone has already forgotten, I will show it again. We look at the parameters "time up to the 1st byte" and "html transmission time". Here is the difference in the relationship of this joke. So:
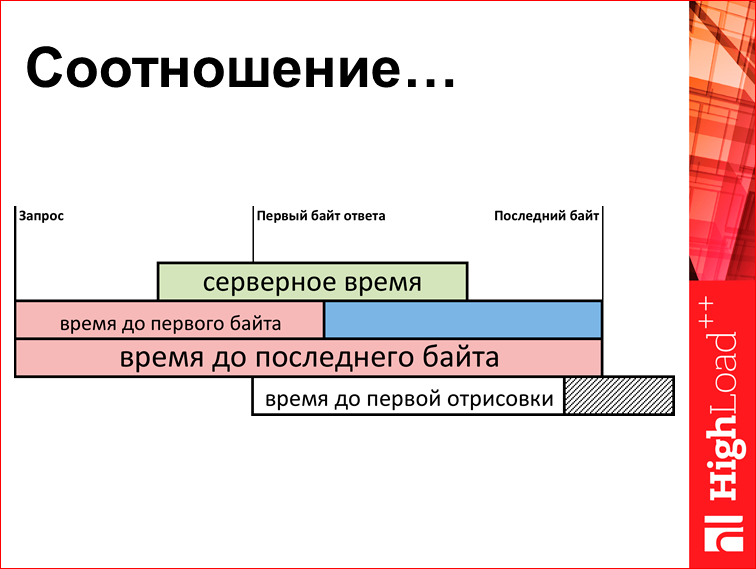
So:
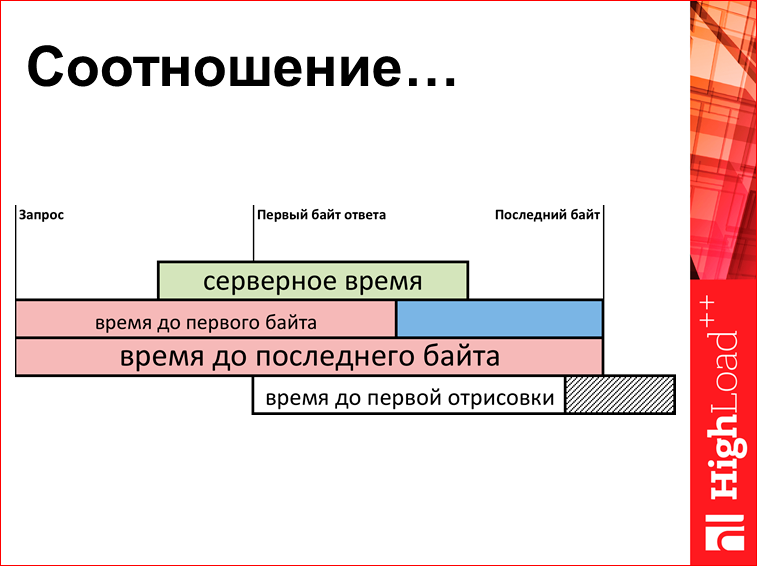
So:

Or so:
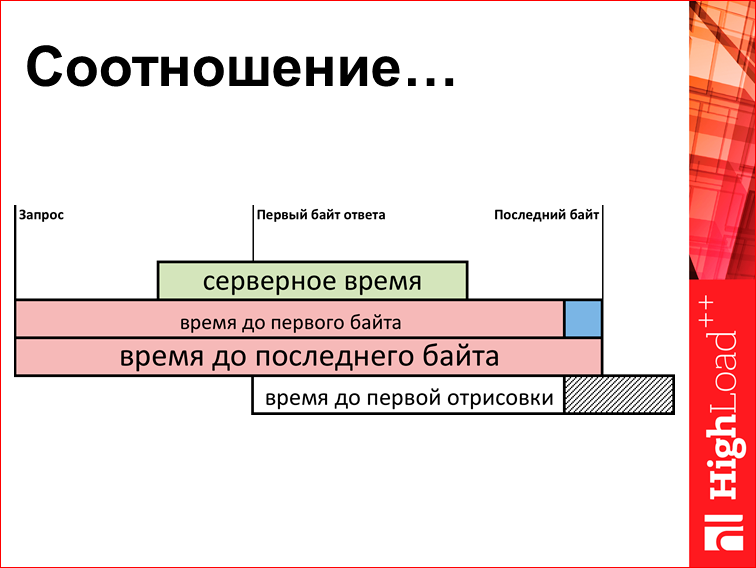
In short, there is a certain graph, which ... This is actually the first graph in the presentation that you should think about in order to understand what is drawn on it:
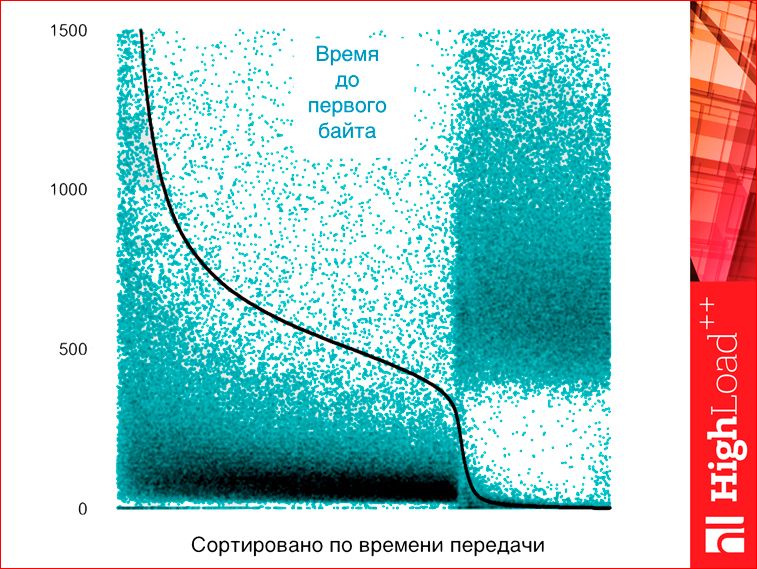
See what we do. X axis is just the number of the request. But requests are sorted by html transmission time. And on the Y axis, there is a green dot - the time to the first byte, and a black dot - the time to html transmission. Since the time of html transmission is all sorted, we have all the black points lined up in one continuous line, which is more or less logical. And since the time to the first byte is not sorted, they are not lined up, but it shows that there is some kind of correlation, i.e. there, the longer the load time of the first byte, the longer the transmission time. But here on the graph we see two clearly different clusters. The first clusters behave more or less normally, the transfer time there correlates, and it is about 70%, and the right edge 30% is the time of strange requests, which have a load time, conditionally, about 0, and the time of the first byte is not zero. Ie, roughly speaking, the page for a long, long time was tupila, and then instantly surrendered entirely. Question: what is it? You will not believe this is actually antivirus software.
How does antivirus work? Anti-Virus is very, very afraid that you will now upload to your page some kind of scary virus or an image with an exploit, or something else. Therefore, when you load something over http, the antivirus buffers everything, waits for the last bytetika, quickly checks and then spits everything out to you. Since the page is already on your computer, it turns out that the page has slowed down for a long time, then quickly came.
Question: what happens if we switch to HTTPS in this place? Immediately all antiviruses will lose the opportunity to create their magical good, and the pages start loading faster after that. This effect, in fact, about why HTTPS, despite all intuitive judgments, works faster than HTTP. And this is the reason why all sites like Google and Facebook are switching to HTTPS - it’s just stupidly faster. I understand that this is a kind of strongly revolutionary statement, so I will apply proofpic.
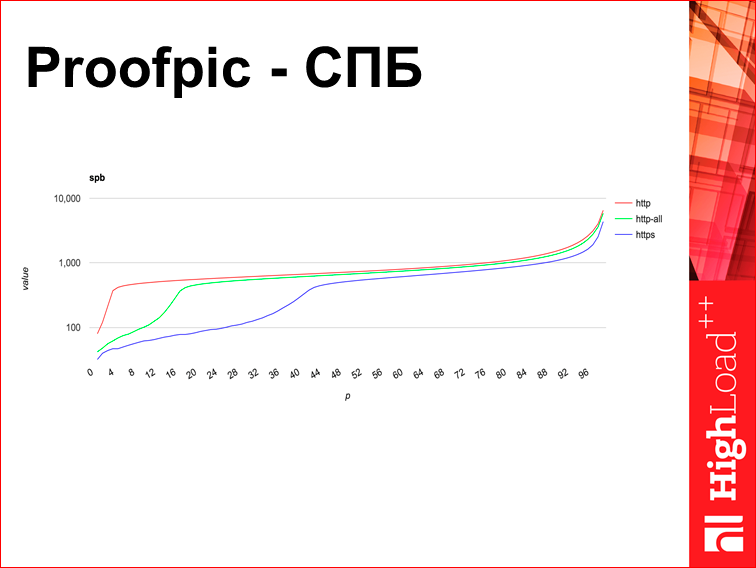
Proofpic - what is it? This is a picture from some internal Yandex interface. I redrawn previous graphs in Excel, but if I redrawn this graph in Excel, it would not be Proofpic, I could forge it. Therefore, it is with thin lines, not very convenient. This is the load time for a certain Yandex page in HTTPS and not in HTTPS in the city of St. Petersburg. The percentile is plotted along the X axis, the load time is plotted along the Y axis, while it is logarithmic, i.e. the scale is 100 thousand, 10 thousand, not 100, 200, 300. And here we see that HTTPS is faster on all percentiles.
This is the same in Vladivostok:
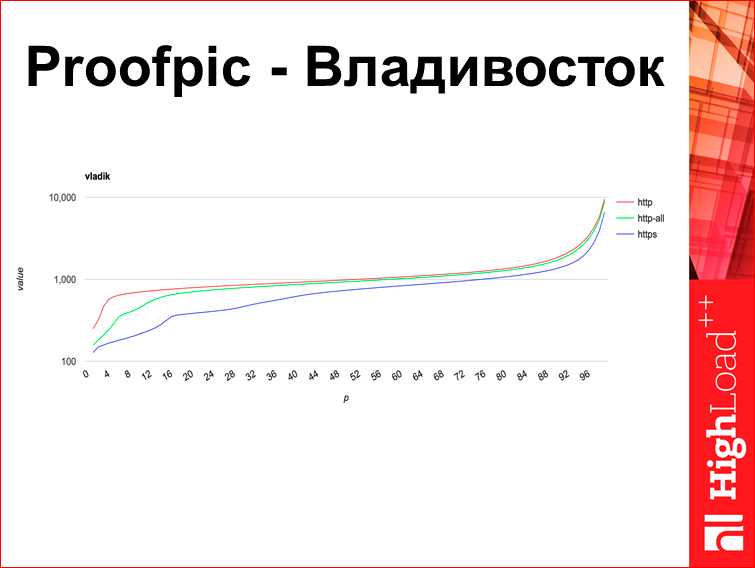
The company Yandex, when fighting with antivirus programs (we have good relations with antivirus companies), we asked them all to end up putting us in the white sheets. The graph that I built with green dots, it is very old, this is up to this point. But this effect has not disappeared, these are new graphics, literally in September. It seemed to me that these graphs give different DPI systems, which our websites are banned from, so God forbid, that there’s something bad we don’t see on the Internet. It seems there is such a thing.
This schedule from Kiev:
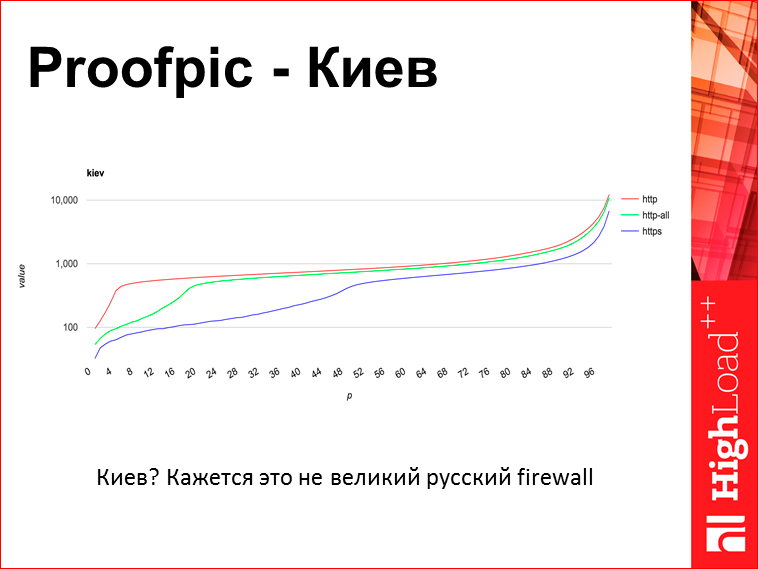
And here is exactly the same situation, which says that perhaps the great Russian DPI is not quite what, although he is somehow involved there.
And this schedule from Istanbul:
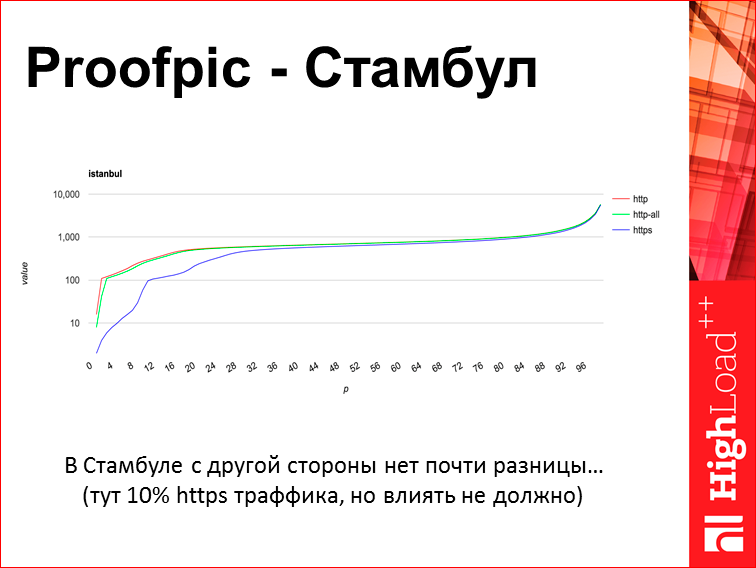
In Istanbul, as you see, HTTPS and HTTP are almost the same, there is some other situation, but I don’t know why.
The conclusion I make is about the fact that there is a huge number of different types of systems that consider themselves very smart, they are very interested in what you have there in HTTP, and because of this they are slowing down. Therefore, I urge you to use HTTPS in almost all cases.
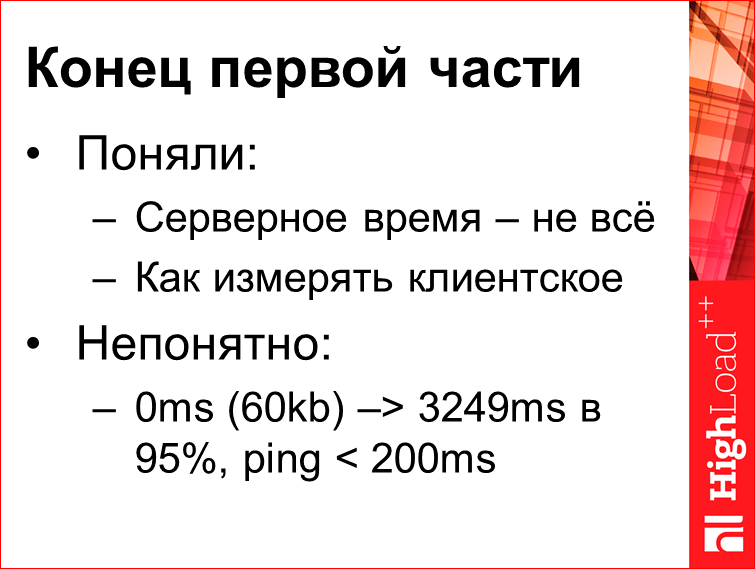
This is a kind of intermediate result, the end of the first part.
We realized that server time is not everything. And we understood how to measure client. What we do not understand here is how it turns out that in Vladivostok, until the ping is clearly less than 200 ms, the page load time in the 95th percentile can be 3 seconds, and the question is: where did these packages go around this time? And here it becomes clear the lack of those API browsers, about which I spoke, because it returns the number to you, and you yourself have no idea what this number is from, you do not know what is happening there.
There is such a magic tool called tcpdump:

All admins know and ever used it. What does the tool do? You can take off the traffic, and there will be everything, because when the server sends a bag to the user, a bag comes from the user that “dude, I received your packet”, and thus you can check the delivery time. The problem is that this thing is time consuming, and secondly, it is applied pointwise, you can watch one session, you can watch 10 sessions, but you can’t watch 1 million sessions in tcpdump. As if the work is really stupid, the question is: can it be automated? It turns out that you can.
There is such opensource tool. I wrote it.

I realized that I forgot to open a project on GitHub, but I will do it right after the report. It will be on the second link, and then it will be passed on to the first link.
What it is? This is some tool that parses tcpdumps. It parses tcpdump into a text file, which can be loaded into Excel and understand what is happening there. I can immediately say that this is not the final product, this is the hardcore tool. Do not hesitate to contact me, I'll tell you how to use it, if that.
Now I will try to give the result, which can, in fact, tool. Let's first consider this stand:
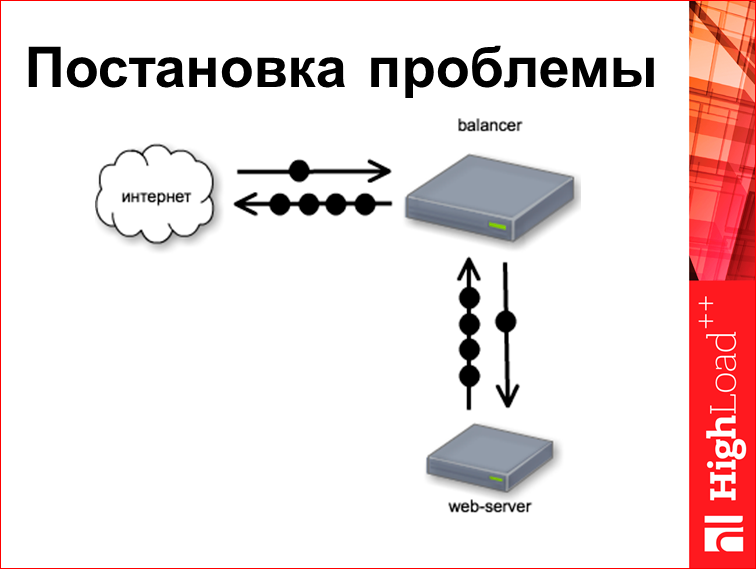
This is a kind of classic stand. We have a web server, there is some kind of balancer above it, let's say it is nginx. From the Internet comes a request. Let's try to understand what are the timings of these requests.

Customer request from us always always comes to zero millisecond, because we start to count time from it. Our balancer is very, very fast and well written, so this request goes to the backend right to the same zero millisecond, i.e. a bag came in and was thrown right away.
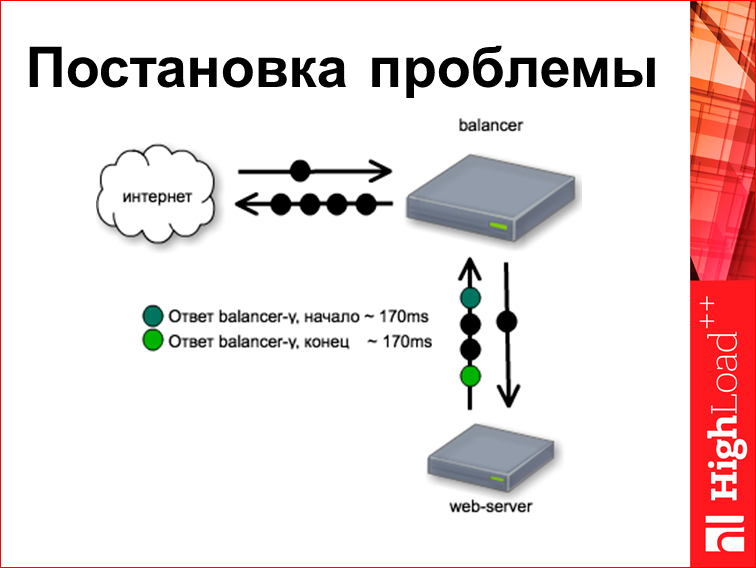
Following. Time with a web server. This particular web server is designed like this. He thinks about something 170 ms, and then fully renders the finished page. And it is worth noting that if the request is usually one bag, the answer is several bags, we take the first and the last of them, but since it was all born and spit whole, they all go to the same thing. time. And then the balancer starts distributing this page to the user, for which, in fact, nginx is written.
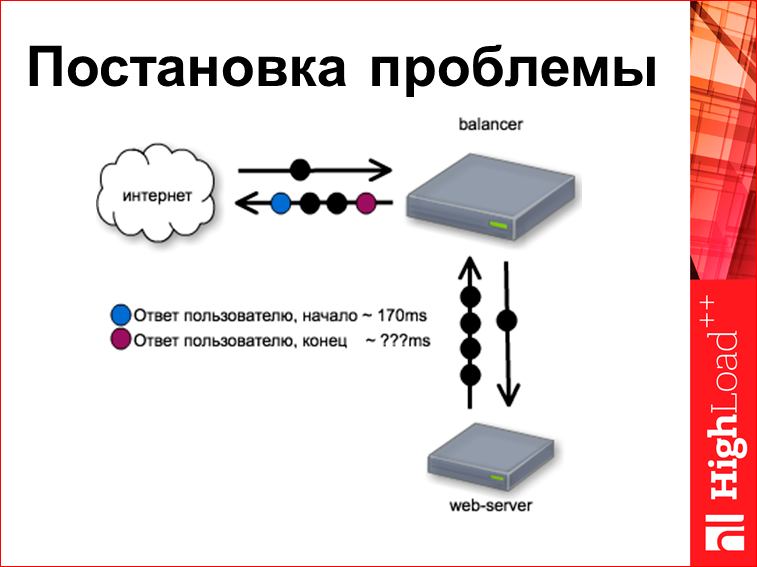
And since our balancer is fast, it gives the first byte to the user at the 170th millisecond. Question: when he will give the last baytik?
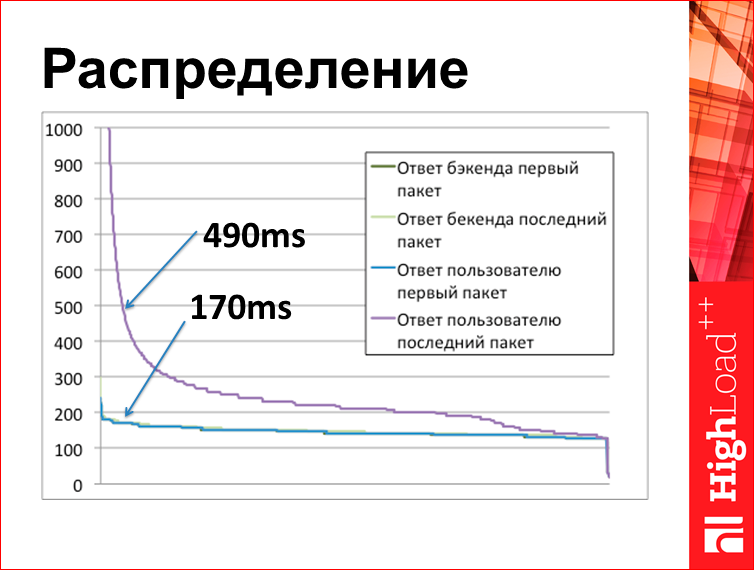
This graph is based on tcplanz results. What is on the chart here? On the X axis, the request number, sorted by time. Here, in fact, there are 4 lines, but the 3 lines below are conditionally connected into one, because they are directly about the same thing, they are all 170 ms, they are on top of each other. And the purple line is when the last byte of the response to the user from our balancer is gone. What do we see here? Our web server made a page for 170 ms, and then, when we started to send to the user, we gave the last byte for 490 ms.

Those. The conclusion is approximately as follows: when you ask the question: “where have the packages been hanging all this time?”, they actually lay on your server all this time, oddly enough. When in Vladivostok the 95th percentile is 3 seconds, all this time you have packages do not leave your server. This is a paradoxical answer. Now I will explain where it comes from.
In order to get an answer to this question, you need to know how TCP works. About TCP written a lot of books, right volume. You can even tell about TCP for a separate speech, but I will try to tell you in one slide. Although it will turn out very primitive.
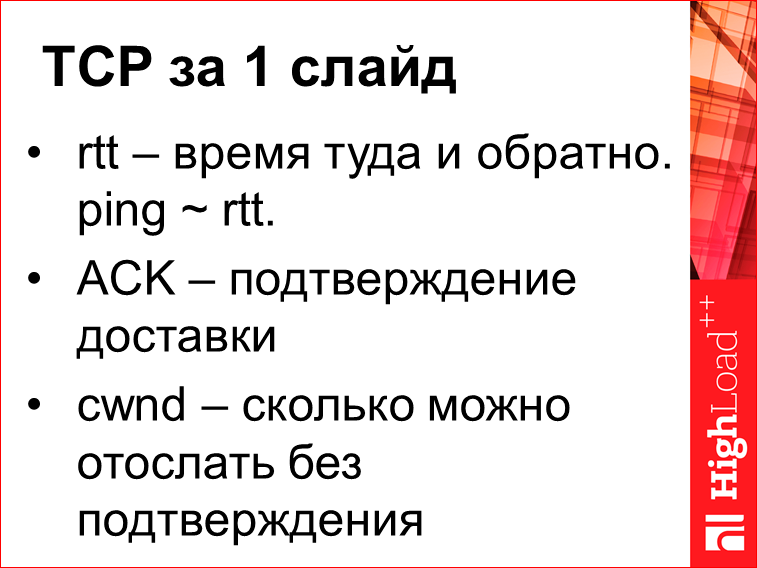
Here are three TCP concepts that need to be recognized:
- the first is the so-called round trip time is the time when the bag comes to the right server and back. When you use the ping utility, the number you see there is the time of the round trip.
- Then there is the concept of ACK - this is proof of delivery. You throw a data packet to the user, and a “dude, I got the data” packet comes from the user, and by this packet you can understand when the data is reached, because you divide the time between the packet and ack in half, and around this time it was at the user. It is worth noting that ack does not come on every packet, because one ack ack contains several packets.
- The third concept is called cwnd. congestion window. What it is? This is a certain number, which means how many packets can be sent without confirmation, i.e. You send some packets and then wait for confirmation until it arrives.
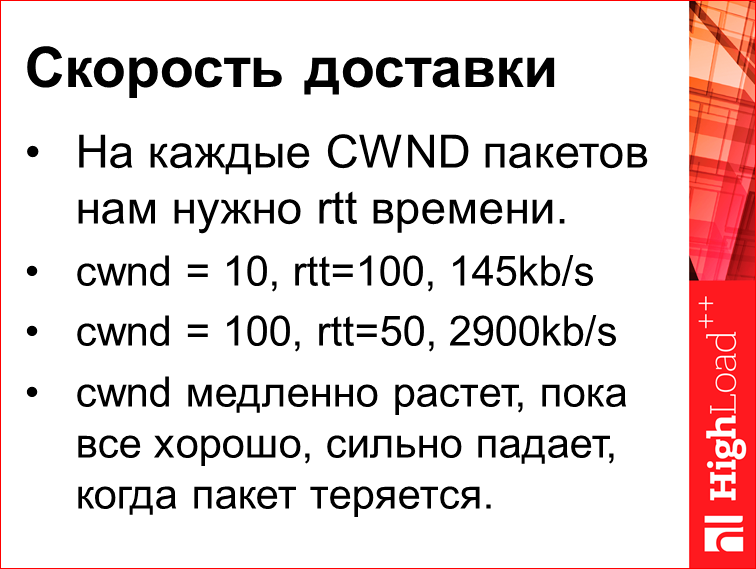
What determines the speed of delivery. The rule is very simple: for every CWND packet, you need rtt time. Those. on the Internet, the typical packet size is 1450 bytes, or 1410, when you have cwnd = 10, rtt = 100, then your flow rate will be 145 Kbytes per second. When you have cwnd = 100, rtt = 50, the speed will be almost 3 meters per second. And cwnd is not some tough-looking parameter, it is a parameter that controls the speed of the TCP channel. There are actually many policies that can be applied, but the rule is very simple: cwnd grows slowly, so far so good, that is, while the sachets go, and it drops a lot when something bad happens in the channel when the packet is lost. A typical policy that can be applied - for each ack can be increased by one, and when a package is lost - cut in half. This is such the oldest, now new, more fashionable all sorts of politicians, etc.
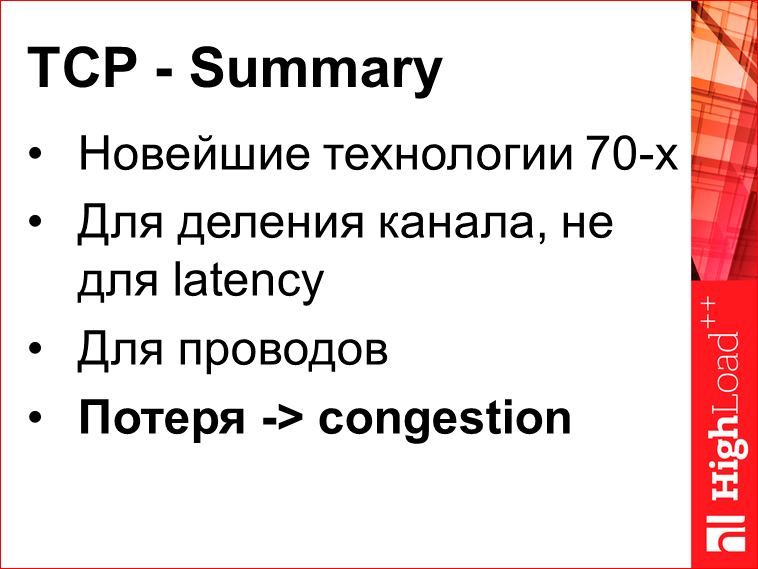
Total, what do we know about TCP? In general, this is the newest protocol, made in the 70th year, now a little outdated. , , 70- . , - TP-, , -, .
, , .. , wi-fi, , . assumption , , : congestion. What it is? , , , , — 100- 100- , , , , . TCP , , , , , . , . Why?Because packets are no longer transmitted by wire, they are transmitted, for example, via wi-fi, and a wi-fi package can disappear just like that, not because the speed is exceeded, but because it is not lucky.
Many people do not understand how wi-fi works. They believe that this is some kind of radio that hits through the wall. Here is an example of the spread of wi-fi waves in an apartment:
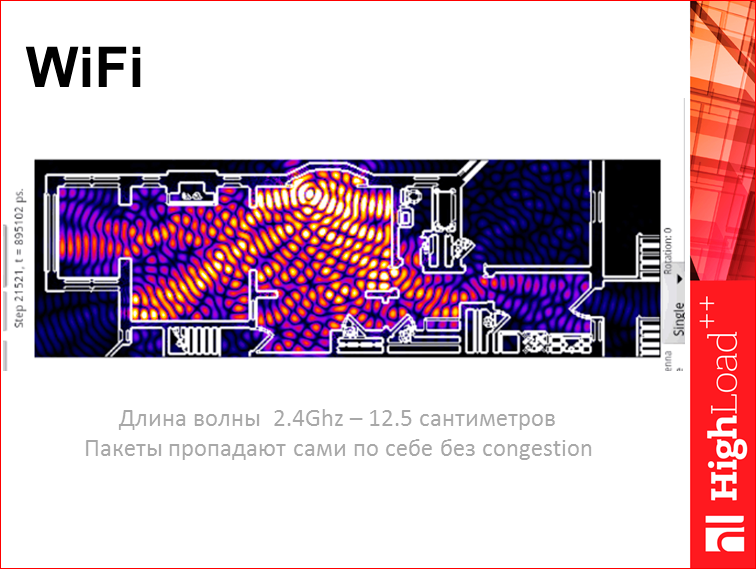
Obviously, wi-fi wraps the walls, here it is written in which wall it falls. Wi-fi interferes on itself, waves intersect with themselves, with other devices, etc. You understand that in wi-fi a sachet is just lost and that's it, this is just such a limitation. Wi-fi has a wavelength of 12.5 cm, if a wi-fi router is very, very accurate to the wall, not 12.5 cm from the wall, but 12.5 cm from the iron part of the wall, you can get a so-called standing wave when our router stops working at all. So that you understand, everything is strange. And therefore in wi-fi it is absolutely normal that packets are lost there. But TCP, when he sees lost wi-fi packets, he begins to slow down, which is unclear why.
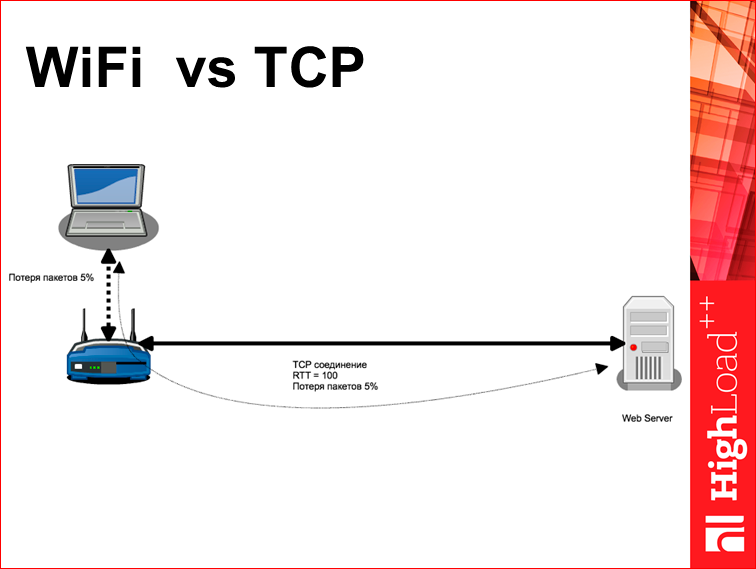
— wi-fi vs TCP. , - 2000 rtt=100. 2000 , . , - , . wi-fi , 20 . , 20 . Those. 5% wi-fi — , wi-fi. , , , 80% - . , TCP-, : rtt=100 5%. , . , , .
What to do? — .

-, , , -, , - . , - , .. , . - .
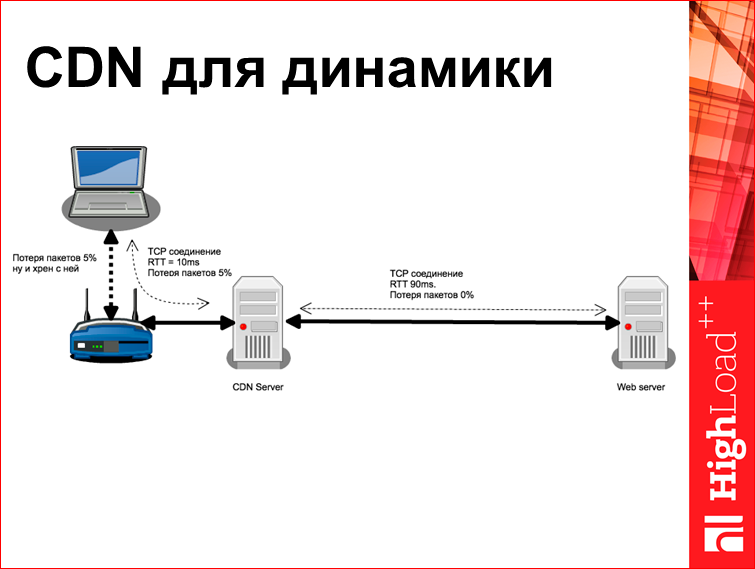
, CDN, , CDN - , , , - . In fact, this is not true. , CDN , - , loop, TCP- 5% rtt=100. TCP-, 0% rtt=90, - , 0% KeepAlive-, CWND - , . CDN- 5% , , , rtt 10 .
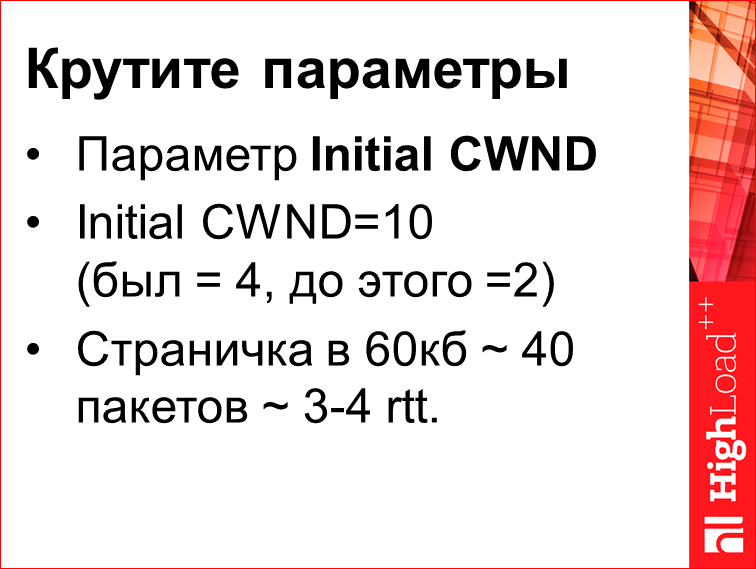
TCP. , Initial CWND, CWND, TCP-. Initial CWND=10. «10» , , - .
. RFC, , 1 2. - RFC, , 2 4. Google , 10. , , 10 — , , ? 10 , , 3-4 rtt, 10 14 . , 3, 4 rtt, . , , .. , .
This parameter can be tweaked.
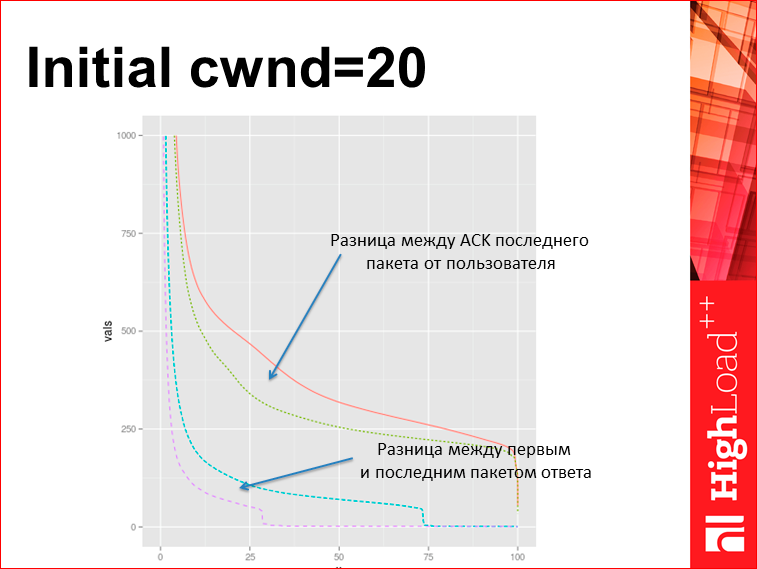
For example, an experiment in Yandex. This is a Turkish balancer, they took and set the initial cwnd = 20. Note that this is one unix sysctl. What happened?Here are 4 graphics. They are in pairs - it was, it became. The lower graph shows the delay between the first and the last packet of the tcpdump response. Those.we see that a third of the pages used to go away immediately, without waiting, now 2/3 began to go away. And at the top - this is the time to get the user ack, that the page reached. For tcpdump, this is the same value as the time to the last byte in the browser that was. Those.we just twisted the sysctl and improved the page load from scratch. This is an example of how you can be creative with TCP.
For the sake of justice, it must be said that it was a type of face, we tried to do the same thing with the search results, they were just bigger, and it turned out rather strange - some classes of queries got stronger, and some worsened. There apparently you need to be able to rotate this parameter separately for different clients, which the core does not allow to do now.
There is such a crazy example:

Why mad? Because I did not do it myself and do not urge you to do so. But he well illustrates what can be done in TCP. Imagine that you ignore CWND altogether. Those. , 60 — 40 , . , , 1 . 40 . , , , , 70%. - — , , , , . , - , , selective ack (, « , 3, 10, 17- », 3, 10, 17- ). So : 1-2 rtt. Those.it's faster, it's not 3 seconds. This is a good example of how to spoil TCP so that it becomes faster.
The problem is that now this can not be done, because TCP is spinning somewhere in the core, and there are no handles on the outside, and you still have to turn it to the first connection. Those. user agent , mobile safari -, , - , .
, QUIC. , UD-based. , , TCP, UDP. — , user space. user agent .. , QUIC, , , . Why?Because if you do this, you will get better, but if everything is done on the Internet, then the Internet will break.
Can not do. There is an asterisk, it stands for something like this: if you look at your CDN, what is written is exactly what is happening inside. There even without a pause of 1 ms. There are computers that trust each other, that they are able to receive a large amount of data, channels that have nothing to lose, almost no congestion, and any page that you throw inside the CDN, it all goes there, because CWND is awesome, overclocked . And this is how the CDN works with a large, large number of companies.
At this point, I want to take some results.
It is necessary to understand that those 3 seconds of the server that are there, they do not occur because the package on the Internet is hanging around somewhere, the package lies on your machine at this time, and your own machine delays it due to the protocol restriction.
Silver bullet is not here, but here you can optimize something. Then, if you work with browsers, you do not have much room for optimization, but if you are writing a mobile application, you can do QUIC right now.
And third, when you do optimization, please watch what happens. There are tools, Timing API in browsers, there are tcpdump in which you can understand everything that happens. Just take and see.
Contacts
» Anatolix@yandex.ru
» den@yandex-team.ru
» Yandex company blog
— , ( ) .
— HighLoad++ .
Also, some of these materials are used by us in an online training course on the development of high-load systems HighLoad.Guide is a chain of specially selected letters, articles, materials, videos. Already, in our textbook more than 30 unique materials. Get connected!
Well, the main news is that we have begun preparations for the spring festival " Russian Internet Technologies ", which includes eight conferences, including HighLoad ++ Junior . Junior — ! Junior , , , .
Source: https://habr.com/ru/post/319114/
All Articles