About Z-order and R-tree

An index based on a Z-order curve versus an R-tree has many advantages, it is:
- implemented as a normal b-tree, and we know that
- B-tree pages have better occupancy, moreover,
- Z-keys themselves are more compact.
- B-tree has a natural traversal order, unlike R-tree.
- B-tree is built faster
- B-tree is better balanced
- B-tree is clearer, does not depend on page splitting / merging heuristics
- B-tree does not degrade with constant changes
- ...
However, Z-order-based indexes have a disadvantage - relatively low productivity :). Under the cut, we will try to figure out what this flaw is connected with and whether something can be done about it.
Roughly, the meaning of the Z-curve is as follows - we alternate the digits of the x & y coordinates in one value, as a result. Example - (x = 33 ( 010 0001 ), y = 22 ( 01 0110 ), Z = 1577 ( 0 1 1 0 0 0 1 0 1 0 0 1 ). If two points have close coordinates, then most likely Z- their values will be close.
The three-dimensional (or more) version is arranged in the same way, we alternate the digits of three (or more) coordinates.
And to search in a certain extent, we must “rasterize” all values of the Z-curve for this extent, find continuous intervals and search in each one.
')
Here is an illustration for the extent [111000 ... 111000] [111400 ... 111400] (675 intervals), the upper right corner (each continuous polyline - one interval):
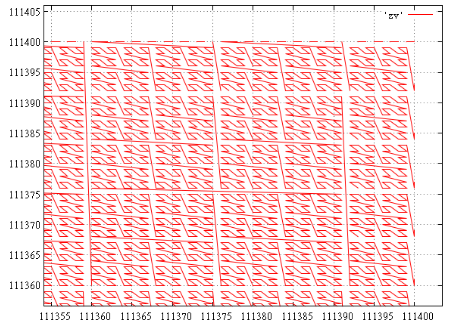
And, for example, for the extent [111000 ... 111000] [112000 ... 112000] we get 1688 continuous intervals, obviously, their number mainly depends on the length of the perimeter. Looking ahead, on the test data, 15 points in 6 intervals fell into this extent.
Yes, most of these intervals are small, even degenerate - from one value. And nevertheless, even if in all this extent there is only one value, it can be in any of the intervals. And, like it or not, we will have to do all 1,688 subqueries to find out how many points there really are.
To view everything from the value of the lower left corner to the upper right is not an option, the difference between the angles in this case is 3,144,768, we will have to view more than three times more data, and this is not the worst case. For example, an extent [499500 ... 499500] [500500 ... 500500] will give a range of 135,263,808 values, ~ 135 times the extent of the extent.
And here we can ask the traditional question -
What if ...
Suppose we have an empty index in general, do we really need to do all these hundreds and thousands of subqueries in order to understand this? No, one is enough - from the lower left to the upper right corner.
Now suppose that the extent is small enough, the data are sparse and there is little chance of finding something small. Perform the same query from corner to corner. If nothing is found, then nothing. Otherwise there is a chance. But as we have seen, the area swept up by the request from corner to corner can be many times the search extent and we have no desire to deduct obviously unnecessary data. Therefore, we will not look through the entire cursor, but take only the minimum Z-value from it. For this, the query is executed with (order by) and (top 1).
So, we have some value. Suppose this value is not from our extent, what can it give? It's time to remember that we have a sorted array of [1 ... N] subquery ranges. We will perform a binary search and find out between which subqueries this value was squeezed in, say, between m and m + 1. Remarkably, it means that requests from 1 to m can be omitted, there is obviously nothing there.
If the value belongs to our extent, then it falls into one of our ranges and we can also find in which, let m too. As before, requests with numbers 1 ... m-1 can not be executed. But the interval with the number m deserves a separate request, which will give us everything that is located in it.
Well, perhaps there is still data, let's continue. Again we will execute the query, but not from the corner to the corner, but from the beginning of the interval m + 1 to the upper right corner. And we will do so until we reach the end of the list of intervals.
That's the whole idea, we note, it works fine in the case when a lot or even a lot of data falls into the extent. At first glance, this will significantly reduce the number of requests and speed up work.
It's time to test the idea in practice. We’ll use PostgeSQL 9.6.1, GiST as a test site. The measurements were conducted on a modest virtual machine with two cores and 4 GB of RAM, so the times have no absolute value, but the numbers of the pages you read can be trusted.
Initial data
As data, 100 million random points in the extent [0 ... 1 000 000] [0 ... 1 000 000] were used.
Let's get a table for 2-dimensional point data:
create table test_points (x integer,y integer); We will create the data:
gawk script
BEGIN {
for (i = 0; i <100000000; i ++)
{
x = int (1000000 * rand ());
y = int (1000000 * rand ());
print x "\ t" z;
}
exit (0);
}
for (i = 0; i <100000000; i ++)
{
x = int (1000000 * rand ());
y = int (1000000 * rand ());
print x "\ t" z;
}
exit (0);
}
Sort the resulting file (explained below) and fill it with the COPY operator into the table:
COPY test_points from '/home/.../data.csv'; Filling the table takes a few minutes. Data size (\ dt +) - 4358 Mb
R-tree
The corresponding index is created by the command:
create index test_gist_idx on test_points using gist ((point(x,y))); But there is a nuance. On random data, the index is built for a very long time (in any case, the author did not manage to line up overnight). Building on the pre-sorted data took about an hour.
Index size (\ di +) - 9031 Mb
In essence, for us the order of the data in the table is not important, but it must be common to different methods, so I had to use a sorted table.
The test query looks like this:
select count(1) from test_points where point(x,y) <@ box(point("xmin","ymin"),point("xmax","ymax")); Check on ordinary indexes
To test the functionality we will perform spatial queries and on separate indexes on x & y. They are made like this:
create index x_test_points on test_points (x); create index y_test_points on test_points (y); It takes a few minutes.
Test request:
select count(1) from test_points where x >= "xmin" and x <= "xmax" and y >= "ymin" and y <= "ymax"; Z-index
Now we need a function that can convert x, y coordinates to a Z-value.
First we create an extension , in it a function:
CREATE FUNCTION zcurve_val_from_xy(bigint, bigint) RETURNS bigint AS 'MODULE_PATHNAME' LANGUAGE C IMMUTABLE STRICT; Her body:
static uint32 stoBits[8] = {0x0001, 0x0002, 0x0004, 0x0008, 0x0010, 0x0020, 0x0040, 0x0080}; uint64 zcurve_fromXY (uint32 ix, uint32 iy) { uint64 val = 0; int curmask = 0xf; unsigned char *ptr = (unsigned char *)&val; int i; for (i = 0; i < 8; i++) { int xp = (ix & curmask) >> (i<<2); int yp = (iy & curmask) >> (i<<2); int tmp = (xp & stoBits[0]) | ((yp & stoBits[0])<<1) | ((xp & stoBits[1])<<1) | ((yp & stoBits[1])<<2) | ((xp & stoBits[2])<<2) | ((yp & stoBits[2])<<3) | ((xp & stoBits[3])<<3) | ((yp & stoBits[3])<<4); curmask <<= 4; ptr[i] = (unsigned char)tmp; } return val; } Datum zcurve_val_from_xy(PG_FUNCTION_ARGS) { uint64 v1 = PG_GETARG_INT64(0); uint64 v2 = PG_GETARG_INT64(1); PG_RETURN_INT64(zcurve_fromXY(v1, v2)); } Now (after CREATE EXTENSION, of course) the Z-index is constructed as follows:
create index zcurve_test_points on test_points(zcurve_val_from_xy(x, y)); This takes several minutes (and does not require data sorting).
Index size (\ di +) - 2142 Mb (~ 4 times smaller than that of R-tree)
Z Index Search
So, in our first (let's call it “naive”) version, we will do this:
- For an extent of size dx * dy, we create an array of identifiers of the appropriate size
- Z-value is calculated for each point in extent.
- Sorting an array of identifiers
- Find continuous intervals
- For each interval we execute the following subquery:
select * from test_points where zcurve_val_from_xy(x, y) between $1 and $2 - We get the result
To search using this option, we will use the function (body below):
CREATE FUNCTION zcurve_oids_by_extent(bigint, bigint, bigint, bigint) RETURNS bigint AS 'MODULE_PATHNAME' LANGUAGE C IMMUTABLE STRICT; Spatial query using this function looks like this:
select zcurve_oids_by_extent("xmin","ymin","xmax","ymax") as count; The function returns only the number of hits, the data itself, if necessary, can be displayed using “ elog (INFO ...) ”.
The second, improved (let's call it “with samples”) option looks like this:
- for an extent of size dx * dy, we create an array of identifiers of the appropriate size
- Z-value is calculated for each point in extent.
- sort the array of identifiers
- find continuous intervals
- we start from the first interval found:
- Perform a “test” type request (parameters - interval limits):
select * from test_points where zcurve_val_from_xy(x, y) between $1 and $2 order by zcurve_val_from_xy(x, y) limit 1 - This query gives us the table row with the smallest Z-value from the beginning of the current test interval to the end of the search extent.
- If the query did not find anything, then there is no data left in the search extent, we exit.
- Now we can analyze the found Z-value:
- We look, whether it got in any of our intervals.
- If not, find the number of the next remaining interval and go to point 5.
- If horrible, we execute a query for this interval of type:
select * from test_points where zcurve_val_from_xy(x, y) between $1 and $2 - Take the next interval and go to point 5.
- Perform a “test” type request (parameters - interval limits):
To search using this option, we will use the function:
CREATE FUNCTION zcurve_oids_by_extent_ii(bigint, bigint, bigint, bigint) RETURNS bigint AS 'MODULE_PATHNAME' LANGUAGE C IMMUTABLE STRICT; Spatial query using this function looks like this:
select zcurve_oids_by_extent_ii("xmin","ymin","xmax","ymax") as count; The function also returns only the number of hits.
Rasterization
In the described algorithms, a very simple and inefficient “rasterization” algorithm is used - obtaining a list of intervals.
On the other hand, it is easy to perform measurements of the average times of its work on random extents of the desired size. Here they are:
| Dx * dy extent | Expected average number of points in the output | Time, msec |
|---|---|---|
| 100X100 | one | .96 (.37 + .59) |
| 316X316 | ten | 11 (3.9 + 7.1) |
| 1000X1000 | 100 | 119.7 (35 + 84.7) |
| 3162X3162 | 1000 | 1298 (388 + 910) |
| 10000X10000 | 10,000 | 14696 (3883 + 10813) |
results
Here is a summary table with data.
| Npoints | Type | Time (ms) | Reads | Shared hits |
|---|---|---|---|---|
| one | X & Y rtree Z-value Z-value-ii | 43.6 .five 8.3 (9.4) 1.1 (2.2) | 59.0173 4.2314 4.0988 4.1984 (12.623) | 6.1596 2.6565 803.171 20.1893 (57.775) |
| ten | X & Y rtree Z-value Z-value-ii | 83.5 .6 15 (26) 4 (15) | 182.592 13.7341 14.834 14.832 (31.439) | 9.24363 2.72466 2527.56 61.814 (186.314) |
| 100 | X & Y rtree Z-value Z-value-ii | 220 2.1 80 (200) 10 (130) | 704.208 95.8179 95.215 96.198 (160.443) | 16.528 5.3754 8007.3 208.214 (600.049) |
| 1000 | X & Y rtree Z-value Z-value-ii | 740 12 500 (1800) 200 (1500) | 3176.06 746.617 739.32 739.58 (912.631) | 55.135 25.439 25816 842.88 (2028.81) |
| 10,000 | X & Y rtree Z-value Z-value-ii | 2,500 70 ... 1 200 4700 (19000) 1300 (16000) | 12393.2 4385.64 4284.45 4305.78 (4669) | 101.43 121.56 86274.9 5785.06 (9188) |
Type -
- 'X & Y' - use separate indexes on x & y
- 'rtree' - request via R-tree
- Z-value - fair search at intervals
- 'Z-value-ii' - search at intervals with samples
Time (ms) - the average time of the request. Under these conditions, the value is very unstable, it depends on the DBMS cache and on the disk cache of the virtual machine and on the disk cache of the host system. Here is more for reference. For Z-value and Z-value-ii are 2 numbers. In brackets - the actual time. Without brackets - time minus the cost of "rasterization".
Reads - the average number of reads per request (obtained through EXPLAIN (ANALYZE, BUFFERS))
Shared hits - the number of calls to the buffers (...)
For Z-value-ii, 2 numbers are given in the Reads & Shared hits columns. In brackets - the total number of readings. No brackets - minus probe requests with order by and limit 1. This is done because of the opinion that such a query reads all the data in the interval, sorts and gives the minimum, instead of just giving 1 value from an already sorted index. Therefore, statistics on such requests was deemed unnecessary, but given for reference.
The times are shown on the second runs, on the heated server and the virtual machine. The number of buffers read is on a freshly raised server.
In all types of queries, the data of the table itself was also not belonging to indexes. However, this is the same data of the same table, so for all types of queries we obtained constant values.
findings
- R-tree is still very good in statics, the efficiency of page reads is very high.
- But the Z-order index sometimes has to read pages that do not have the necessary data. This happens when the testing cursor falls between the intervals, there is a chance that there will be many other points in this gap and the specific page does not contain any summary data.
- Nevertheless, due to the more dense packing, the Z-order is close to the R-tree by the number of actually read pages . This suggests that potentially Z-order is capable of delivering similar performance.
- Z-order index reads a huge number of pages from the cache. multiple requests are made in the same place. On the other hand, these readings are relatively inexpensive.
- On large queries, Z-order loses much of its speed in an R-tree. This is explained by the fact that we use SPI , a high-level and not too fast mechanism, for executing subqueries. And with “rasterization”, of course, something needs to be done.
- At first glance, the use of sample intervals did not greatly accelerate the work, and formally even worsened the statistics of page readings. But we must understand that these are the costs of the high-level funds that had to be used. Potentially, an index based on Z-order is not worse than an R-tree in performance and much better in other tactical and technical characteristics.
Perspectives
To create a full spatial index based on a Z-order curve that would be able to compete on equal terms with an R-tree, the following problems must be solved:
- come up with an inexpensive algorithm for obtaining a list of subintervals by extent
- go to low-level access to the index tree
Fortunately, both do not seem impossible.
Sources
#include "postgres.h" #include "catalog/pg_type.h" #include "fmgr.h" #include <string.h> #include "executor/spi.h" PG_MODULE_MAGIC; uint64 zcurve_fromXY (uint32 ix, uint32 iy); void zcurve_toXY (uint64 al, uint32 *px, uint32 *py); static uint32 stoBits[8] = {0x0001, 0x0002, 0x0004, 0x0008, 0x0010, 0x0020, 0x0040, 0x0080}; uint64 zcurve_fromXY (uint32 ix, uint32 iy) { uint64 val = 0; int curmask = 0xf; unsigned char *ptr = (unsigned char *)&val; int i; for (i = 0; i < 8; i++) { int xp = (ix & curmask) >> (i<<2); int yp = (iy & curmask) >> (i<<2); int tmp = (xp & stoBits[0]) | ((yp & stoBits[0])<<1) | ((xp & stoBits[1])<<1) | ((yp & stoBits[1])<<2) | ((xp & stoBits[2])<<2) | ((yp & stoBits[2])<<3) | ((xp & stoBits[3])<<3) | ((yp & stoBits[3])<<4); curmask <<= 4; ptr[i] = (unsigned char)tmp; } return val; } void zcurve_toXY (uint64 al, uint32 *px, uint32 *py) { unsigned char *ptr = (unsigned char *)&al; int ix = 0; int iy = 0; int i; if (!px || !py) return; for (i = 0; i < 8; i++) { int tmp = ptr[i]; int tmpx = (tmp & stoBits[0]) + ((tmp & stoBits[2])>>1) + ((tmp & stoBits[4])>>2) + ((tmp & stoBits[6])>>3); int tmpy = ((tmp & stoBits[1])>>1) + ((tmp & stoBits[3])>>2) + ((tmp & stoBits[5])>>3) + ((tmp & stoBits[7])>>4); ix |= tmpx << (i << 2); iy |= tmpy << (i << 2); } *px = ix; *py = iy; } PG_FUNCTION_INFO_V1(zcurve_val_from_xy); Datum zcurve_val_from_xy(PG_FUNCTION_ARGS) { uint64 v1 = PG_GETARG_INT64(0); uint64 v2 = PG_GETARG_INT64(1); PG_RETURN_INT64(zcurve_fromXY(v1, v2)); } static const int s_maxx = 1000000; static const int s_maxy = 1000000; #ifndef MIN #define MIN(a,b) ((a)<(b)?(a):(b)) #endif static int compare_uint64( const void *arg1, const void *arg2 ) { const uint64 *a = (const uint64 *)arg1; const uint64 *b = (const uint64 *)arg2; if (*a == *b) return 0; return *a > *b ? 1: -1; } SPIPlanPtr prep_interval_request(); int fin_interval_request(SPIPlanPtr pplan); int run_interval_request(SPIPlanPtr pplan, uint64 v0, uint64 v1); SPIPlanPtr prep_interval_request() { SPIPlanPtr pplan; char sql[8192]; int nkeys = 2; Oid argtypes[2] = {INT8OID, INT8OID}; /* key types to prepare execution plan */ int ret =0; if ((ret = SPI_connect()) < 0) /* internal error */ elog(ERROR, "check_primary_key: SPI_connect returned %d", ret); snprintf(sql, sizeof(sql), "select * from test_points where zcurve_val_from_xy(x, y) between $1 and $2"); /* Prepare plan for query */ pplan = SPI_prepare(sql, nkeys, argtypes); if (pplan == NULL) /* internal error */ elog(ERROR, "check_primary_key: SPI_prepare returned %d", SPI_result); return pplan; } int fin_interval_request(SPIPlanPtr pplan) { SPI_finish(); return 0; } int run_interval_request(SPIPlanPtr pplan, uint64 v0, uint64 v1) { Datum values[2]; /* key types to prepare execution plan */ Portal portal; int cnt = 0, i; values[0] = Int64GetDatum(v0); values[1] = Int64GetDatum(v1); portal = SPI_cursor_open(NULL, pplan, values, NULL, true); if (NULL == portal) /* internal error */ elog(ERROR, "check_primary_key: SPI_cursor_open"); for (;;) { SPI_cursor_fetch(portal, true, 8); if (0 == SPI_processed || NULL == SPI_tuptable) break; { TupleDesc tupdesc = SPI_tuptable->tupdesc; for (i = 0; i < SPI_processed; i++) { HeapTuple tuple = SPI_tuptable->vals[i]; //elog(INFO, "%s, %s", SPI_getvalue(tuple, tupdesc, 1), SPI_getvalue(tuple, tupdesc, 2)); cnt++; } } } SPI_cursor_close(portal); return cnt; } PG_FUNCTION_INFO_V1(zcurve_oids_by_extent); Datum zcurve_oids_by_extent(PG_FUNCTION_ARGS) { SPIPlanPtr pplan; uint64 x0 = PG_GETARG_INT64(0); uint64 y0 = PG_GETARG_INT64(1); uint64 x1 = PG_GETARG_INT64(2); uint64 y1 = PG_GETARG_INT64(3); uint64 *ids = NULL; int cnt = 0; int sz = 0, ix, iy; x0 = MIN(x0, s_maxx); y0 = MIN(y0, s_maxy); x1 = MIN(x1, s_maxx); y1 = MIN(y1, s_maxy); if (x0 > x1) elog(ERROR, "xmin > xmax"); if (y0 > y1) elog(ERROR, "ymin > ymax"); sz = (x1 - x0 + 1) * (y1 - y0 + 1); ids = (uint64*)palloc(sz * sizeof(uint64)); if (NULL == ids) /* internal error */ elog(ERROR, "cant alloc %d bytes in zcurve_oids_by_extent", sz); for (ix = x0; ix <= x1; ix++) for (iy = y0; iy <= y1; iy++) { ids[cnt++] = zcurve_fromXY(ix, iy); } qsort (ids, sz, sizeof(*ids), compare_uint64); cnt = 0; pplan = prep_interval_request(); { // FILE *fl = fopen("/tmp/ttt.sql", "w"); int cur_start = 0; int ix; for (ix = cur_start + 1; ix < sz; ix++) { if (ids[ix] != ids[ix - 1] + 1) { cnt += run_interval_request(pplan, ids[cur_start], ids[ix - 1]); // fprintf(fl, "EXPLAIN (ANALYZE,BUFFERS) select * from test_points where zcurve_val_from_xy(x, y) between %ld and %ld;\n", ids[cur_start], ids[ix - 1]); // elog(INFO, "%d -> %d (%ld -> %ld)", cur_start, ix - 1, ids[cur_start], ids[ix - 1]); // cnt++; cur_start = ix; } } if (cur_start != ix) { cnt += run_interval_request(pplan, ids[cur_start], ids[ix - 1]); // fprintf(fl, "EXPLAIN (ANALYZE,BUFFERS) select * from test_points where zcurve_val_from_xy(x, y) between %ld and %ld;\n", ids[cur_start], ids[ix - 1]); // elog(INFO, "%d -> %d (%ld -> %ld)", cur_start, ix - 1, ids[cur_start], ids[ix - 1]); } // fclose(fl); } fin_interval_request(pplan); pfree(ids); PG_RETURN_INT64(cnt); } //------------------------------------------------------------------------------------------------ struct interval_ctx_s { SPIPlanPtr cr_; SPIPlanPtr probe_cr_; uint64 cur_val_; uint64 top_val_; FILE * fl_; }; typedef struct interval_ctx_s interval_ctx_t; int prep_interval_request_ii(interval_ctx_t *ctx); int run_interval_request_ii(interval_ctx_t *ctx, uint64 v0, uint64 v1); int probe_interval_request_ii(interval_ctx_t *ctx, uint64 v0); int fin_interval_request_ii(interval_ctx_t *ctx); int prep_interval_request_ii(interval_ctx_t *ctx) { char sql[8192]; int nkeys = 2; Oid argtypes[2] = {INT8OID, INT8OID}; /* key types to prepare execution plan */ int ret =0; if ((ret = SPI_connect()) < 0) /* internal error */ elog(ERROR, "check_primary_key: SPI_connect returned %d", ret); snprintf(sql, sizeof(sql), "select * from test_points where zcurve_val_from_xy(x, y) between $1 and $2"); ctx->cr_ = SPI_prepare(sql, nkeys, argtypes); if (ctx->cr_ == NULL) /* internal error */ elog(ERROR, "check_primary_key: SPI_prepare returned %d", SPI_result); snprintf(sql, sizeof(sql), "select * from test_points where zcurve_val_from_xy(x, y) between $1 and %ld order by zcurve_val_from_xy(x::int4, y::int4) limit 1", ctx->top_val_); ctx->probe_cr_ = SPI_prepare(sql, 1, argtypes); if (ctx->probe_cr_ == NULL) /* internal error */ elog(ERROR, "check_primary_key: SPI_prepare returned %d", SPI_result); return 1; } int probe_interval_request_ii(interval_ctx_t *ctx, uint64 v0) { Datum values[1]; /* key types to prepare execution plan */ Portal portal; values[0] = Int64GetDatum(v0); { // uint32 lx, ly; // zcurve_toXY (v0, &lx, &ly); // // elog(INFO, "probe(%ld:%d,%d)", v0, lx, ly); } if (ctx->fl_) fprintf(ctx->fl_, "EXPLAIN (ANALYZE,BUFFERS) select * from test_points where zcurve_val_from_xy(x, y) between %ld and %ld order by zcurve_val_from_xy(x::int4, y::int4) limit 1;\n", v0, ctx->top_val_); portal = SPI_cursor_open(NULL, ctx->probe_cr_, values, NULL, true); if (NULL == portal) /* internal error */ elog(ERROR, "check_primary_key: SPI_cursor_open"); { SPI_cursor_fetch(portal, true, 1); if (0 != SPI_processed && NULL != SPI_tuptable) { TupleDesc tupdesc = SPI_tuptable->tupdesc; bool isnull; HeapTuple tuple = SPI_tuptable->vals[0]; Datum dx, dy; uint64 zv = 0; dx = SPI_getbinval(tuple, tupdesc, 1, &isnull); dy = SPI_getbinval(tuple, tupdesc, 2, &isnull); zv = zcurve_fromXY(DatumGetInt64(dx), DatumGetInt64(dy)); // elog(INFO, "%ld %ld -> %ld", DatumGetInt64(dx), DatumGetInt64(dy), zv); ctx->cur_val_ = zv; SPI_cursor_close(portal); return 1; } SPI_cursor_close(portal); } return 0; } int run_interval_request_ii(interval_ctx_t *ctx, uint64 v0, uint64 v1) { Datum values[2]; /* key types to prepare execution plan */ Portal portal; int cnt = 0, i; values[0] = Int64GetDatum(v0); values[1] = Int64GetDatum(v1); // elog(INFO, "[%ld %ld]", v0, v1); if (ctx->fl_) fprintf(ctx->fl_, "EXPLAIN (ANALYZE,BUFFERS) select * from test_points where zcurve_val_from_xy(x, y) between %ld and %ld;\n", v0, v1); portal = SPI_cursor_open(NULL, ctx->cr_, values, NULL, true); if (NULL == portal) /* internal error */ elog(ERROR, "check_primary_key: SPI_cursor_open"); for (;;) { SPI_cursor_fetch(portal, true, 8); if (0 == SPI_processed || NULL == SPI_tuptable) break; { TupleDesc tupdesc = SPI_tuptable->tupdesc; for (i = 0; i < SPI_processed; i++) { HeapTuple tuple = SPI_tuptable->vals[i]; // elog(INFO, "%s, %s", SPI_getvalue(tuple, tupdesc, 1), SPI_getvalue(tuple, tupdesc, 2)); cnt++; } } } SPI_cursor_close(portal); return cnt; } PG_FUNCTION_INFO_V1(zcurve_oids_by_extent_ii); Datum zcurve_oids_by_extent_ii(PG_FUNCTION_ARGS) { uint64 x0 = PG_GETARG_INT64(0); uint64 y0 = PG_GETARG_INT64(1); uint64 x1 = PG_GETARG_INT64(2); uint64 y1 = PG_GETARG_INT64(3); uint64 *ids = NULL; int cnt = 0; int sz = 0, ix, iy; interval_ctx_t ctx; x0 = MIN(x0, s_maxx); y0 = MIN(y0, s_maxy); x1 = MIN(x1, s_maxx); y1 = MIN(y1, s_maxy); if (x0 > x1) elog(ERROR, "xmin > xmax"); if (y0 > y1) elog(ERROR, "ymin > ymax"); sz = (x1 - x0 + 1) * (y1 - y0 + 1); ids = (uint64*)palloc(sz * sizeof(uint64)); if (NULL == ids) /* internal error */ elog(ERROR, "can't alloc %d bytes in zcurve_oids_by_extent_ii", sz); for (ix = x0; ix <= x1; ix++) for (iy = y0; iy <= y1; iy++) { ids[cnt++] = zcurve_fromXY(ix, iy); } qsort (ids, sz, sizeof(*ids), compare_uint64); ctx.top_val_ = ids[sz - 1]; ctx.cur_val_ = 0; ctx.cr_ = NULL; ctx.probe_cr_ = NULL; ctx.fl_ = NULL;//fopen("/tmp/ttt.sql", "w"); cnt = 0; prep_interval_request_ii(&ctx); { int cur_start = 0; int ix; for (ix = cur_start + 1; ix < sz; ix++) { if (0 == probe_interval_request_ii(&ctx, ids[cur_start])) break; for (; cur_start < sz && ids[cur_start] < ctx.cur_val_; cur_start++); // if (ctx.cur_val_ != ids[cur_start]) // { // cur_start++; // continue; // } ix = cur_start + 1; if (ix >= sz) break; for (; ix < sz && ids[ix] == ids[ix - 1] + 1; ix++); //elog(INFO, "%d %d %d", ix, cur_start, sz); cnt += run_interval_request_ii(&ctx, ids[cur_start], ids[ix - 1]); cur_start = ix; } } if (ctx.fl_) fclose(ctx.fl_); fin_interval_request(NULL); pfree(ids); PG_RETURN_INT64(cnt); } I post it here, and not posted on github The code is purely experimental and has no practical value.
PPS: Thank you so much to the guys from PostgresPro for leading me to this job.
PPPS: continued here and here
Source: https://habr.com/ru/post/319096/
All Articles