How to understand what is happening on the server

Alexander Krizhanovsky ( krizhanovsky , NatSys Lab. )
This picture has been running around the web for a long time, at least I’ve often seen it on Facebook, and I’ve got an idea to tell about it:

I typed in Google, it turned out that the person who created it is optimizing the performance of Linux, and it has a wonderful blog. There is not only a presentation where this picture is present, there are about three presentations, there is some other documentation. I urge to go to this blog, it tells well about all the utilities that are listed in this picture. I did not want to retell, so I give a link to the presentation - http://www.brendangregg.com/linuxperf.html .
')
On the other hand, he has a very compressed stream in the presentation, there is an hour presentation, about each of these utilities little by little - just what it does, in essence, is the same thing that you can find in man'e, or just typing the name of each of these utilities in google. I wanted to make a couple of examples on how to find a bottleneck and understand what is happening.
Gregg gives the methodology, starting with a look at how to find a bottleneck, five why questions, etc. I have never used any methodologies, just look, do something and want to show what can be done.
Unfortunately, when I was preparing the presentation, I didn’t have a stand with software installed, benchmarks, i.e. I could not repeat the whole script. I tried to collect some logs that I had, chats, plus reproduced some scripts on my laptop, on virtual machines, so if some digits seem suspicious, they are really suspicious, and let's look at them a little fingers. We will be more important idea about the order of numbers and how to see them, how to recognize them.
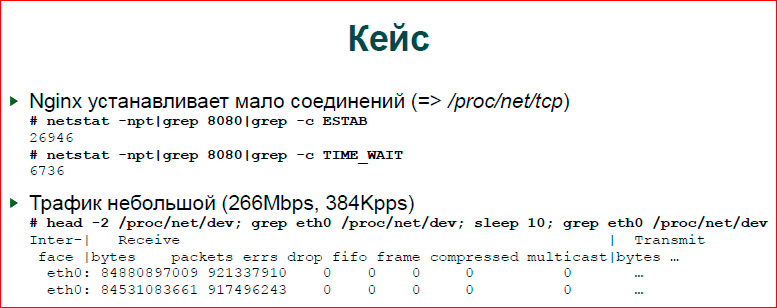
The first and main example is that we had a custom application, there was a nginx module, a very heavy module, but we will not consider the applied logic. There was a problem that people wanted so many connections, but many connections did not work, everything stopped there. The input traffic was about 250 MB per second, there are a lot of parallel connections on such a fairly modest traffic. Our resources were completely exhausted, and nothing happened, i.e. new connections, new requests were simply discarded.
We looked. The first thing we do is look in netstat, do grep, do another grep. In netstat'e more than 20 thousand connections, and we have these streams there. It is clear that when performance problems occur, the system feels very bad. And when we run netstat, it hangs for a very long time with grep, so if there is an opportunity, it’s better to work with proc, it actually is always there, and write an awk script that will not work with pipes, but immediately read one a string from proc, parses it and gives you the result, as it counts. It will be a little faster, more comfortable to work.
The second thing we do to understand what is happening is to simply count incoming packets. Here I did not use any complicated things, I just take packet counters, byte counters. Actually, as these figures are obtained - I do sleep for 10 seconds in order to level some fluctuations, and then I subtract one from the other and divide by 10.

Next, run Top normal. In Top, some kind of picture, in general, is nothing criminal in it, i.e. nginx is not 100% processor eats, the average is also basically normal. Suspiciously, the system time is 33% and the software time (si - software Interrupts) is 52%. Those. in fact, nginx does little what we do, but we have a lot of what the OS kernel does. We also see that we have two threads ksoftirqd - I reproduced it inside my virtual machine, and there were only two cores, i.e. The two handler network threads have climbed to the top.
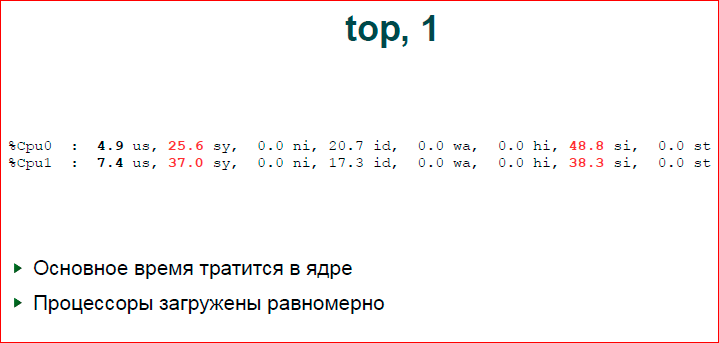
There is a useful button in the Top - you need to press "1". It will show you not the total statistics on the processors, but for each processor individually. Here we see a good picture, in general, the processors work evenly. If one processor gets out for 100%, and others lie, we have a problem with load distribution. If packets go mainly to one core, to one interrupt, the rest rest. Here we have a good distribution.

I love to use it. This is not good, it is a peasant method, but overall, GDB provides a very powerful interface. You can loop the script for GDB through all your nginx processes and see what is being done with them. Here we just look at the top of the stack - the first and second functions, but, in principle, you can do more interesting things, you can not only collect backtraces, you can print out some variables, etc. This is a powerful enough mechanism to look inside the server in real time, see what is happening with it, its state, but do not stop it much. This script, however, slows down, of course, that nginx gets worse, but, in general, it works, you can do it in real time.
If you run this script several times, then, in general, even just across several processes, several threads can see that some threads mostly spend time in one or two functions - this is just our bottle-neck. If you have just one thread or a process that interests you, just run a few times and be able to understand that this is such a simple sampling.
I have not yet said that in this case we see here just an epoll. Epoll is not very interesting, much more interesting if we saw the user space code. In the case from which we started, there was a user space code, there were regular expressions that we processed, there was a bottle-neck.
The next thing we do, because we see that the problem is not in nginx, but the problem is in the system, we are going to the system. See how the OS feels. Those. at the moment we have already cut off, divided the search zone and are already looking in the OS.
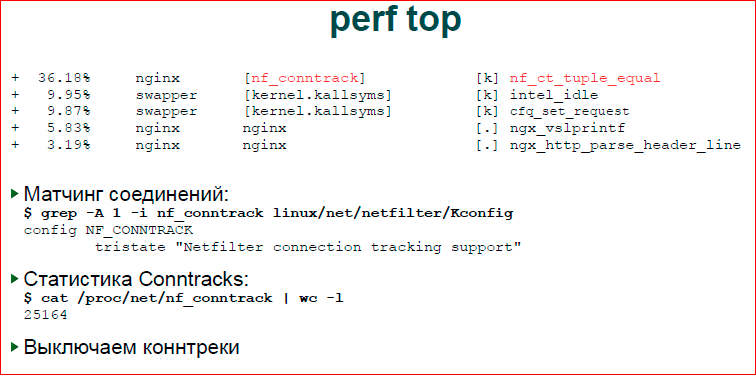
There is a handy perf top utility - this is a kernel tracer, it can show all your processes in the system, a specific processor, a specific process, its call_trace. Here, we see that most of our time is spent in nf_conntrack. In general, it is not very clear, i.e. you can see that the last two lines are nginx. We understand that there is some kind of application code, it is not interesting for us, because we know that nginx is no longer our bottle-neck. What we are looking for, we are looking inside the OS, and we are interested in the first three challenges.
The first. In order to find what nf_ct_tuple_equal is, it’s again convenient to have the kernel sources at hand. I'm not saying that everyone needs to understand inside it, but simply by making a grep inside the kernel - what I did - you can understand easily enough, or you can simply type in Google the call that you see in perf'e. It may be incomprehensible at first, but you can quickly find what these subsystems are. You do not need to know exactly what this system call does, this function of the kernel, just to understand what this subsystem is, in which subsystem the kernel is slowing down.
Just do grep. I made a general recursive grep inside directories, found Kconfig where it lies, and there is a human description - what you see in the kernel configuration, what this subsystem does. Then we go to Google, see what conntrack is and we see quite a lot of messages that conntrack and slow down the system, they do not make sense to the input traffic, in particular, for an htp server, we can disable them.
In order to make sure that everything came together, all of our data, we print out the number of connections that are being grazed by conntrack'i, and we see there is approximately the same number as the number of connections established. The Linux conentrack is a firewall subsystem that monitors our connections, i.e. A vivid example of FTP, when we have one connection, a port is given on it and the firewall must pass both the first and second connection, connect them. And this subsystem has a rather slow function, which starts to match all the connections, it just runs idle, it does nothing, so we can disable it.
With the first bottle-neck sorted out, let's look at the next.

Intel_idle. Honestly, the first time I thought it was from the Intel card. Again, do grep inside the kernel. Already Kconfig has nothing, because it's all always on, but Intel developers took care to make a good comment inside the source code, and we see that the time our processor wastes is wasted, it is wasting it inside this thread. This thread is good, it means that we have a processor idle for a while, and we are not doing anything with it.
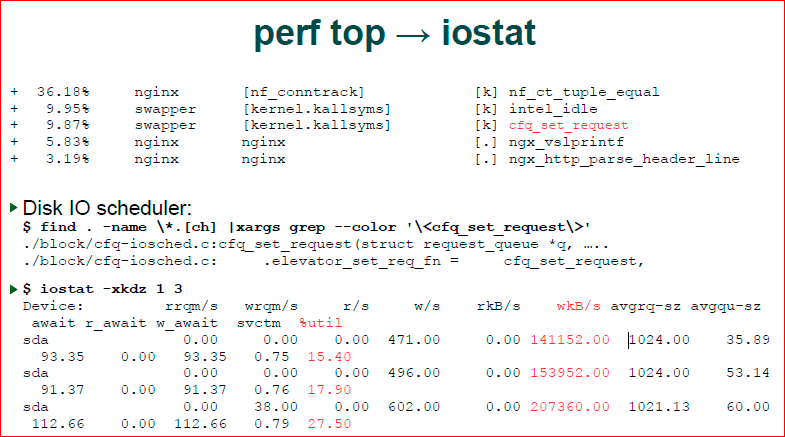
Next point. Again, we do grep, we see that we have a ./block/cfq-io scheduler, and we understand that we are dealing with an I / O scheduler. So, probably, nginx enters and outputs something. At the same time, block IO - this means that we have a file system, and not a network part, i.e. The network part is in the net.
If this happens, we want to see the I / O statistics, iostat helps us do this. We see that we have a massive recording, and that the disk is used there by 15-20%. Not very much, but time is wasted there.
Further, when we looked at perf top, we actually saw what the OS is doing in the input-output. This does not mean that nginx does this, it may be that kswapd is outputting something, it may be some kind of daemon. The roseb got up on cron, which runs some kind of database update, maybe we have a package manager there updated, etc. In a good way, when we see that we have a load on the I / O in the system, it would still be good for us to see who is doing this.
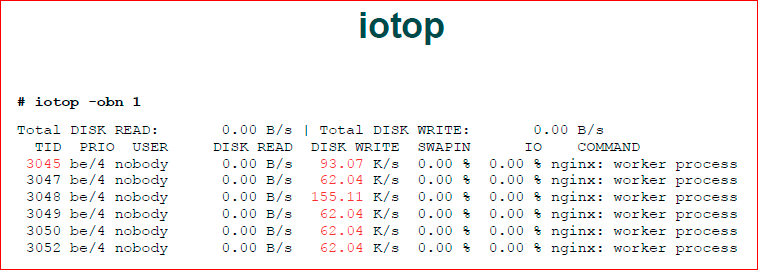
And we have an iotop - an analogue of the usual top, but for I / O. It just shows us who generates us such input-output. We see that nginx.
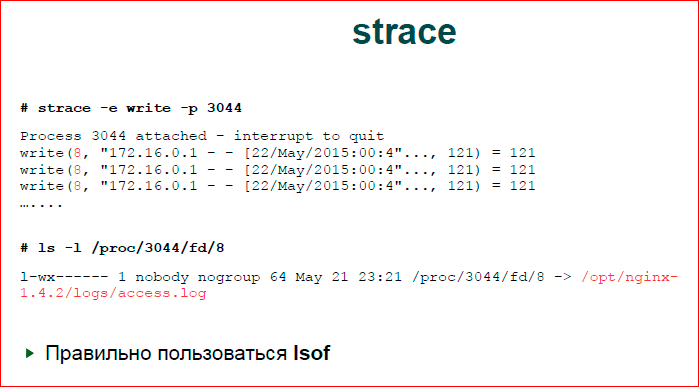
The next thing we do is see what nginx does with I / O. There is an application utility strace, which is located at the junction between the OS and the application process. It displays hooks on all system calls. I guessed that we would have write and set write. I didn’t do anything on purpose, it just happened. In fact, we do not have many system calls, i.e. it was right here - “-e write, write w” and, probably, everything. Those. if we know that the file I / O slows down, then we will be interested in a fairly small number of system calls.
The second option. Here I was lucky, I have a clean conclusion. I really had a lot of such write there. In reality, you can have a very bad situation when you see just a jumble of system calls, there will be an epoll, there will definitely be some kind of read from the socket, there will be a write sometimes, and, in general, it is hard to understand what it is.
You can also run strace. We put strace into a file, then we process this file with a script that builds statistics on system calls. We understand what system call we have in Top, and, accordingly, in Top System calls, we are looking for a system call for records, and this will be write. By write, we see that the first argument to write is file descriptor 8.
Using lsof correctly, but I never learned how to use it, I use docfs. I go to the fd directory, look what is in the 8th descriptor. This access.log is not surprising.

The last scenario is what to do if Top is silent, if it shows us good numbers, that we, in general, are fine in the system, but we know that we are not good.
Such an example. I just took my benchmark - this is a benchmark that loads the synchronization queue in the mutexes, and I looked at what Top says. Top says that we have a very large idle, and if we do not display per-CPU statistics, then we will have about 130% of processor utilization, while we should have 400. That is, we see that statistics is all good, but according to its ideology, the benchmark should completely utilize all the resources, it does not do that.
Let's see what happens.

Here we make strace again, but we already call with -p and –c; -c allows us to collect statistics on system calls.
Why we did not do this for nginx, why did I say that you need to take some kind of script and pars the output from strace? The fact is that strace generates these statistics at the end of the program that it feeds, which it tracks, and if nginx works for you, and you do not want to interrupt it, then you will not get these statistics, you need to collect the statistics yourself.
Here, strace shows us the route, which system calls are more often called by us, the time is inside these system calls, and we see that we have futex. If we type man futex, we will see that this is the OC mechanism that is used to synchronize the user space, and these are our myutaks. And pathRead lock'i, condition variables use just one this futex call - this means that we have a problem with pathRead synchronization.
Generally speaking, if you see such a picture that you have good I / O, the processors are good, you are generally good, and the memory is good, but you don’t reach the number of RPSs, which usually means lock contention, that, just, this figure is 130% - it is not accidental. Those. during lock contention, when you have four processors fighting in one lock, you only have one processor at a time to do something. That is, in fact, you get one of the four processors. And we get an additional 30% only due to additional expenses for the scheduler and something else that gives us a little more than 100%, but this is the nature of contention.
Contacts
» Ak@natsys-lab.com
»Alexander on Habré: krizhanovsky
» NatSys Lab blog.
This report is a transcript of one of the best speeches at the training conference for developers of high-load systems HighLoad ++ Junior .
Also, some of these materials are used by us in an online training course on the development of high-load systems HighLoad.Guide is a chain of specially selected letters, articles, materials, videos. Already, in our textbook more than 30 unique materials. Get connected!
Well, the main news is that we have begun preparations for the spring festival " Russian Internet Technologies ", which includes eight conferences, including HighLoad ++ Junior . Alexandra will definitely call the speakers again
Source: https://habr.com/ru/post/319020/
All Articles