Query performance in PostgreSQL - step by step
Ilya Kosmodemyansky ( hydrobiont )
For a start, just a few words about what is going to be discussed. First, what is query optimization? People seldom formulate and it happens that they often underestimate the understanding of what they do. You can try to speed up a particular query, but this will not necessarily be optimization. We will poreorize on this topic a little, then we will talk about from which end to approach this question, when to start optimizing, how to do it, and how to understand that some query or set of queries cannot be optimized in any way - such cases also happen, and then you just need to redo it. Oddly enough, I almost will not give examples of how to optimize queries, because even 100 examples will not bring us closer to the solution.
Usually the bottleneck is the lack of understanding of which side to approach this case. Everyone says: “Read EXPLAIN, check queries with EXPLAIN,” but I often get questions about what to look at and what to do after they have already looked at EXPLAIN? Here I will try to tell about it in more detail.
As an epigraph to the report, I would like to quote from Academician Krylov, who once built ships, this quotation for more than 100 years, but nothing has changed.
')

The main problem with databases (DB) is that: either something unnecessary is in the database, or something unnecessary does not lie, or there is some wrong approach to its operation. In principle, we can supply some kind of super-duper RAID controller with a huge cache, super-expensive SSD drives, but if we don’t turn our heads on, the result will be disastrous.
What does “optimize queries” mean? As a rule, you do not have such a problem. The problem usually lies in the fact that “everything is bad!”. We are writing our wonderful project, everything works, everyone is happy, but at some point we ordered a little more advertising, a little more users arrived, and everything fell. Because when they develop a project quickly, they usually use “rails”, “django”, etc. and write "in the forehead" - it is important to quickly give the product. This is actually correct, because nobody needs a perfectly “licked” project that does not work. Next you need to understand what is happening. These slow queries, which we want to optimize, are simply such an interface that gives out, which is slow, but the reason could easily be something else. There may be a bad hardware, there may be an unconfigured base, and at this point it’s not worth starting with query optimization. First you need to see what happens with the database.
There are simply blunders in setting up the database, and before they are fixed, it is useless to optimize queries, because the bottleneck is in a different place. For example, if you are talking about Postgres, you may have the autovacuum disabled. For some reason, people sometimes do this (in no case can this be done!), But when it is disabled, you have a very large table fragmentation. It can easily be a table for 100 thousand records the size of a table of 1 billion records. Naturally, any requests to it will be slower than you expect. Therefore, you first need to configure the database, check that everything works well.
Another common mistake is when 1000 Postgres workers work, because there are so many connections from the application, and there is no Connection Broker. It should be understood that if you have 500 connections, then you must have 500 cores on the server on which you are working. Otherwise, these connections will interfere with each other and spend all the time waiting. When you have fixed these stupidities (there may be quite a lot of them, but there are 5-10 basic ones - the correct settings for memory, disk, autovacuum ...), you can proceed to query optimization. And only then. Do not try to optimize what else you just do.
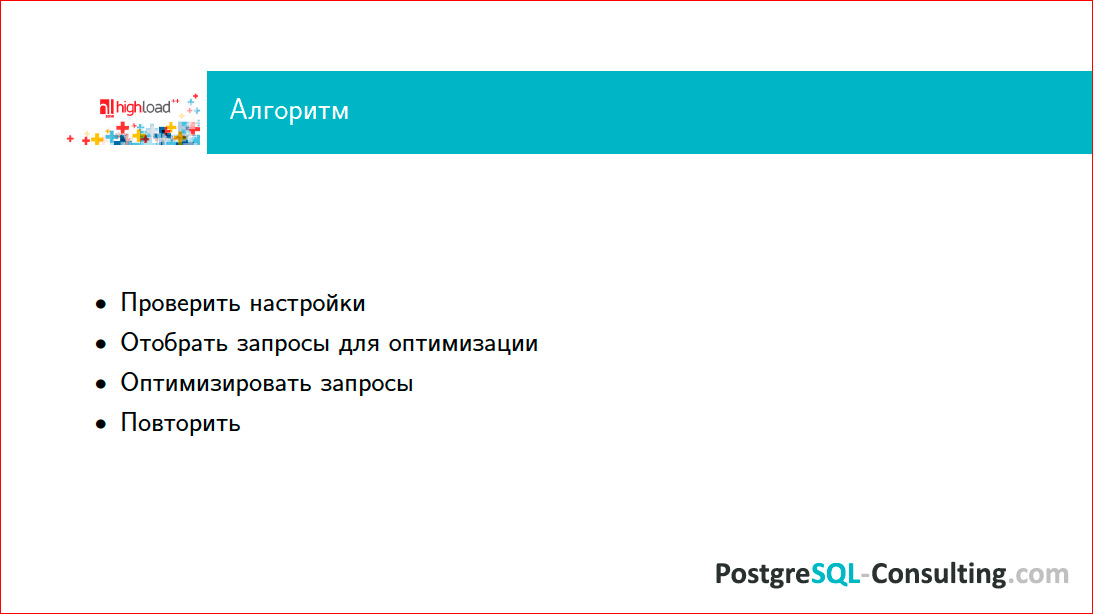
What is the algorithm, i.e. How to approach query optimization? First, you need to check the settings, secondly, in some way to select those queries that you will optimize (this is an important point!), And, in fact, optimize them. After you “cured” the slowest queries, they became faster, you immediately have new slow queries, because the old top gave way to them. As a result, you gradually, step by step, repeating this algorithm, get rid of slow queries. It's simple.
A very important point is to know which queries to optimize? If you optimize everything, then there is a chance not to guess which of the queries are the most problematic. You just spend a lot of time and most likely you will not get to the desired tasks. Therefore, requests should be optimized as problems arise. Look where it stopped working, it became slow and bad - this piece is optimized. If you have something that is rarely used, do not touch it, do not waste time.
Requests are taken from the selected top and it looks like what can be done with them. For this, especially in version 9.4, the right way is to use EXTENSION pg_stat_statements, which does all this “on the fly” online, and you can look at it all.
Let's deal with this in detail.
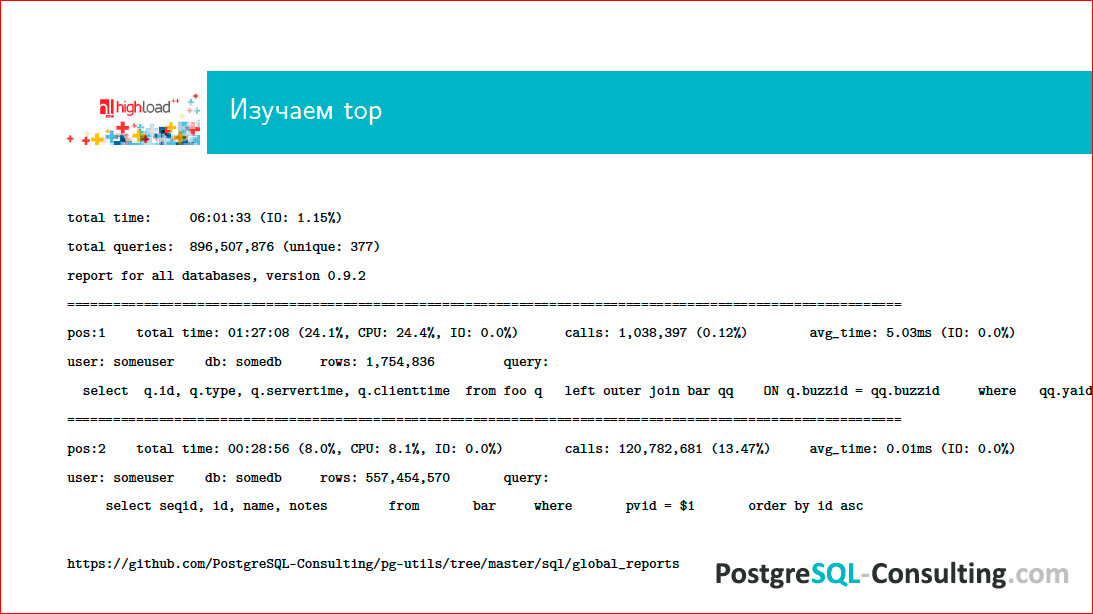
At the address at the bottom of the page, our pg-utils, which are freely available, can be downloaded and used. In the folder there is a kind of binding around the standard contribution pg_stat_statements, which allows you to generate such reports for the day of work on the database, and we can see what happened there. We see, respectively, a certain top queries, somehow ranked.
It is important for us to know that there is a first position, a second one (usually a dozen more), and we see that for some parameters we have a certain request that comes out on top - it takes, for example, 24% of the base load. This is quite a lot and it needs to be somehow optimized. You look at the request and think: "And how much money does he bring to the project?". If he brings a lot of money to the project, then even half of the load eats away, and if he does not bring money, but eats up half of the resources, this is bad, something needs to be done with it. So you look at the top queries for the previous day and ponder what to do with it.
We consider it a good practice when there is a development team that does something on a project, and once a day on cron, such a report comes to all DBAs, all developers, all admins.
What is a slow query? Firstly, this is the query that is in the top (it must be optimized in some way in any case). But purely in time - it is always a question. Even a request that will work a fraction of a millisecond can still be slow. For example, if there are a lot of these requests, and many small requests as a result eat up a very large percentage of the base resources.
Thus, the query time is a relative thing, and here you need to look at how often this query works. If this is the return of something on the Main page, and this request takes 1 second, you need to understand that you will have this second and another overhead from all that is needed to form this page. This means that the user will see the result is guaranteed slower than a second, and for an online high-load web these are unacceptable results. If the request for you at some analytics is chasing at night, an asynchronous report is sent to someone, then he can probably afford to work slowly. That is, you always need to know your data and always think how long it is permissible for this query to work. Again, the nature of the load on the base is important. For example, you have a long heavy query, you chase it at peak times, and this is a query for some analytics, for managers, etc.
Look at the base load profile. You have pg_stat_statements, on it you can see top slow queries, for example, from 2 to 4 o'clock in the afternoon, and at this time do not drive long analytical queries.
Do not forget about how much this question makes money and whether it has the right to consume a lot of database resources. If you made a cool feature that doesn’t earn anything for a project, and this request eats up 50% of the resources, then you have written a bad request and you need to redo this idea and sometimes even explain to the manager why this technically very difficult thing just eats up resources. Everyone says, they say, I want Golden Fish to be on my packages, nevertheless, the server is iron, it has some limits, and you cannot stretch it rubber. People who make clouds will tell you what you can, but I, as a bore admin, will say that it is impossible.
Where, in general, can there be problems in executing one particular request? First, it can be data transfer from the client, and it is not at all as funny as it seems. The following slide shows where a dog can be “buried”:
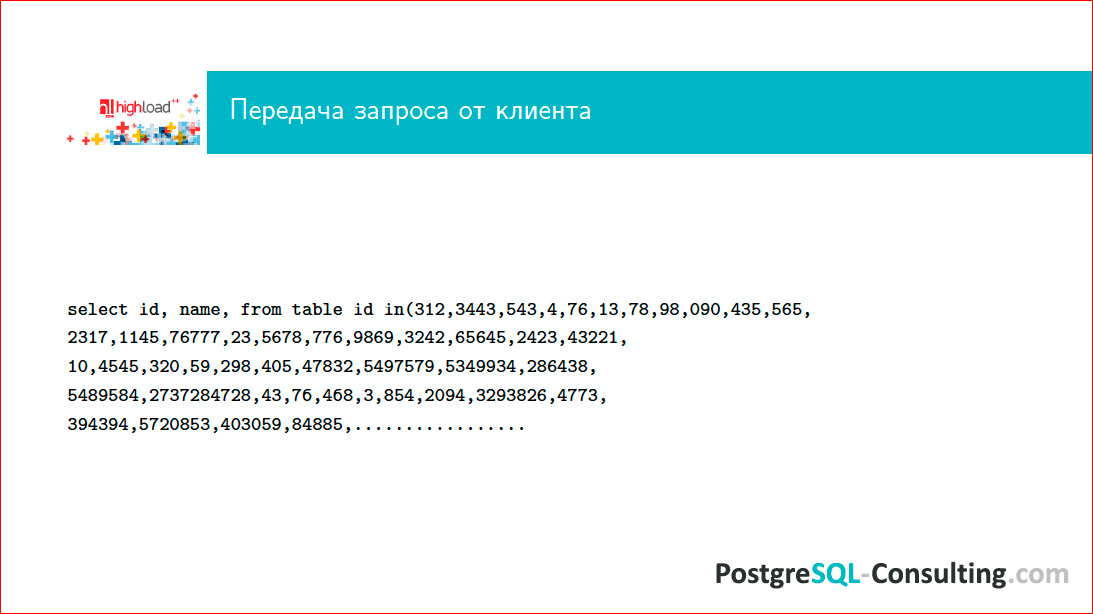
Whoever wrote on Ruby, used all sorts of ORMs, he knows that Django can be recognized by this request. This is a corporate style, the handwriting of a radio operator cannot be confused with anything.
What do you think, what is the maximum in-list I have seen in my life? Must be counted in gigabytes! If you do not look at what your ORM does, you can easily get a few gigabytes, and this query will never be fulfilled. This is bad and means that you have completely non-optimal access to data. This query is bad for many other reasons, but the main reason for the fact that it can be of such length that in Postgres will never get through.
The second point is parsing. You can write a very ornate request that will just be parsed for a long time. In the new version of Postgres, if I'm not mistaken, there will be parsing time in EXPLAIN, and it will be possible to understand how long it takes. Now you can just make EXPLAIN and see by timing, respectively, how much we spent on the execution of the request, and how many - on the parsing.
Then the query needs to be optimized. And this is far from a simple task, as it seems, because the optimizer is rather complex algorithms. Here, for example, you want to make Join two tables. He takes one table, selects the method of accessing the necessary data and joins the next one to it. If you have one more Join with another table, then first it has two Join-s, then another one with ResultSet s-Join. If you wrote a request in which 512 Join'ov, then a very interesting "parsley" begins with the optimization of all this.
To sort out which Join'ov path will be optimal, it will be necessary depending on the number of Join'ov n! variants of the plan, among which the selection will be conducted. Therefore, if you have a lot of Join, then you immediately realize that the optimization process itself can be very, very long.
Further can be directly execution. If your request must return somewhere 10 GB of data, it is difficult to expect that it will work milliseconds. No magic to make him. Therefore, if you need to give a lot of data, then immediately keep in mind that there is no magic. It happens in the world of NoSQL, and here it is not.
Well, return the results. Again, if you drive several gigabytes of data over the network, then be prepared for the fact that this will be slow, because the network has some limitations on how much you can skip through it. In such cases, it makes sense to sometimes think about whether we need all these results? This is a very common problem.
The most important slide of this presentation:

This is EXPLAIN.
After you have selected the top queries, you somehow made sure that these queries are slow, and you want to do something with them, you need to get rid of EXPLAIN.
Many reach this stage, and then the snag. People complain: “Well, we watched EXPLAIN, and what to do with it further?”. Here I will tell you now.
On slide 2 EXPLAIN, a slightly different syntax.
You can do this: explain (analyze on, buffers on), you can just write explain analyze, for example.
It is important to understand that EXPLAIN will give you just a plan for the intended, what it should be. Accordingly, if you specify also ANALYZE, then this request will be actually executed, and the data on how it was executed will be shown, i.e. not just EXPLAIN, but some kind of trace, in fact, what was happening.
When you have selected the top slow queries, use EXPLAIN ANALYZE correctly, because you may have a non-optimal plan selected, statistics may not be collected, etc.
Postgres is a super transactional thing, if you have a writing request, you do not want these results to be recorded, while you are optimizing something, say: “begin”, run the request (but it is advisable to watch what happens in general - a heavy request at peak times, the combat base is not always good), then say “rallback” so that you will not get this data.
Here are shown some figures, some of which belong to EXPLAIN, and some - ANALYZE. These are important numbers. In EXPLAIN'e there are conditional "parrots" called "cost". 1 cost in Postgres by default is the time it takes to retrieve one block of 8 KB in size with sequential sequential scan. In principle, this value depends on the machine, so it is conditional, therefore it is convenient. If you have fast drives, it will be faster; if slow drives, slower. It is important to understand that cost = 9.54 - this means that it will be 9.54 times slower than getting 1 block of 8 KB in size.
In this case, two numbers: the first means how much time will pass before the beginning of the return of the first results, and the second - how much time will pass before the result is returned all. If you extract a lot of data, the first digit will be relatively small, and the second one will be big enough. This is the actual time, how much it actually took. If for some reason you have a very low cost, and this time is very long, then you have some problems with collecting statistics, you need to check if autovacuum is turned on, because the same autovacuum daemon also collects statistics for optimizer.
EXPLAIN is such a tree, there are lower options, roughly speaking, how to get data from a disk is a scan of plates, scan of indexes, etc .; and higher options, when some aggregation, Join'y, etc. When you look at such EXPLAIN, the task is very simple:
- understand how fast it works, look at the runtime, see how much what happened there;
- see which knot of this tree is the most expensive. If you have a cost large at the lower stage, the actual time is large, it means that you need to optimize this piece. For example, if your entire table is scanned, you may need to create indexes there. This is the place that really needs to be optimized, to look at.
If you, for example, have an aggregation that is strange, as in our case on the slide — it is more difficult there, then you need to think about how to get rid of it.
So you look at EXPLAIN and find the most expensive places. After you look at EXPLAIN for half a year, you will learn to see these places with the naked eye and you will already have in your head a set of recipes for what to do in which case. We will not consider them in detail yet.
What techniques can be used? You can make an index. The idea behind the index is that it is a smaller dataset that is convenient to scan instead of scanning a large table. Therefore, all programmers love indices, they like to create indices for all occasions and assume that this will help. This is wrong because the index is not free. The index takes up space, with each entry in the table the index is rebuilt, balanced, and this is all not for free.
If you have the entire table hung with indexes that are not used, you are likely to demolish some of them, and it will be faster. However, if in your query you need, for example, to extract half of the data from a table, your index will most likely not be used, because it makes sense for the index to be positioned in a sufficiently precise place and get this data. If you need a large “sheet” that is comparable in size to the table, the sequential scan of the table itself will always be faster than the index scan, because you will need to first do an index scan, then another operation — get the data.
In most cases, the optimizer in such things is not wrong. If you create an index and wonder why it is not used, it may be because without an index it will simply be faster.
In Postgres, there is such a parameter - a session variable, enable index scan set to off or, on the contrary, sequential scan set to off, and you can see - with or without an index it will be faster / slower. I would not advise optimizing requests “in battle” in this way, this is a very tough “crutch” and a very serious restriction of functionality for the optimizer, but experimenting and seeing is useful. You made a request, made an index for it, consider that it will work, turn off the sequential scan, the optimizer will have to choose a plan with an index, and see if it didn’t work out more slowly than what Postgres suggested to you. In most cases this is the case.
Further, it is important how the request is written. If we have something like this - (where counter + 1 = 46) - the index will not be taken, Postgres cannot automatically do this operation. It would seem that a simple addition, but with the same success it is possible to offer the optimizer also to solve the diffs. In Postgres, a large number of data types can be used to define any operators, any actions, for example, algebraic or other, and the optimizer should know how to perform this action for all these types, but this is too hard for him, it is never will not work.
The following is why, for example, does Join work badly? This is one of the important nodes, everyone uses it.
Join'y come in different types, and I'm not talking about LEFT, RIGHT, INNER, etc., but about algorithms, how Join'y performed. Postgres has three main Join'a algorithms, namely Nested Loop (the name speaks for itself - we take data from one table and Join'im cycles), Hash index (when one, usually small, the table is hashed and on this hash Join with another table) and Merge Join (which is also obvious how it works).
These Join's are not always equally useful, the optimizer can choose between them. For example, you Join two tables, the optimizer chooses Hash Join, and you understand that it works slowly, it does not suit you. It makes sense to look, and if you have indexed the fields by which you join'ite?If you do not have these fields indexed, the optimizer may not choose Nested Loop, which is obviously more profitable here. If you create an index, the optimizer will select Nested Loop, and everything will work quickly.
The next thing is that your optimizer chooses Nested Loop from some considerations, but it seems to you that one table is very small, another table is very large, and Hash Join would be very appropriate there, because a small table can be quickly hooked up and quickly worked with it . See how much work mem you have. those.how much memory a Postgres worker can take. If this table is hashed to, for example, 100 MB, and you have only 30 MB of work mem issued, then the worker will work slowly. If you add work mem and hashing starts to fit into memory, the optimizer will select the correct Hash Join and it will be fast and good.
Here is a field for experimentation, you have to think and feel free to check, try and see what happens.
Since you need to optimize requests only “in combat” (because on the test you will never play the workload as accurately), then this should be done with certain caution.
An example of this optimization:
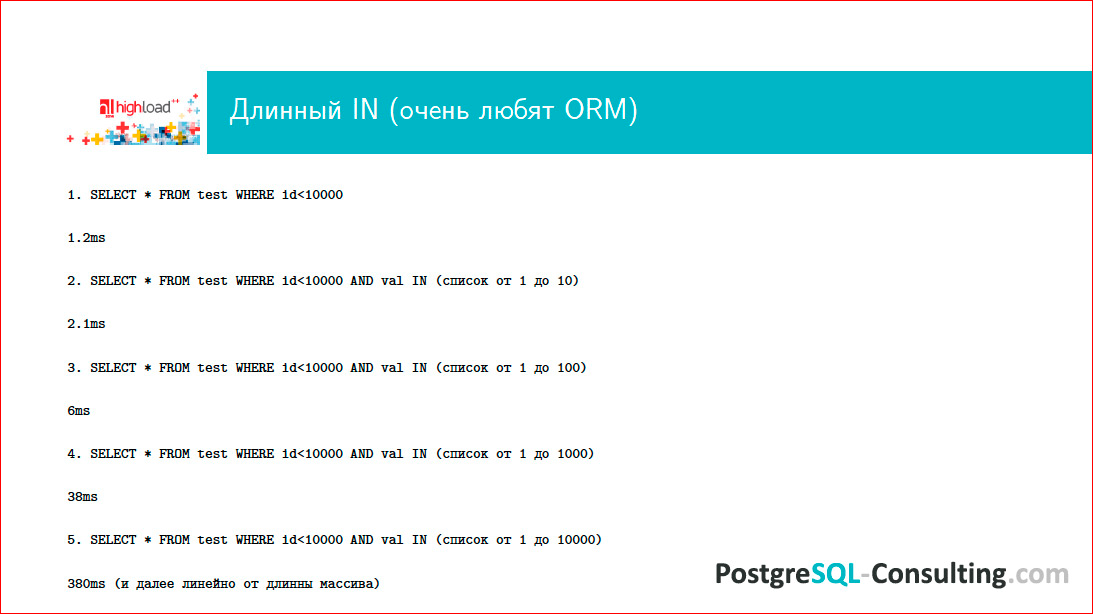
I already showed this request and very much swore on it. One of the reasons for this abuse is that, after all, Postgres is not perfect, it is a developing system, there are some flaws in it (the community really needs optimizer developers, if you want to subscribe to Postgres, then you can side to see, such efforts will always be very welcome, because there are deficiencies). So the case of such a long array in WHERE is very common, because many ORMs do this. In theory, Postgres should somehow hash the array and search accordingly in it. Instead, he goes through it and turns out quite nasty, time grows very significantly, and problems begin.
Take a look at EXPLAIN of this case:
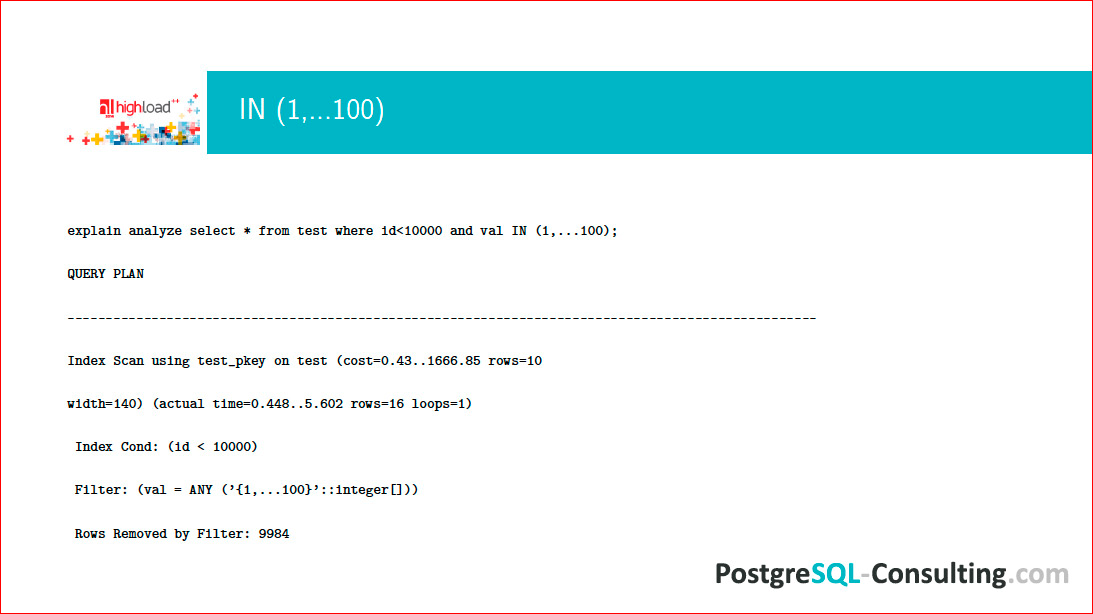
We see that the filter without the hash works poorly, despite the fact that there is an Index Scan in order to do something and select it on the array, we sit, and it works as badly as possible and everything slows down.
In this situation, the request must be rewritten, turning on the imagination. I have already said that Postgres is able to Hash Join, but does not know how to hash an array. Let's convert this “sheet” so that the result can be c-Join'it. The result is the same, only the optimizer will choose a more reasonable plan.
You can use a VALUES construct that turns us all into a ResultSet:
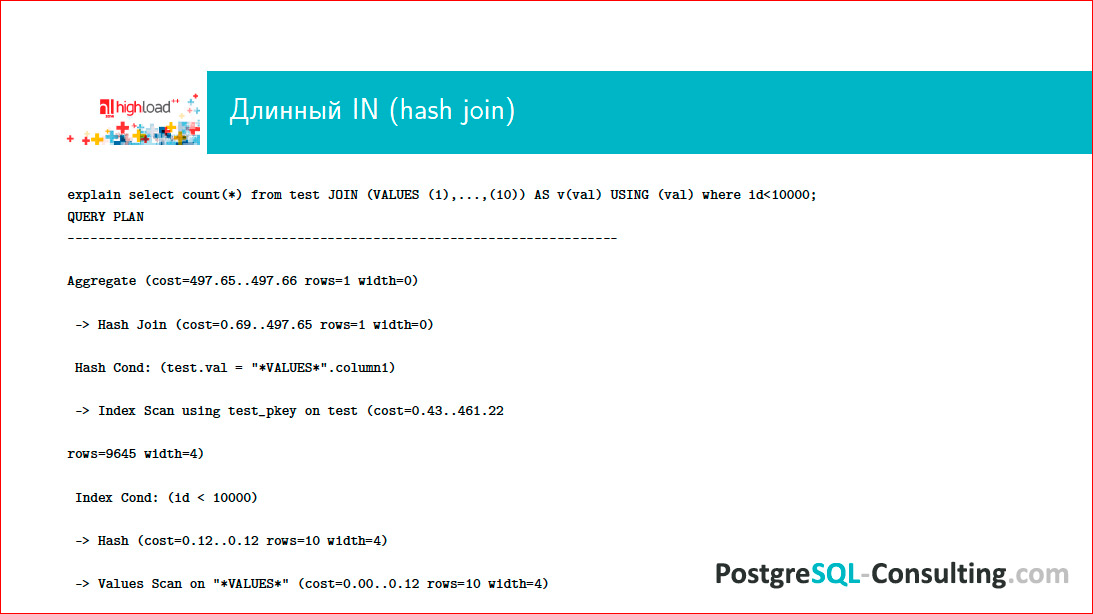
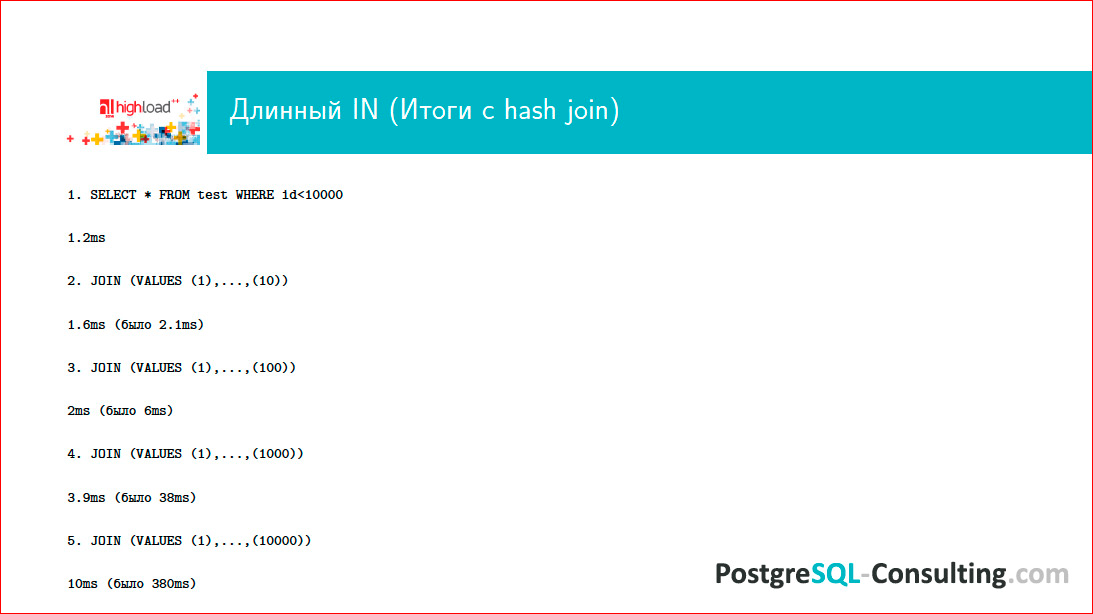
In this situation, there will actually be Index Scan and Hash Join. Hashing will be performed, and the request will be quite significantly accelerated.
, , , , , :
.
, , EXPLAIN, . , , .
– , . –count(*).
For example, there is an Internet site, it has a Home page, it is highly loaded, it displays counters. What information does the user have on the counter if the count is from a table that is frequently updated? The number means that at the time when the user sent his request, the figure was this. Usually it is not important for the user to know this figure with high accuracy, rather more or less approximately, and more often, in general, there is enough knowledge about whether the number is growing or not. If this is some kind of financial balance, then you can do it, but usually it is done very rarely and is not displayed on the main page of the site, so that with each conversion count runs around the table.
count - it is always slow, because Postgres, to count the number of records in a table, always scans it all and checks whether this version of the data is relevant or has already been updated.
The first solution to this problem is not to use count. Its usefulness is questionable, and it takes a lot of resources. The second point - you can use the approximate count. There is a PG-catalog, from it you can select -it how many rows in the table were at the time of the last analyze'a when the last statistics collection was made. This approximate figure will change quite often, but at the same time the request for the PG-catalog does not cost almost anything - it is a select of one value by the condition of the table name. If you do not want to let the Internet user of the database in the PG-catalog, nothing prevents you from writing the stored procedure, telling her “security definer” and giving rights only to this procedure, and the Internet user will easily retrieve this data without any problems with security .
The next query problem is Join on 300 tables. The problem is that there will be 300! options for how to join this. Moreover, if you needed to write Join on 300 tables, it means that you have very bad design of the scheme, something is not very thought out, and you need to redo a lot of things. Normally Join is two, three tables. Sometimes for five, occasionally for ten, but these are extreme cases. When Join'ov hundreds, any database will be bad.
Another problem is when 1,000,000 rows are returned to the client. Who flipped to the last page on Google? Often it happens? If you see that an online request, the result of which is displayed on the site, for some reason returns 1 million lines, think about whether there is any error? It may take 10, 20 lines, maybe 100, but a person does not read 1 million lines. If you have so many rows returned, it means that you either have some kind of data upload, which can be done at night, you can do it with a dump, you can do it in some other way, or your request is just incorrectly written.
For example, you generated ORM for a query for some kind of list, then, respectively, pull out this huge array, and use only 10% of it. In this situation, you need to use limit and offset and in some other way use this data in a specific window and not drag them all to the client, because 1 million lines is always slow, and, as a rule, it is not meaningful and contains some kind of logical error.
Contacts
hydrobiont
This report is a transcript of one of the best speeches at the conference of developers of high-loaded systems HighLoad ++ .
Also, some of these materials are used by us in an online training course on the development of high-load systems HighLoad.Guide is a chain of specially selected letters, articles, materials, videos. Already, in our textbook more than 30 unique materials. Get connected!
Well, the main news is that we have begun preparations for the spring festival " Russian Internet Technologies ", which includes eight conferences, including HighLoad ++ Junior .
Source: https://habr.com/ru/post/319018/
All Articles