Finding GDI Object Leaks: How to Drive a Mastodon
Strictly speaking, this is the original text of the article, and the blog is already a translation. Here the article is published a little later and only because it receives a translation tag.
In 2016, when most programs are executed in sandboxes, of which even the most incompetent developer cannot harm the system, it is strange to face a problem that will be discussed further. To be honest, I hoped that she had gone into the distant past with Win32Api, but recently I ran into it. Before that, I had only heard the creepy tales ofolder, more experienced developers, what this could be.
Leak or use too many GDI objects.
')
On Windows family systems, no more than 65535 GDI objects can be created simultaneously. The number, in fact, is unbelievably large and should not come close to under any normal scenario. The process is set to a limit of 10,000, which although you can change (in the registry, change the value of HKEY_LOCAL_MACHINE \ SOFTWARE \ Microsoft \ Windows NT \ CurrentVersion \ Windows \ GDIProcessHandleQuota from 256 to 65535), but Microsoft strongly does not recommend increasing this limit. If this is done, then one process will have the opportunity to put the system so that it cannot even draw an error message. In this case, the system can only come to life after a reboot.
If you live in a tidy CLR-controlled world, then the probability of 9 out of 10 is that you have a memory leak in your application. The problem, though unpleasant, is rather ordinary, and there are at least a dozen excellent tools for finding it. I will not dwell on this in detail. You will only need to use any profiler to see if the number of wrapper objects over GDI resources is increasing: Brush, Bitmap, Pen, Region, Graphics. If this is true, then you are lucky, you can close the tab with the article.
If there is no leakage of wrapper objects, it means that you have direct use of GDI functions in the code and a scenario in which they are not deleted.
The official Microsoft manual or other articles on this subject that you find on the Internet will advise something like the following:
Find all Create % SOME_GDI_OBJECT% and find out if there is a corresponding DeleteObject (or ReleaseDC for HDC objects), and if there is, then perhaps there is a script in which it will not be called.
There is a slightly improved version of this method, it contains an additional first step:
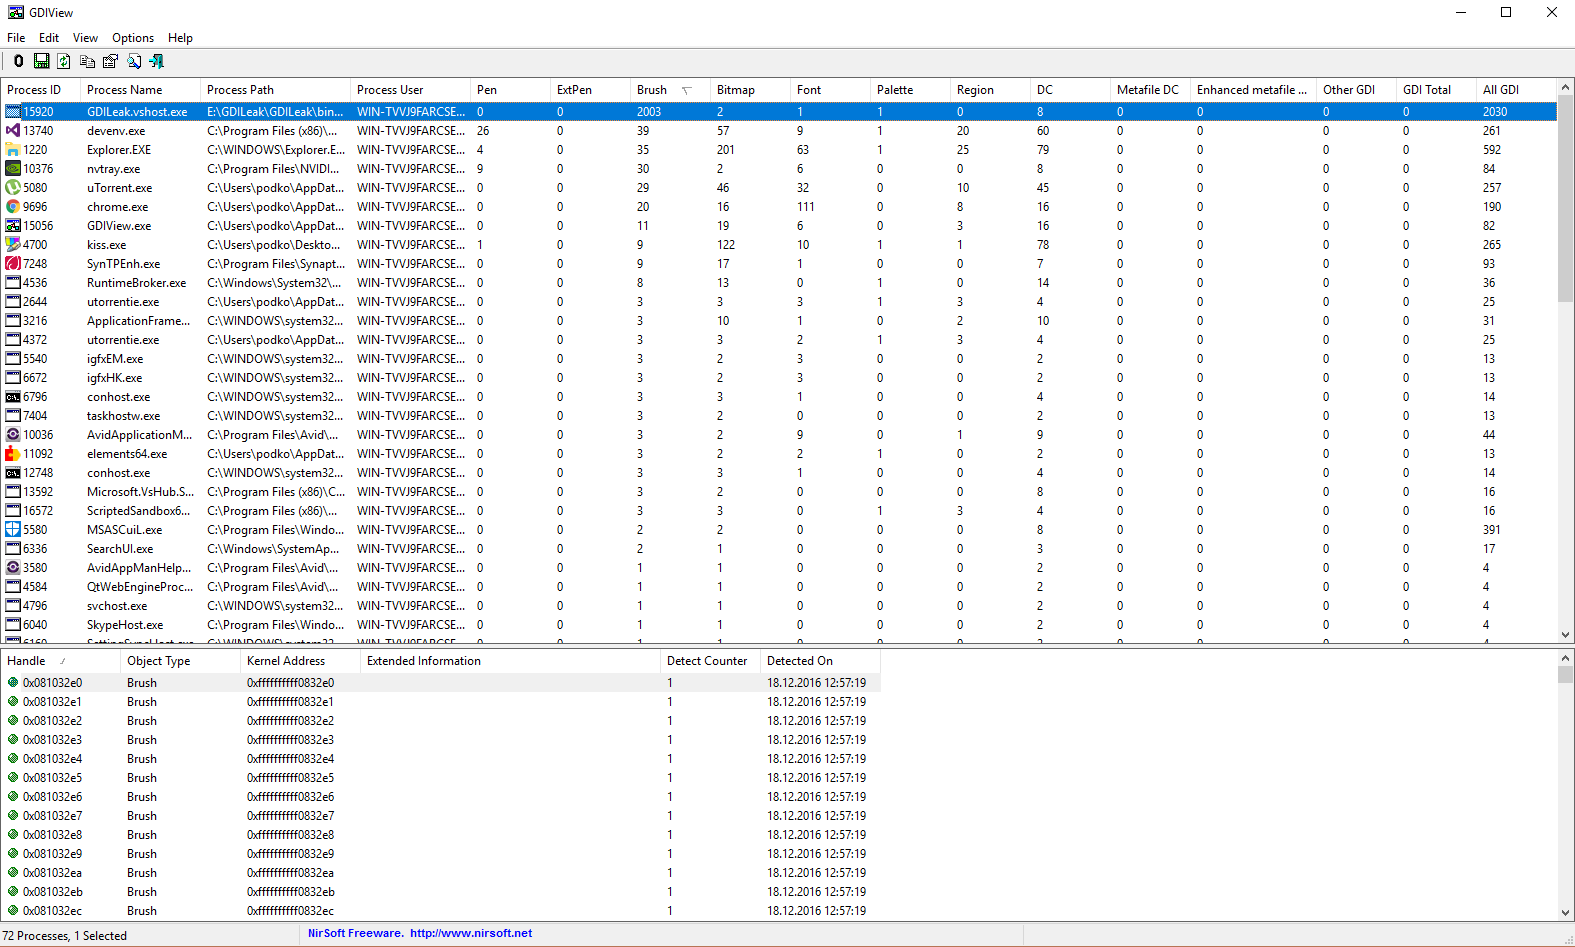
Download the utility GDIView . It can show a specific number of GDI objects by type and the only thing that is alarming is that the sum of all does not correspond to the value in the last column. You can try not to pay attention to this, if it helps to narrow down the search zone in any way.
The project I am working on has a code base of more than 9 million lines and about the same in third-party libraries, hundreds of GDI function calls spread across dozens of files. I spent a lot of energy and coffee before I realized that it’s simply impossible to analyze it manually without missing anything.
If this method seems to you too long and requires extra gestures, it means that you have not gone through all the stages of despair with the previous one. You can try the previous steps a few more times, but if it does not help, then do not discount this option.
Looking for a leak, I wondered: “Where are the objects that flow away?” It was absolutely impossible to put breakpoints in all places where API functions are called. In addition, there was no complete certainty that this does not happen in the .net framework or one of the third-party libraries that we use. A few minutes of googling led me to the Api Monitor utility, which allowed me to log and debug calls to any system functions. I easily found a list of all the functions generating GDI objects, honestly found them and selected them in the Api Monitor, after which I set breakpoints.
Then I started the process for debugging in Visual Studio , and here I chose it in the process tree. The first breakpoint worked instantly:
There were too many challenges. I quickly realized that I would drown in this stream and need to come up with something else. I removed the breakpoints from the functions and decided to see the log. These were thousands and thousands of challenges. It became obvious that they could not be analyzed manually.
Task: Find those calls to GDI functions that do not correspond to deletion. The log contains everything you need: a list of function calls in chronological order, their return values and parameters. It turns out that I need to take the return value of the function Create% SOME_GDI_OBJECT% and find the call to DeleteObject with this value as an argument. I selected all the entries in the Api Monitor, pasted it into a text file and received something like a CSV with a TAB separator. I started VS, where I thought to write a program to parse it, but before it was loaded, I had a better idea: export the data to the database and write a query in order to get what interests me. It was the right choice, because it allowed me to quickly ask questions and get answers to them.
There are many tools to import data from CSV into the database, so I will not stop at this ( mysql , mssql , sqlite ).
I got this table:
Wrote the mysql function to get the handle of the object to be deleted from the call to api:
Finally, a query that finds all current objects:
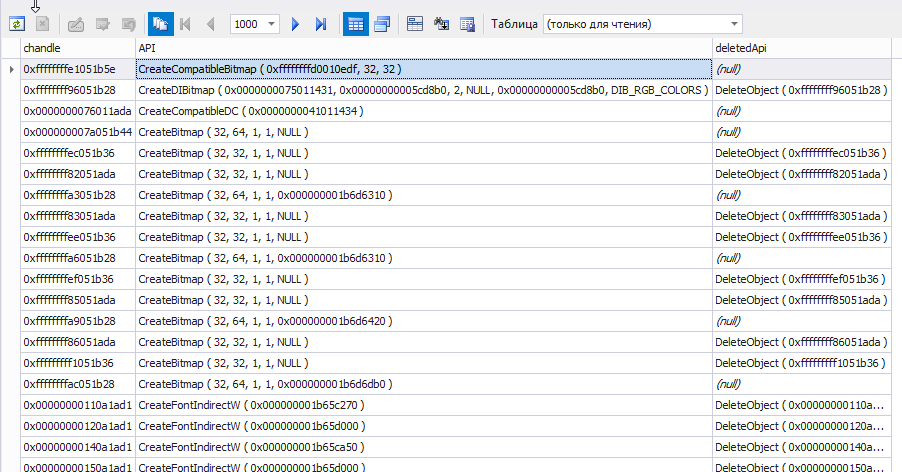
The figure immediately shows calls for which there was not a single Delete.
The last question remains: How to find where these methods are called from in the context of my code? And here one tricky trick helped me:
(The code is written solely for example)
The algorithm is long and complex, many tools are involved in it, but it gave me a result much faster than a dumb search for errors on a huge code base.
Here it is, for those who were too lazy to read, or who had already forgotten how it all began, while reading:
I really hope that this article will save someone a lot of time and will be useful.
In 2016, when most programs are executed in sandboxes, of which even the most incompetent developer cannot harm the system, it is strange to face a problem that will be discussed further. To be honest, I hoped that she had gone into the distant past with Win32Api, but recently I ran into it. Before that, I had only heard the creepy tales of
Problem
Leak or use too many GDI objects.
')
Symptoms:
- In the Task Manager on the Details tab, the GDI objects column shows a threatening 10,000 (If this column is not present, you can add it by clicking on the table header with the right button and selecting the Select Columns option)
- When developing in C # or another language performed by the CLR, an exception is thrown that does not shine with specificity:
Message: A generic error occurred in GDI +.
Source: System.Drawing
TargetSite: IntPtr GetHbitmap (System.Drawing.Color)
Type: System.Runtime.InteropServices.ExternalException
Also, with certain settings or a version of the system, the exclusion may not be present, but your application will not be able to draw a single object. - When developing in C / C ++, all GDI methods like Create% SOME_GDI_OBJECT% began to return NULL
Why?
On Windows family systems, no more than 65535 GDI objects can be created simultaneously. The number, in fact, is unbelievably large and should not come close to under any normal scenario. The process is set to a limit of 10,000, which although you can change (in the registry, change the value of HKEY_LOCAL_MACHINE \ SOFTWARE \ Microsoft \ Windows NT \ CurrentVersion \ Windows \ GDIProcessHandleQuota from 256 to 65535), but Microsoft strongly does not recommend increasing this limit. If this is done, then one process will have the opportunity to put the system so that it cannot even draw an error message. In this case, the system can only come to life after a reboot.
How to fix?
If you live in a tidy CLR-controlled world, then the probability of 9 out of 10 is that you have a memory leak in your application. The problem, though unpleasant, is rather ordinary, and there are at least a dozen excellent tools for finding it. I will not dwell on this in detail. You will only need to use any profiler to see if the number of wrapper objects over GDI resources is increasing: Brush, Bitmap, Pen, Region, Graphics. If this is true, then you are lucky, you can close the tab with the article.
If there is no leakage of wrapper objects, it means that you have direct use of GDI functions in the code and a scenario in which they are not deleted.
What will others advise you?
The official Microsoft manual or other articles on this subject that you find on the Internet will advise something like the following:
Find all Create % SOME_GDI_OBJECT% and find out if there is a corresponding DeleteObject (or ReleaseDC for HDC objects), and if there is, then perhaps there is a script in which it will not be called.
There is a slightly improved version of this method, it contains an additional first step:
Download the utility GDIView . It can show a specific number of GDI objects by type and the only thing that is alarming is that the sum of all does not correspond to the value in the last column. You can try not to pay attention to this, if it helps to narrow down the search zone in any way.
The project I am working on has a code base of more than 9 million lines and about the same in third-party libraries, hundreds of GDI function calls spread across dozens of files. I spent a lot of energy and coffee before I realized that it’s simply impossible to analyze it manually without missing anything.
What will I offer?
If this method seems to you too long and requires extra gestures, it means that you have not gone through all the stages of despair with the previous one. You can try the previous steps a few more times, but if it does not help, then do not discount this option.
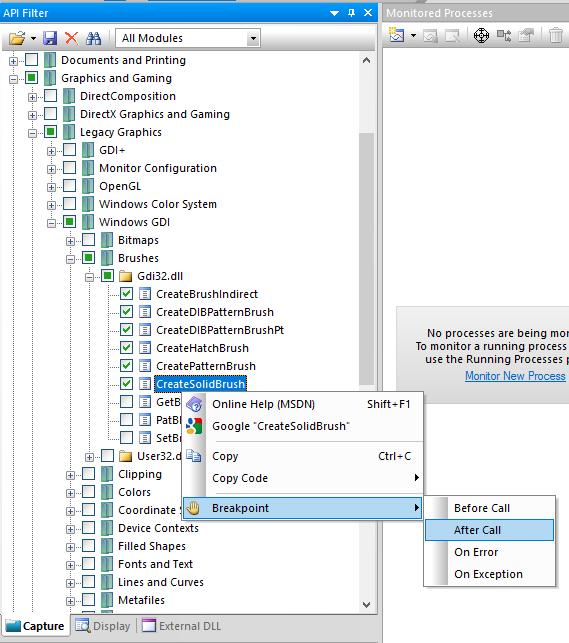
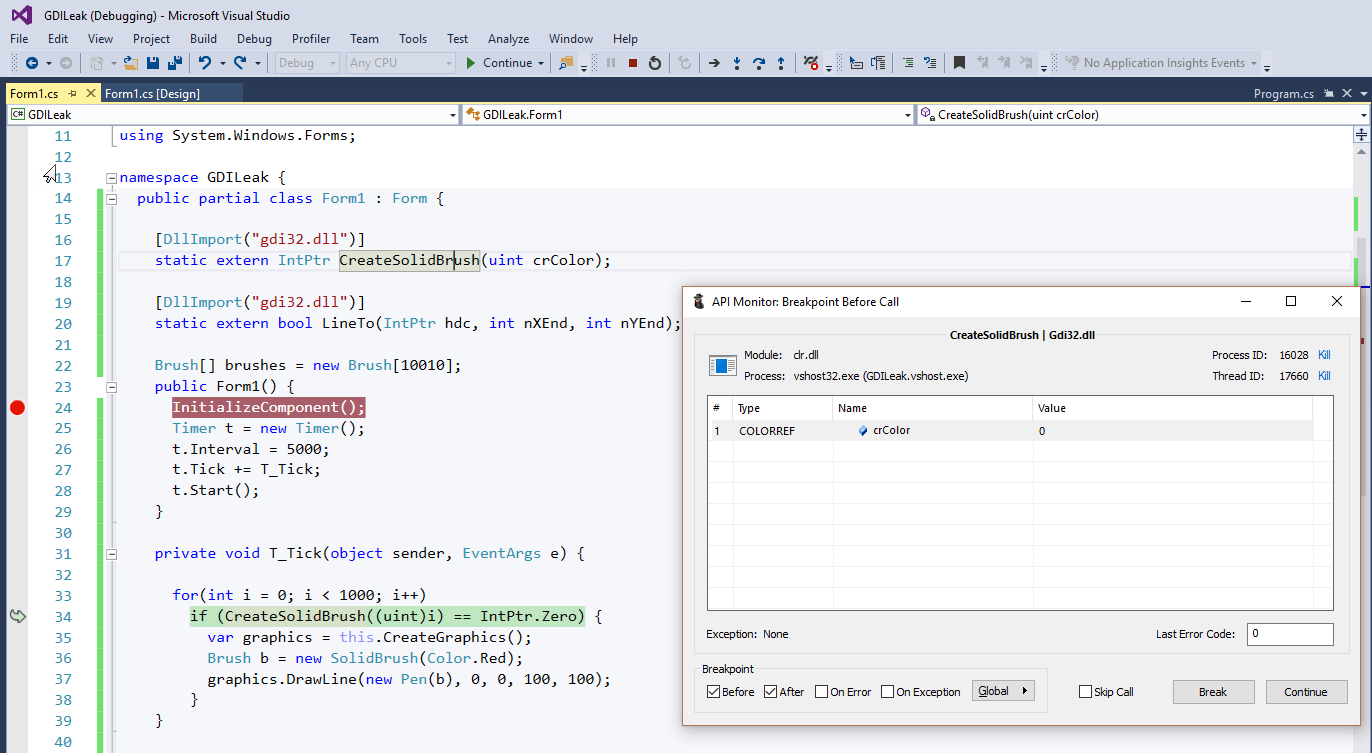
Looking for a leak, I wondered: “Where are the objects that flow away?” It was absolutely impossible to put breakpoints in all places where API functions are called. In addition, there was no complete certainty that this does not happen in the .net framework or one of the third-party libraries that we use. A few minutes of googling led me to the Api Monitor utility, which allowed me to log and debug calls to any system functions. I easily found a list of all the functions generating GDI objects, honestly found them and selected them in the Api Monitor, after which I set breakpoints.
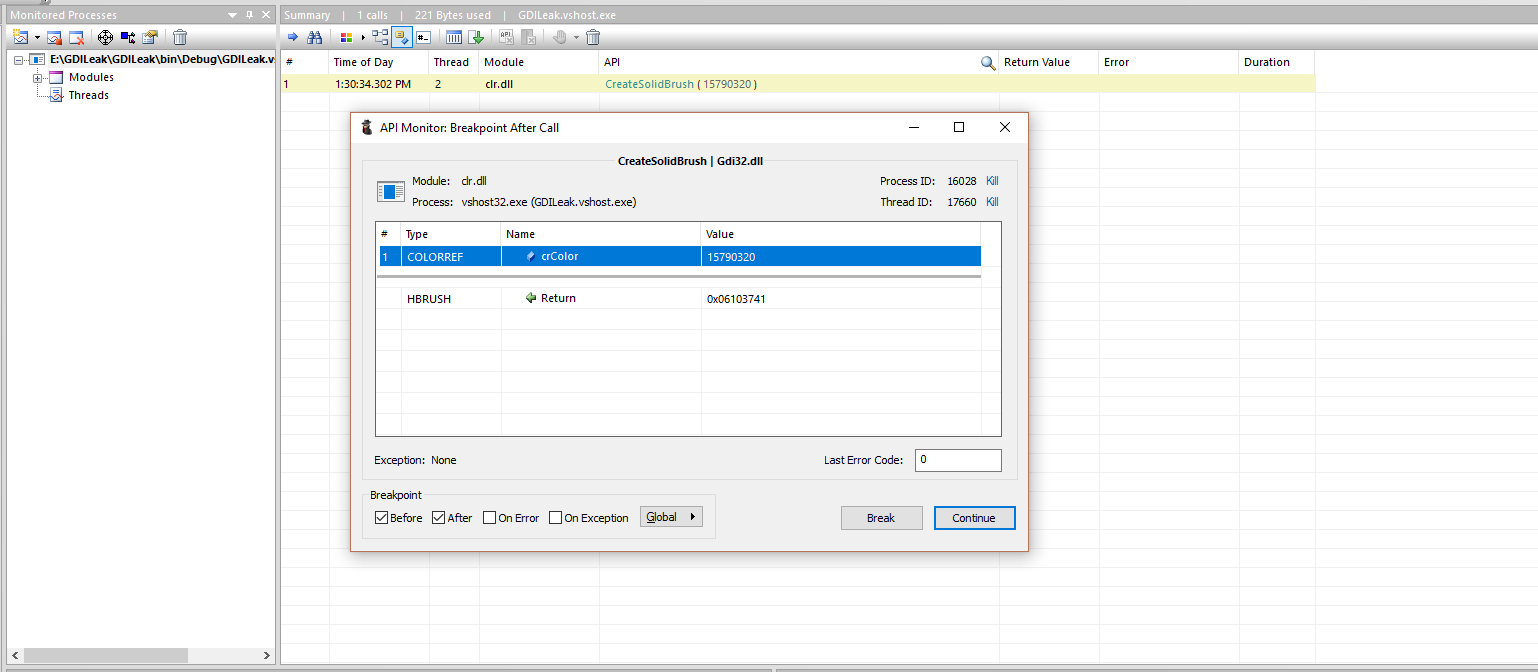
Then I started the process for debugging in Visual Studio , and here I chose it in the process tree. The first breakpoint worked instantly:
There were too many challenges. I quickly realized that I would drown in this stream and need to come up with something else. I removed the breakpoints from the functions and decided to see the log. These were thousands and thousands of challenges. It became obvious that they could not be analyzed manually.
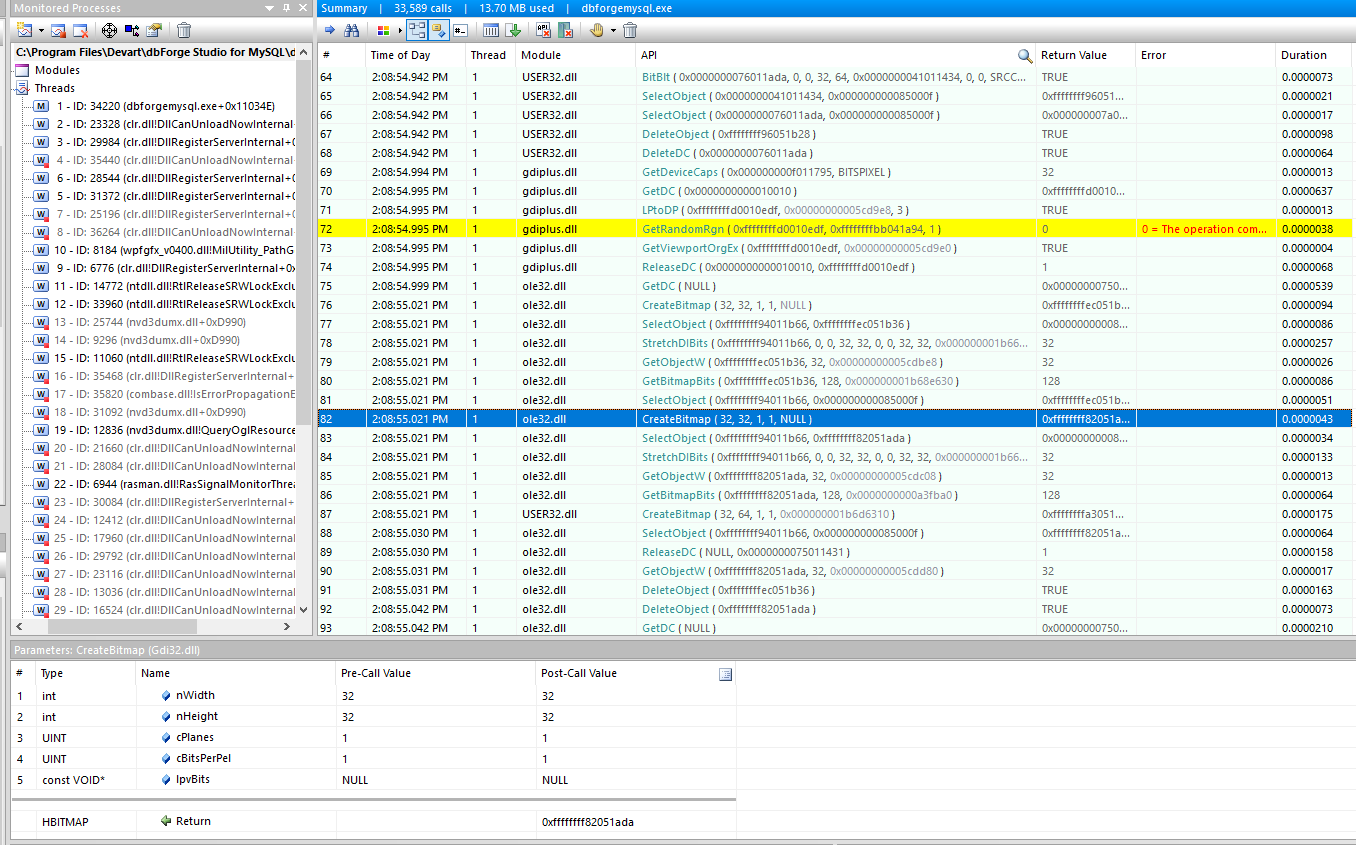
Task: Find those calls to GDI functions that do not correspond to deletion. The log contains everything you need: a list of function calls in chronological order, their return values and parameters. It turns out that I need to take the return value of the function Create% SOME_GDI_OBJECT% and find the call to DeleteObject with this value as an argument. I selected all the entries in the Api Monitor, pasted it into a text file and received something like a CSV with a TAB separator. I started VS, where I thought to write a program to parse it, but before it was loaded, I had a better idea: export the data to the database and write a query in order to get what interests me. It was the right choice, because it allowed me to quickly ask questions and get answers to them.
There are many tools to import data from CSV into the database, so I will not stop at this ( mysql , mssql , sqlite ).
I got this table:
-- mysql code CREATE TABLE apicalls ( id int(11) DEFAULT NULL, `Time of Day` datetime DEFAULT NULL, Thread int(11) DEFAULT NULL, Module varchar(50) DEFAULT NULL, API varchar(200) DEFAULT NULL, `Return Value` varchar(50) DEFAULT NULL, Error varchar(100) DEFAULT NULL, Duration varchar(50) DEFAULT NULL ) Wrote the mysql function to get the handle of the object to be deleted from the call to api:
CREATE FUNCTION getHandle(api varchar(1000)) RETURNS varchar(100) CHARSET utf8 BEGIN DECLARE start int(11); DECLARE result varchar(100); SET start := INSTR(api,','); -- for ReleaseDC where HDC is second parameter. ex: 'ReleaseDC ( 0x0000000000010010, 0xffffffffd0010edf )' IF start = 0 THEN SET start := INSTR(api, '('); END IF; SET result := SUBSTRING_INDEX(SUBSTR(api, start + 1), ')', 1); RETURN TRIM(result); END Finally, a query that finds all current objects:
SELECT creates.id, creates.handle chandle, creates.API, dels.API deletedApi FROM (SELECT a.id, a.`Return Value` handle, a.API FROM apicalls a WHERE a.API LIKE 'Create%') creates LEFT JOIN (SELECT d.id, d.API, getHandle(d.API) handle FROM apicalls d WHERE API LIKE 'DeleteObject%' OR API LIKE 'ReleaseDC%' LIMIT 0, 100) dels ON dels.handle = creates.handle WHERE creates.API LIKE 'Create%'; (Strictly speaking, it will simply find all Delete calls to all Create calls.)The figure immediately shows calls for which there was not a single Delete.
The last question remains: How to find where these methods are called from in the context of my code? And here one tricky trick helped me:
- Run the debug application in VS.
- Find it in Api Monitor and select.
- Select the desired function Api and put a breakpoint.
- Patiently click “Next” until it is called up with parameters of interest. (So how was the conditional breakpoints from vs missing?
- When you reach the desired call, go to VS and press break all.
- The VS debugger will be stopped at the place where the leaking object is created and it remains only to find why it is not deleted.
(The code is written solely for example)
Summary:
The algorithm is long and complex, many tools are involved in it, but it gave me a result much faster than a dumb search for errors on a huge code base.
Here it is, for those who were too lazy to read, or who had already forgotten how it all began, while reading:
- Search GDI Wrapper Object Memory Leaks
- If they are, eliminate and repeat the first step.
- If they are not there, then look for calls to the api functions directly.
- If there are not many of them, then search for a scenario in which the object may not be deleted.
- If there are a lot of them or it is impossible to track them, then you need to download the Api Monitor and configure it to log calls to GDI functions.
- Run the debug application in VS
- Reproduce leakage (this initializes the program so that cached objects are not mazol eyes in the log).
- Connect with Api Monitor.
- Reproduce the leak.
- Copy the log to a text file, import into any database that is at hand (the scripts in the article for mysql, but easily adapt to any RDBMS)
- Match the Create and Delete methods (the SQL script is earlier in this article), find those that do not have the Delete call
- Set a breakpoint on the required method in Api Monitor.
- Press continue until the method is called with the desired parameters. Cry for lack of conditional breakpoints.
- When the method is called with the necessary parameters, click Break All in VS.
- Find why this object is not deleted.
I really hope that this article will save someone a lot of time and will be useful.
Source: https://habr.com/ru/post/318948/
All Articles