We're friends with Prometheus with Caché
Prometheus is one of the monitoring systems adapted for collecting time series data .
It is quite simple in installation and initial setup. It has a built-in graphic subsystem for displaying PromDash data, but the developers themselves recommend using the free third-party product Grafana . Prometheus can monitor a lot of things (hardware, containers, various DBMS), but in this article I would like to dwell on the implementation of monitoring the Caché instance (more precisely, the instance will be Ensemble, but we will take the metrics porridge). To whom it is interesting - you are welcome under the cat.

In our simplest case, Prometheus and Caché will live on the same machine (Fedora Workstation 24 x86_64). Caché Version:
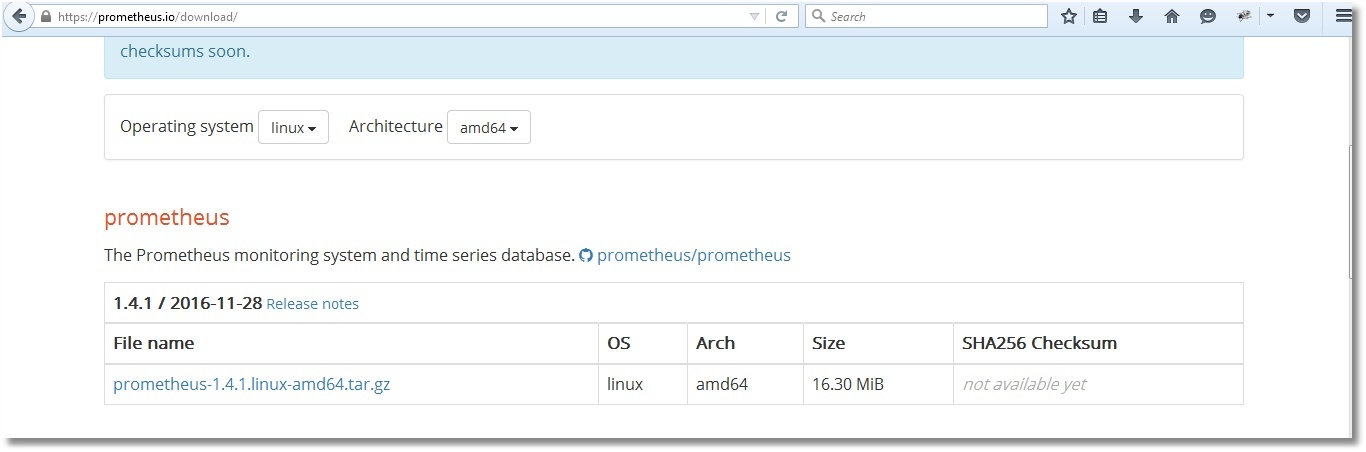
Downloading a suitable Prometheus distribution from offsite and save it to the / opt / prometheus directory.
')
We unpack archive, we rule the available sample config according to our needs and we start Prometheus. By default, Prometheus will log its work directly to the console, so we will redirect its activity records to a log file.
The prometheus.yml config is described in a YAML language that does not like tabs, only spaces should be used. Above, we indicated that we will pull the metrics from the address http: // localhost: 57772 and we will poll the application / metrics / cache (the name of the application is chosen arbitrarily), i.e. The final address for collecting metrics will be http: // localhost: 57772 / metrics / cache . The label “job = isc_cache” will be added to each metric. The label is, quite roughly, the equivalent of WHERE for SQL. In our case, it will not be used, but for the number of servers, more than one, it is even suitable. For example, the names of servers (and / or instances) can be stored in labels and, in future, with labels, parameterize requests for drawing graphs. Let's check that Prometheus has earned (higher in the output we see the port that it is listening on - 9090):
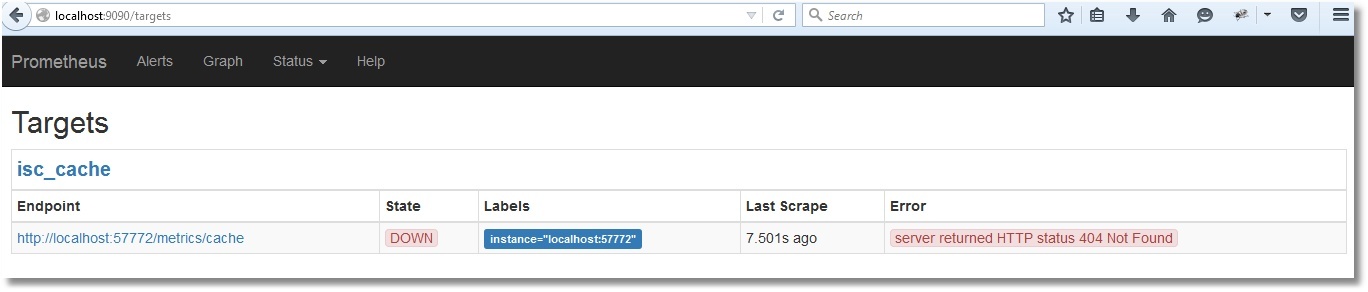
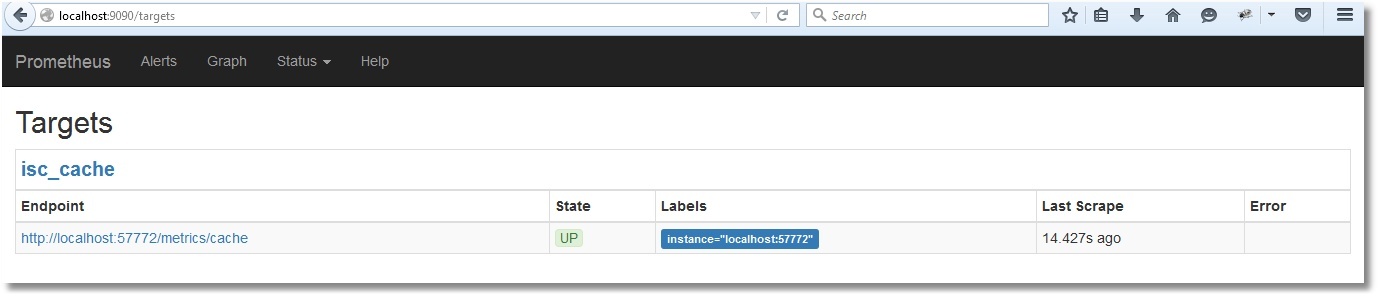
The web interface has opened, so Prometheus is working. However, he still doesn’t see the Caché metrics, of course (check by clicking Status → Targets):
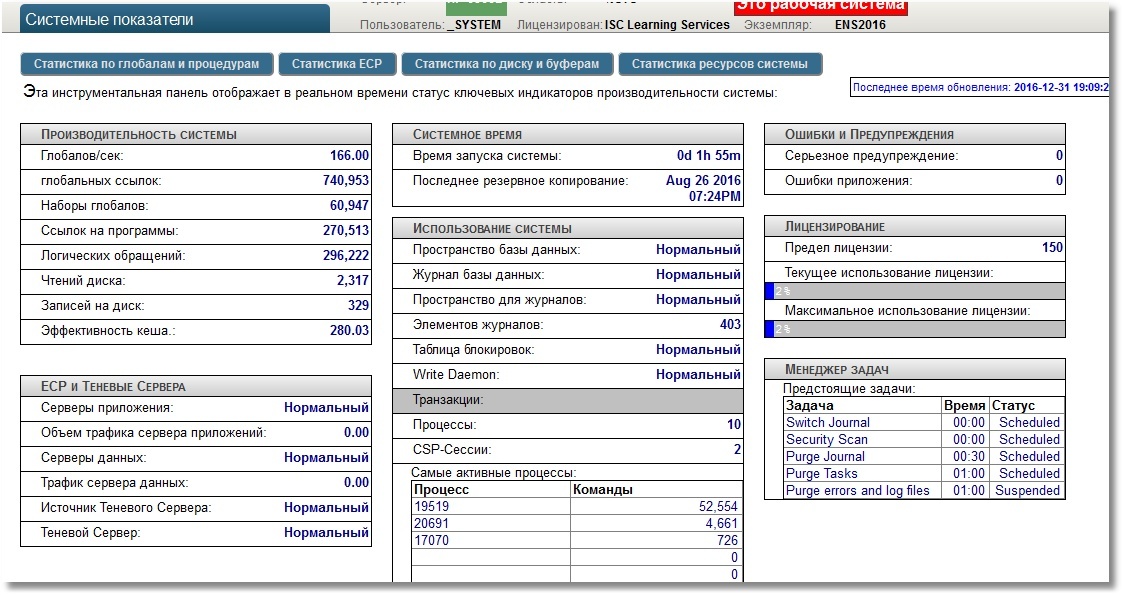
Our task is to make it so that at http: // localhost: 57772 / metrics / cache it is possible to pull down the metrics in a way that is clear to Prometheus. We will use Caché REST capabilities due to their simplicity. Immediately, we note that Prometheus "understands" only numeric metrics, so we will not export string metrics. To get test metrics we will use the API class SYS.Stats.Dashboard . These metrics are used by Caché itself to display the System toolbar:
The USER area will serve as a sandbox. First, create a REST web application / metrics. For at least some security, we specify the login to the application with a password, we also indicate that there will be a certain resource corresponding to this web application, let's call it PromResource. In a resource we close public access. That is, do the following:
Settings of our web application:
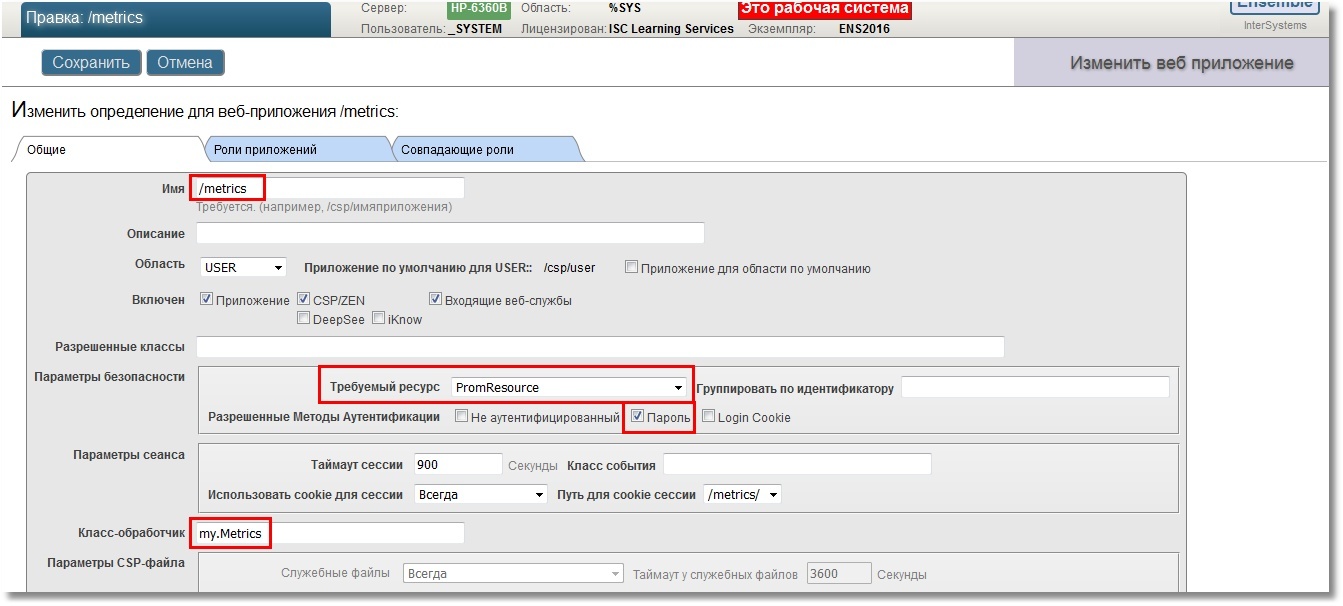
We will need a user who can use this resource. Also, the user must have the rights to read the working database (in our case, USER) and write to it. In addition, he will need the right to read the CACHESYS system database, since we will move to the% SYS area below in the implementation code. We will follow the standard scheme, i.e. create a PromRole role with these capabilities, then create a PromUser user with this role. Password, for example, choose "Secret":
We will specify this PromUser user for authentication in the Prometheus config. Then we re-read the config by sending the SIGHUP signal to the server process.
Prometheus can now successfully authenticate to use a web application with metrics.
Metrics will be given to us by the my.Metrics REST request handler class.
In the console, let's check that our works were not in vain (the --silent key was added so that curl does not interfere with its progress bar):
Now you can check in the interface of Prometheus:
Here is a list of our metrics:
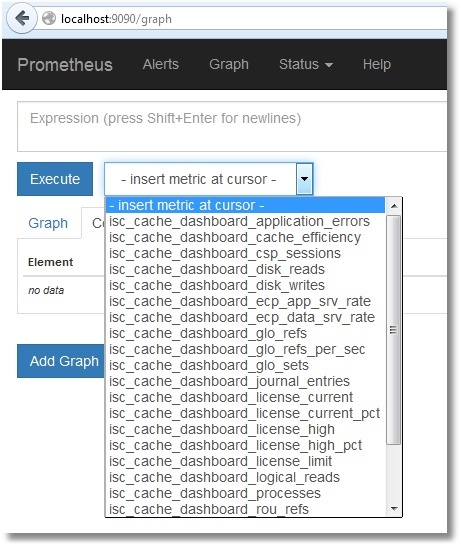
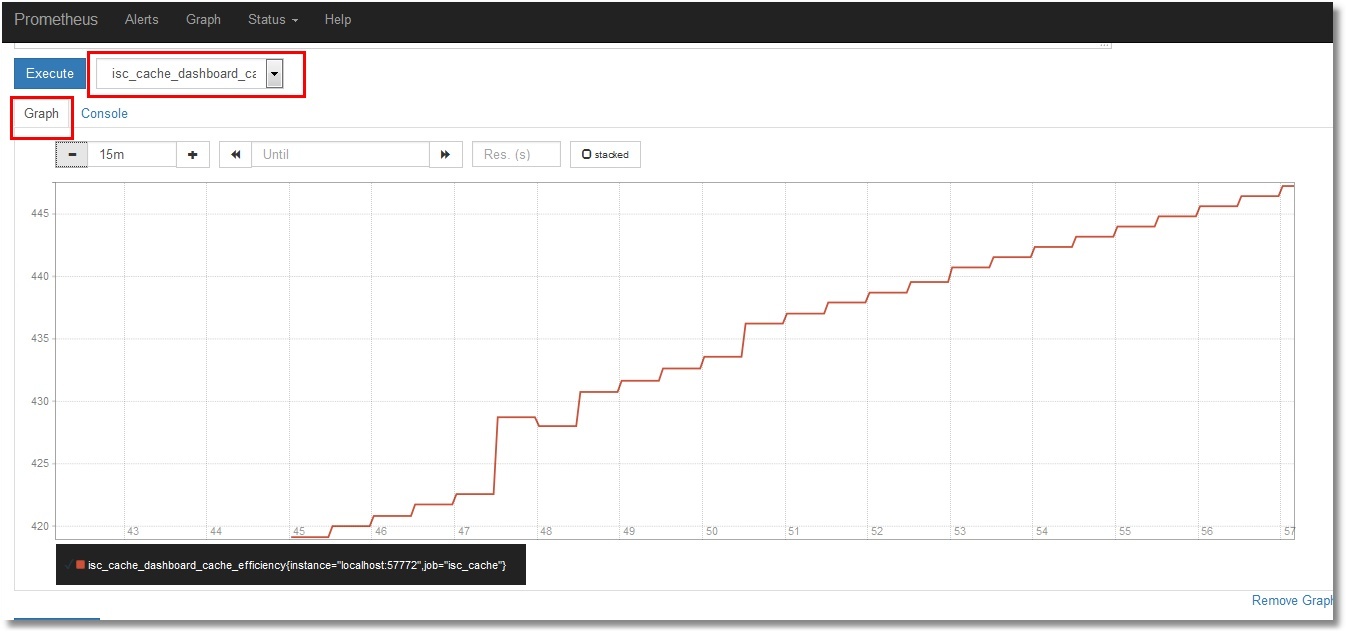
We will not dwell on their viewing in the Prometheus itself. Those interested can select the desired metric and click the “Execute” button. By selecting the “Graph” tab, you can see the graph (the cache efficiency is shown):
For the graphic display we will set ourselves Grafana . For this article, an installation of tarball was chosen. But there are many installation options, from packages to container. Perform these steps (just create the directory / opt / grafana and go into it):
Config while we will leave as is. And in the last step, we will start Grafana in the background. The Grafana log will be redirected to a file, as is the case with Prometheus:
The default Grafana web interface is available on port 3000. Login / password: admin / admin.
How to make friends Prometheus with Grafana is described here . If in your own words, then we add a new Data Source with the type Prometheus. As direct / proxy access, choose your option:
Then we add a dashboard with the panels we need. Dashboard Dashboard is available in public . There is also a class code for collecting metrics. Dashboards can be simply imported into your Grafana (Dashboards → Import):
After the import, we get the following picture:
Let's save Dashboard:
The time range selection and update period are selected at the top right:
Test the monitoring of access to globals:
We see that the number of references to globals per second has increased, while the cache efficiency has fallen (the global ^ prometheus was not in the cache yet):
Check the use of licenses. Create a primitive CSP page PromTest.csp in the USER area:
And we will visit it a certain number of times (we assume the application / csp / user is not password protected):
We will see this picture with licenses:
As you can see, the implementation of such monitoring is not difficult. Already at the initial stage, we can obtain important information about the operation of the system, such as: the use of licenses, the effectiveness of the global cache, the presence of application errors. For example, the SYS.Stats.Dashboard class was taken, but other classes of the SYS,% SYSTEM,% SYS packages deserve no less attention. Also, no one limits in imagination and the possibility of writing your own class, which, upon request, gives out the metrics of your application, for example, the number of documents of one type or another. Some useful metrics are planned to be put in a separate template for Grafana.
If this topic is interesting, the sequel will follow. What are the plans:
In the process of preparing this article, a number of useful places were visited and a number of videos were viewed:
Thanks to read to this line!
PS Added the second part .
It is quite simple in installation and initial setup. It has a built-in graphic subsystem for displaying PromDash data, but the developers themselves recommend using the free third-party product Grafana . Prometheus can monitor a lot of things (hardware, containers, various DBMS), but in this article I would like to dwell on the implementation of monitoring the Caché instance (more precisely, the instance will be Ensemble, but we will take the metrics porridge). To whom it is interesting - you are welcome under the cat.
In our simplest case, Prometheus and Caché will live on the same machine (Fedora Workstation 24 x86_64). Caché Version:
% Sys> write $ zv
Cache for UNIX (Red Hat Enterprise Linux for x86-64) 2016.1 (Build 656U) Fri Mar 11 2016 17:58:47 EST
Installation and configuration
Downloading a suitable Prometheus distribution from offsite and save it to the / opt / prometheus directory.
')
We unpack archive, we rule the available sample config according to our needs and we start Prometheus. By default, Prometheus will log its work directly to the console, so we will redirect its activity records to a log file.
Launch Prometheus
# pwd
/ opt / prometheus
# ls
prometheus-1.4.1.linux-amd64.tar.gz
# tar -xzf prometheus-1.4.1.linux-amd64.tar.gz
# ls
prometheus-1.4.1.linux-amd64 prometheus-1.4.1.linux-amd64.tar.gz
# cd prometheus-1.4.1.linux-amd64 /
# ls
console_libraries consoles LICENSE NOTICE prometheus prometheus.yml promtool
# cat prometheus.yml
global:
scrape_interval: 15s # Set the scrape interval to every 15 seconds. Default is every 1 minute.
scrape_configs:
- job_name: 'isc_cache'
metrics_path: '/ metrics / cache'
static_configs:
- targets: ['localhost: 57772']
# ./prometheus> /var/log/prometheus.log 2> & 1 &
[1] 7117
# head /var/log/prometheus.log
time = "2017-01-01T09: 01: 11 + 02: 00" level = info msg = "Starting prometheus (version = 1.4.1, branch = master, revision = 2a89e8733f240d3cd57a6520b52c36ac4744ce12)" source = "main.go: 77"
time = "2017-01-01T09: 01: 11 + 02: 00" level = info msg = "Build context (go = go1.7.3, user = root @ e685d23d8809, date = 20161128-09: 59: 22)" source = "Main.go: 78"
time = "2017-01-01T09: 01: 11 + 02: 00" level = info msg = "Loading configuration file prometheus.yml" source = "main.go: 250"
time = "2017-01-01T09: 01: 11 + 02: 00" level = info msg = "Loading series map and head chunks ..." source = "storage.go: 354"
time = "2017-01-01T09: 01: 11 + 02: 00" level = info msg = "23 series loaded." source = "storage.go: 359"
time = "2017-01-01T09: 01: 11 + 02: 00" level = info msg = " Listening on: 9090 " source = "web.go: 248"
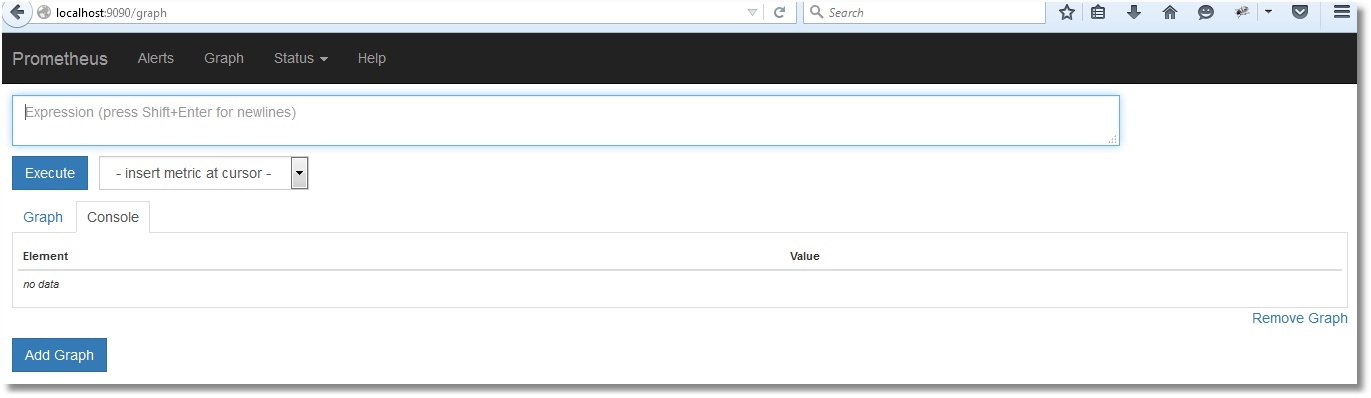
The prometheus.yml config is described in a YAML language that does not like tabs, only spaces should be used. Above, we indicated that we will pull the metrics from the address http: // localhost: 57772 and we will poll the application / metrics / cache (the name of the application is chosen arbitrarily), i.e. The final address for collecting metrics will be http: // localhost: 57772 / metrics / cache . The label “job = isc_cache” will be added to each metric. The label is, quite roughly, the equivalent of WHERE for SQL. In our case, it will not be used, but for the number of servers, more than one, it is even suitable. For example, the names of servers (and / or instances) can be stored in labels and, in future, with labels, parameterize requests for drawing graphs. Let's check that Prometheus has earned (higher in the output we see the port that it is listening on - 9090):
The web interface has opened, so Prometheus is working. However, he still doesn’t see the Caché metrics, of course (check by clicking Status → Targets):
Preparation of metrics
Our task is to make it so that at http: // localhost: 57772 / metrics / cache it is possible to pull down the metrics in a way that is clear to Prometheus. We will use Caché REST capabilities due to their simplicity. Immediately, we note that Prometheus "understands" only numeric metrics, so we will not export string metrics. To get test metrics we will use the API class SYS.Stats.Dashboard . These metrics are used by Caché itself to display the System toolbar:
An example of the same in the Terminal
% SYS> set dashboard = ## class (SYS.Stats.Dashboard) .Sample ()
% Sys > zwrite dashboard
dashboard = <OBJECT REFERENCE> [2@SYS.Stats.Dashboard]
+ ----------------- general information - | oref value: 2
| class name: SYS.Stats.Dashboard
| reference count: 2
+ ----------------- attribute values - | ApplicationErrors = 0
| CSPSessions = 2
| CacheEfficiency = 280.03
| DatabaseSpace = "Normal"
| DiskReads = 2317
| DiskWrites = 329
| ECPAppServer = "OK"
| ECPAppSrvRate = 0
| ECPDataServer = "OK"
| ECPDataSrvRate = 0
| GloRefs = 740953
| GloRefsPerSec = "166.00"
| GloSets = 60947
| JournalEntries = 403
...
The USER area will serve as a sandbox. First, create a REST web application / metrics. For at least some security, we specify the login to the application with a password, we also indicate that there will be a certain resource corresponding to this web application, let's call it PromResource. In a resource we close public access. That is, do the following:
% SYS> write ## class (Security.Resources) .Create ("PromResource", "Resource for Metrics web page", "")
one
Settings of our web application:
We will need a user who can use this resource. Also, the user must have the rights to read the working database (in our case, USER) and write to it. In addition, he will need the right to read the CACHESYS system database, since we will move to the% SYS area below in the implementation code. We will follow the standard scheme, i.e. create a PromRole role with these capabilities, then create a PromUser user with this role. Password, for example, choose "Secret":
% SYS> write ## class (Security.Roles) .Create ("PromRole", "Role for PromResource", "PromResource: U,% DB_USER: RW,% DB_CACHESYS: R")
one
% SYS> write ## class (Security.Users) .Create ("PromUser", "PromRole", "Secret")
one
We will specify this PromUser user for authentication in the Prometheus config. Then we re-read the config by sending the SIGHUP signal to the server process.
Safer config
# cat /opt/prometheus/prometheus-1.4.1.linux-amd64/prometheus.yml
global:
scrape_interval: 15s # Set the scrape interval to every 15 seconds. Default is every 1 minute.
scrape_configs:
- job_name: 'isc_cache'
metrics_path: '/ metrics / cache'
static_configs:
- targets: ['localhost: 57772']
basic_auth:
username: 'PromUser'
password: 'Secret'
#
# kill -SIGHUP $ (pgrep prometheus) # or kill -1 $ (pgrep prometheus)
Prometheus can now successfully authenticate to use a web application with metrics.
Metrics will be given to us by the my.Metrics REST request handler class.
Here is its implementation
Class my.Metrics Extends %CSP.REST { Parameter ISCPREFIX = "isc_cache"; Parameter DASHPREFIX = {..#ISCPREFIX_"_dashboard"}; XData UrlMap [ XMLNamespace = "http://www.intersystems.com/urlmap" ] { <Routes> <Route Url="/cache" Method="GET" Call="getMetrics"/> </Routes> } /// Output should obey the Prometheus exposition formats. Docs: /// https://prometheus.io/docs/instrumenting/exposition_formats/ /// /// The protocol is line-oriented. A line-feed character (\n) separates lines. /// The last line must end with a line-feed character. Empty lines are ignored. ClassMethod getMetrics() As %Status { set nl = $c(10) do ..getDashboardSample(.dashboard) do ..getClassProperties(dashboard.%ClassName(1), .propList, .descrList) for i=1:1:$ll(propList) { set descr = $lg(descrList,i) set propertyName = $lg(propList,i) set propertyValue = $property(dashboard, propertyName) // Prometheus supports time series database // so if we get empty (for example, backup metrics) or non-digital metrics // we just omit them. if ((propertyValue '= "") && ('$match(propertyValue, ".*[-A-Za-z ]+.*"))) { set metricsName = ..#DASHPREFIX_..camelCase2Underscore(propertyName) set metricsValue = propertyValue // Write description (help) for each metrics. // Format is that the Prometheus requires. // Multiline descriptions we have to join in one string. write "# HELP "_metricsName_" "_$replace(descr,nl," ")_nl write metricsName_" "_metricsValue_nl } } write nl quit $$$OK } ClassMethod getDashboardSample(Output dashboard) { new $namespace set $namespace = "%SYS" set dashboard = ##class(SYS.Stats.Dashboard).Sample() } ClassMethod getClassProperties(className As %String, Output propList As %List, Output descrList As %List) { new $namespace set $namespace = "%SYS" set propList = "", descrList = "" set properties = ##class(%Dictionary.ClassDefinition).%OpenId(className).Properties for i=1:1:properties.Count() { set property = properties.GetAt(i) set propList = propList_$lb(property.Name) set descrList = descrList_$lb(property.Description) } } /// Converts metrics name in camel case to underscore name with lower case /// Sample: input = WriteDaemon, output = _write_daemon ClassMethod camelCase2Underscore(metrics As %String) As %String { set result = metrics set regexp = "([AZ])" set matcher = ##class(%Regex.Matcher).%New(regexp, metrics) while (matcher.Locate()) { set result = matcher.ReplaceAll("_"_"$1") } // To lower case set result = $zcvt(result, "l") // _e_c_p (_c_s_p) to _ecp (_csp) set result = $replace(result, "_e_c_p", "_ecp") set result = $replace(result, "_c_s_p", "_csp") quit result } } In the console, let's check that our works were not in vain (the --silent key was added so that curl does not interfere with its progress bar):
Checking unloading metrics
# curl --user PromUser: Secret --silent -XGET 'http: // localhost: 57772 / metrics / cache' | head -20
# HELP isc_cache_dashboard_application_errors Number of application errors
isc_cache_dashboard_application_errors 0
# HELP isc_cache_dashboard_csp_sessions Most recent number of CSP sessions.
isc_cache_dashboard_csp_sessions 2
HELP isc_cache_dashboard_cache_efficiency Most recently measured cache efficiency (Global references / (physical reads + writes))
isc_cache_dashboard_cache_efficiency 439.56
# HELP isc_cache_dashboard_disk_reads Number of physical block read operations since system startup.
isc_cache_dashboard_disk_reads 2605
# HELP isc_cache_dashboard_disk_writes Number
isc_cache_dashboard_disk_writes 1021
# HELP isc_cache_dashboard_ecp_app_srv_rate Most recently measured ECP.
isc_cache_dashboard_ecp_app_srv_rate 0
# HELP isc_cache_dashboard_ecp_data_srv_rate Most recently measured ECP.
isc_cache_dashboard_ecp_data_srv_rate 0
# HELP isc_cache_dashboard_glo_refs Number of Global references since system startup.
isc_cache_dashboard_glo_refs 1593830
# HELP isc_cache_dashboard_glo_refs_per_sec Most recently measured number of global references per second.
isc_cache_dashboard_glo_refs_per_sec 131.00
# HELP isc_cache_dashboard_glo_sets Number of Global Sets and Kills since system startup.
isc_cache_dashboard_glo_sets 132003
Now you can check in the interface of Prometheus:
Here is a list of our metrics:
We will not dwell on their viewing in the Prometheus itself. Those interested can select the desired metric and click the “Execute” button. By selecting the “Graph” tab, you can see the graph (the cache efficiency is shown):
Visualization of metrics
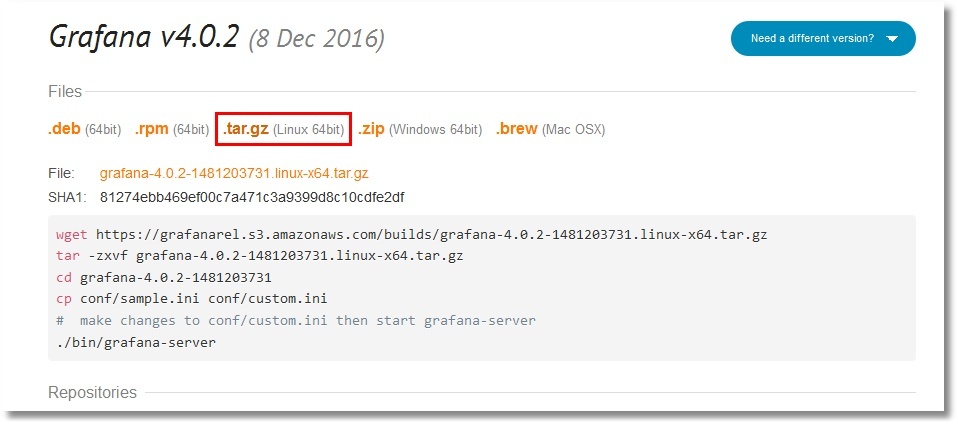
For the graphic display we will set ourselves Grafana . For this article, an installation of tarball was chosen. But there are many installation options, from packages to container. Perform these steps (just create the directory / opt / grafana and go into it):
Config while we will leave as is. And in the last step, we will start Grafana in the background. The Grafana log will be redirected to a file, as is the case with Prometheus:
# ./bin/grafana-server> /var/log/grafana.log 2> & 1 &
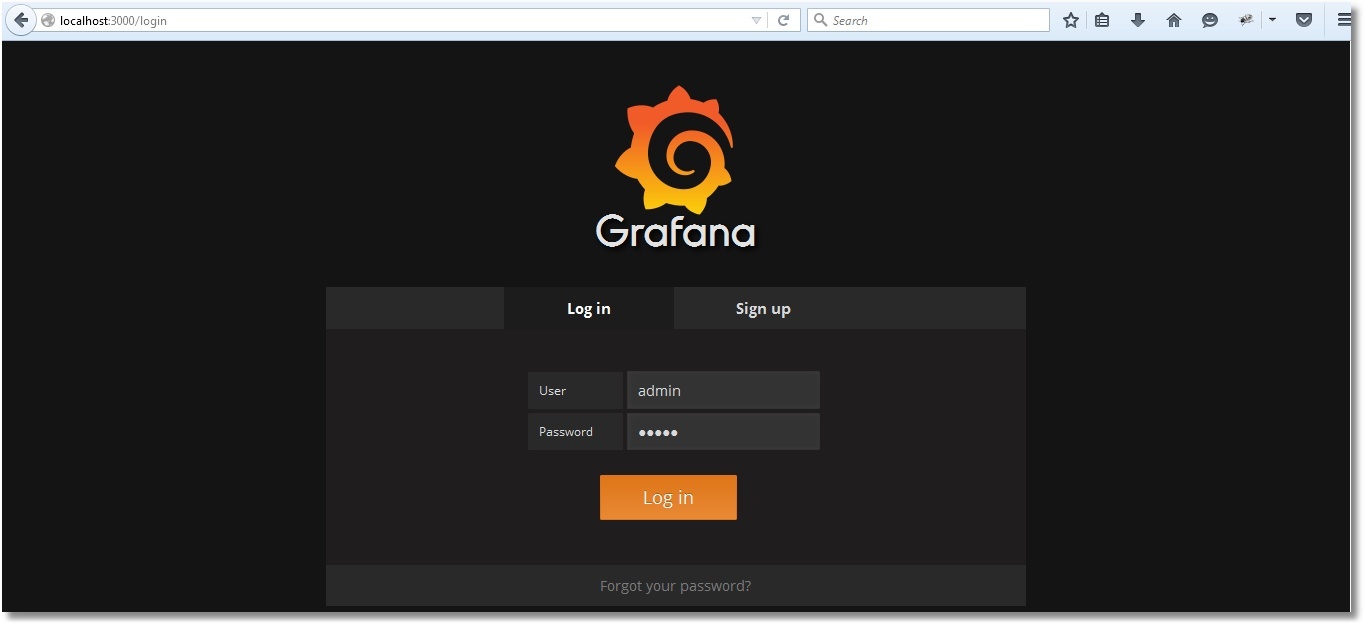
The default Grafana web interface is available on port 3000. Login / password: admin / admin.
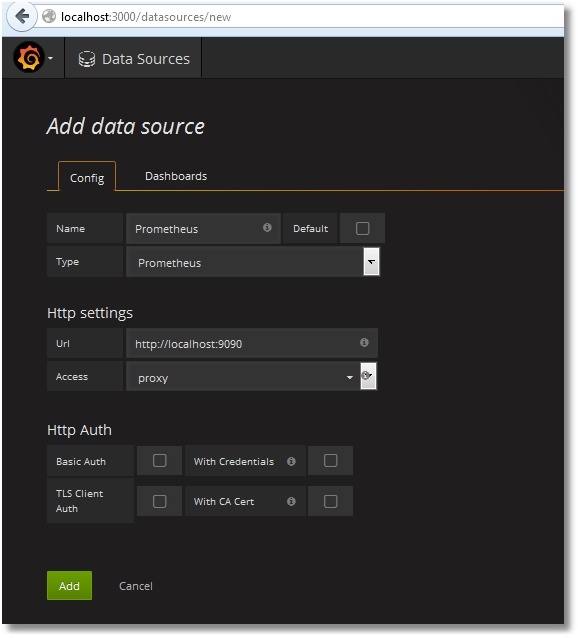
How to make friends Prometheus with Grafana is described here . If in your own words, then we add a new Data Source with the type Prometheus. As direct / proxy access, choose your option:
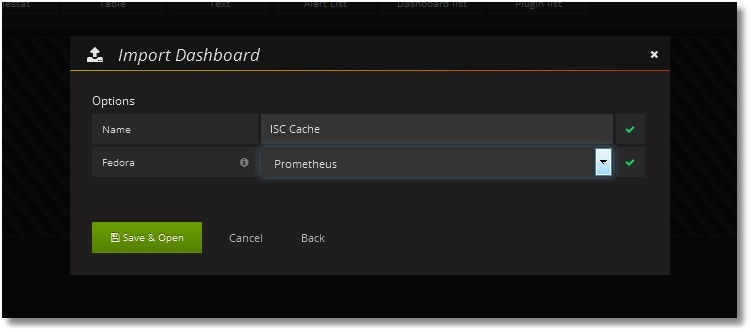
Then we add a dashboard with the panels we need. Dashboard Dashboard is available in public . There is also a class code for collecting metrics. Dashboards can be simply imported into your Grafana (Dashboards → Import):
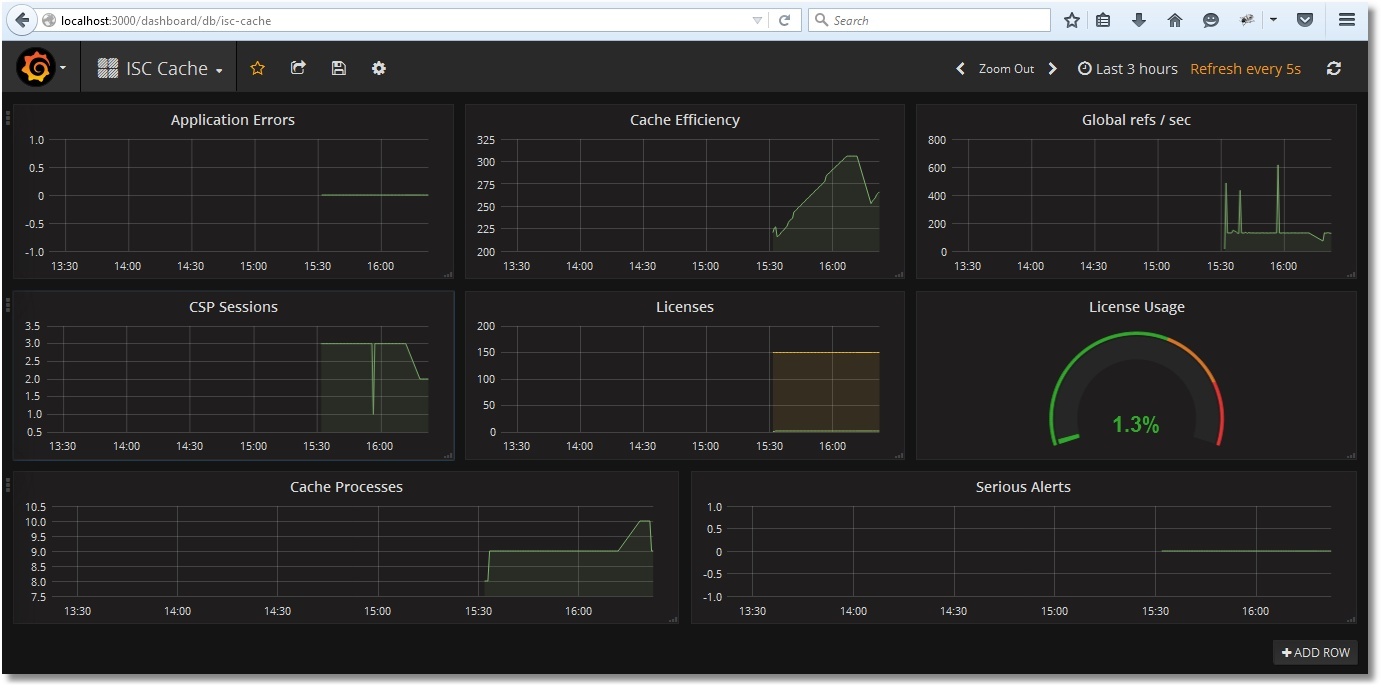
After the import, we get the following picture:
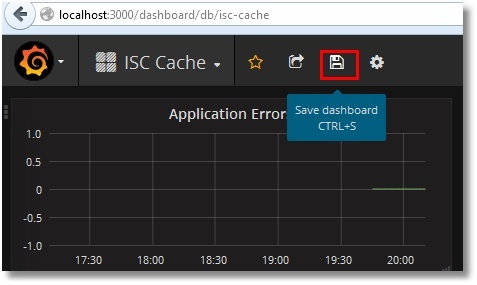
Let's save Dashboard:
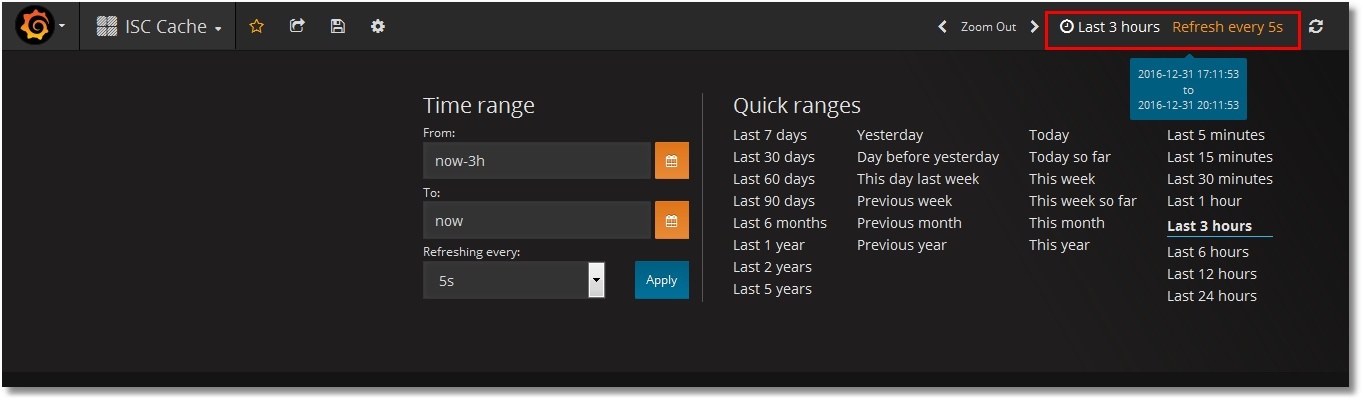
The time range selection and update period are selected at the top right:
Examples of monitoring work
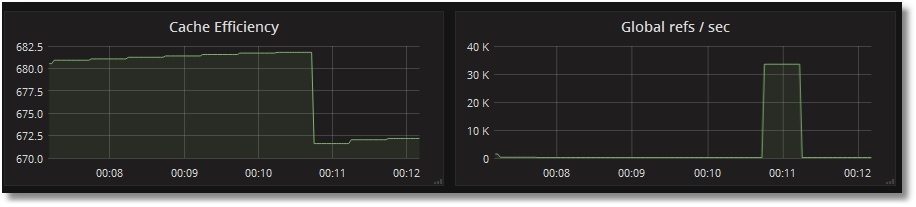
Test the monitoring of access to globals:
USER> for i = 1: 1: 1000000 {set ^ prometheus (i) = i}
USER> kill ^ prometheus
We see that the number of references to globals per second has increased, while the cache efficiency has fallen (the global ^ prometheus was not in the cache yet):
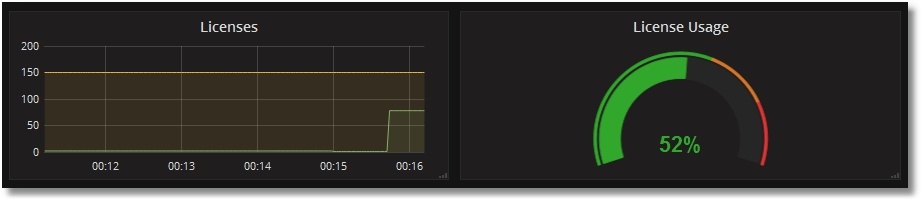
Check the use of licenses. Create a primitive CSP page PromTest.csp in the USER area:
<html>
<head> <title> Prometheus Test Page </ title> </ head>
<body> Monitoring works fine! </ body>
</ html>
And we will visit it a certain number of times (we assume the application / csp / user is not password protected):
# ab -n77 http: // localhost: 57772 / csp / user / PromTest.csp
We will see this picture with licenses:
Brief conclusions
As you can see, the implementation of such monitoring is not difficult. Already at the initial stage, we can obtain important information about the operation of the system, such as: the use of licenses, the effectiveness of the global cache, the presence of application errors. For example, the SYS.Stats.Dashboard class was taken, but other classes of the SYS,% SYSTEM,% SYS packages deserve no less attention. Also, no one limits in imagination and the possibility of writing your own class, which, upon request, gives out the metrics of your application, for example, the number of documents of one type or another. Some useful metrics are planned to be put in a separate template for Grafana.
To be continued
If this topic is interesting, the sequel will follow. What are the plans:
- Preparing a template for Grafana with metrics for the daemon write operation. It would be nice to make a certain graphical analogue of the ^ mgstat utility , in any case, for a part of its metrics.
- The password for the web application is good, but I would like to check the possibility of using certificates.
- The use of Prometheus, Grafana and some exporters for Prometheus is already in the form of Docker containers.
- Use discovery services to automatically add new Caché instances to Prometheus monitoring. Here I would also like to show in practice such a convenient Grafana thing as templates. This is something like dynamic panels, when depending on the selected server, only its metrics are shown, but all this is on the same Dashboard.
- Alert Manager Prometheus.
- Prometheus configuration settings regarding data retention time, as well as optimization options for systems with a large number of metrics and a small collection interval.
- Different nuances that will emerge along the way.
Links
In the process of preparing this article, a number of useful places were visited and a number of videos were viewed:
- Prometheus project website
- Grafana project website
- Selectel blog
- The blog of one of the developers of Prometheus named Brian Brazil
- Tutorial on DigitalOcean site
- A little video from the company Robust Perception
- Lots of videos from the Prometheus conference
Thanks to read to this line!
PS Added the second part .
Source: https://habr.com/ru/post/318940/
All Articles