Interactive results table
Looking at the results table of the football season, I often ask myself questions:
The static table does not give answers.
The search for a successful visualization of the season on the Internet ended unsuccessfully, so I began to experiment myself.
')
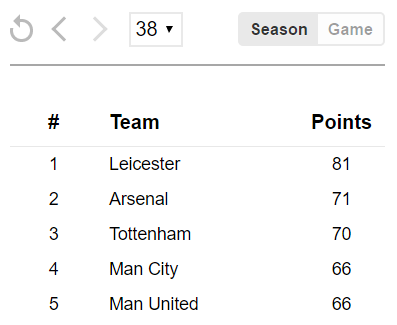
The graphs either quickly lost readability with an increase in the number of commands, or required nontrivial concentration at the first contact. In the end, it all ended with what began with a table. More precisely, a script that converts the results of the season into an interactive table. You can see the results after any tour, or simply click on the replay and watch the teams float up and down the table:
→ Live demo
Find the results of any at least some popular championship is not a problem, thanks to the great bookmaker industry. To demonstrate, I'll take the results of the English Premier League matches on Football Data :
The script parses the csv file, converts the data into javascript objects that are convenient for presentation, and adds additional information — for example, the number of victories, draws and defeats after each round.
Done:
The attentive reader has already noticed the
I tried to make it so that the script could be used for as many sports as possible without elaboration. There are examples on the tables website along with the source code:
Use spreadsheets on any sites, including commercial ones.
→ Code on Github .
Thank you Dasha for the beauty.
Update. The script has grown into a full-fledged library .
- Did the team lead from the beginning of the season or did it make a heroic breakthrough at the end?
- How did the winter transfer window affect the results?
- Did the teams play the season in the middle of the table or play at full strength?
The static table does not give answers.
The search for a successful visualization of the season on the Internet ended unsuccessfully, so I began to experiment myself.
')
The graphs either quickly lost readability with an increase in the number of commands, or required nontrivial concentration at the first contact. In the end, it all ended with what began with a table. More precisely, a script that converts the results of the season into an interactive table. You can see the results after any tour, or simply click on the replay and watch the teams float up and down the table:
→ Live demo
Input data
Find the results of any at least some popular championship is not a problem, thanks to the great bookmaker industry. To demonstrate, I'll take the results of the English Premier League matches on Football Data :
| Date | Home team | Score | Away Team | Score |
|---|---|---|---|---|
| August 8, 2015 | Bournemouth | 0 | Aston villa | one |
| August 8, 2015 | Chelsea | 2 | Swansea | 2 |
| August 8, 2015 | Everton | 2 | Watford | 2 |
| ... | ... | ... | ... | ... |
The script parses the csv file, converts the data into javascript objects that are convenient for presentation, and adds additional information — for example, the number of victories, draws and defeats after each round.
Using
- Connect styles to the
head:<link rel="stylesheet" type="text/css" href="cdn.jsdelivr.net/replay-table/latest/replay-table.css"> - Add the script to the end of the
body:<script type="text/javascript" src="//cdn.jsdelivr.net/replay-table/latest/replay-table.min.js"></script> - Place a
divon the page with the classreplayTableand a link to the csv file in thedata-csvattribute:<div class="replayTable" data-csv="https://s3-us-west-2.amazonaws.com/replay-table/csv/football/england/premier-league/2015-2016.csv" data-table-name="Premier League" data-input-type="listOfMatches" data-item-name="Team" data-use-rounds-numbers="true" </div>
Done:
Customization
The attentive reader has already noticed the
data- attributes. With their help, the table adapts to different sports, localizes and changes the appearance. Detailed documentation is on Gitkhab .I tried to make it so that the script could be used for as many sports as possible without elaboration. There are examples on the tables website along with the source code:
- Formula 1 , where there are no match results.
- NBA , where the number of points is important, not the number of points.
- Sports version of "What? Where? When? ” With a table in Russian.
License
Use spreadsheets on any sites, including commercial ones.
→ Code on Github .
Thank you Dasha for the beauty.
Update. The script has grown into a full-fledged library .
Source: https://habr.com/ru/post/318558/
All Articles