The operating temperature range of the Raspberry Pi. Test results
Formulation of the problem
The popular single-board computer Raspberry Pi is used in various industrial applications [3] and is finding new applications. The network has quite a lot of information on evaluating and comparing system performance [4], but industrial customers want to know the range of operating temperatures. The manufacturer does not provide such information. Tests undertaken by enthusiasts for external factors [5, 6] solve several other problems.
The aim of our study was to assess the operating temperature range of the Raspberry Pi single board computer. Raspberry Pi 3 Model B and Raspberry Pi 2 Model B were tested. During the preparation of the article, a new version of the Raspberry Pi 2 Model B V1.2 with a BCM2837 processor appeared, we tested the RPi 2 V1.1 with a BCM2836 processor.
Studies conducted by staff and students of MSTU. Bauman on the order of RS Components Russia, which provided free samples for testing, during the summer internship 2016 in Sovtest ATE [13].
')
Experimental Conditions
Most components on the Raspberry Pi 3 Model B and Raspberry Pi 2 Model B boards have an industrial temperature range of -40 ... + 85. It is of practical interest to test the boards in a wider temperature range from -55 to + 110 and assess the limits of their performance.
The experimental setup is shown in Fig. 1. Single-board computers Raspberry Pi were placed in the heat-cold chamber TCT-811. RPi 2 connected to the LP-Link TL-WR720N router via Ethernet, and RPi 3 - via Wi-Fi. The board was powered via USB adapters. Management of boards and data collection was carried out through SSH access from the operator’s computer.
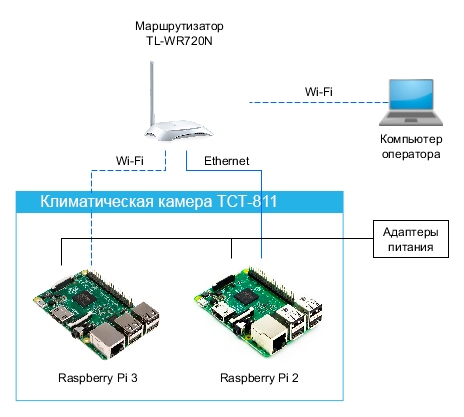
Figure 1. Diagram of experimental installation of temperature testing
As an operating system, Raspbian was used as the main recommended and supported by the manufacturer. Performance testing was carried out using the SysBench utility, a modular, cross-platform, multi-threaded application that allows you to quickly evaluate system parameters for high load operation. These tests were recorded on the internal memory of the board, and then copied to the operator’s computer upon request. The QUMO 32GB Class 10 SD card was used as the data carrier.
The course of the experiment
The test was carried out as follows. The boards were placed in the chamber and connected according to the diagram in fig. 1. Then the algorithm for changing the temperature in the chamber was set. The camera was programmed for a stepwise temperature rise, first from room + 23 to + 110, then for rapid cooling to room temperature and a further stepwise decrease in temperature to -50 (Fig. 2). A total of 19 measurement steps were implemented with a temperature step between the stages of 10 (Table 1).
| Test phase number | one | 2 | 3 | four | five | 6 | 7 | eight | 9 | ten | eleven | 12 | 13 | 14 | 15 | sixteen | 17 | 18 | nineteen |
| The temperature in the chamber at the stage, ℃ | +23 | +30 | +40 | +50 | +60 | +70 | +80 | +90 | +100 | +110 | +106 | +27 | -20 | -25 | -thirty | -35 | -40 | -45 | -50 |
At each stage of testing in the chamber, the appropriate temperature was first set, then the boards were kept at this temperature in the off state for about 6 minutes. Then, the boards turned on almost simultaneously, a Sysbench test was run on each one, and the processor temperature was measured additionally. After the tests were completed, the boards were turned off and re-kept for 1-2 minutes at the same temperature, before the camera proceeded to the next stage. The rate of temperature change between stages was approximately 1 ℃ / min.
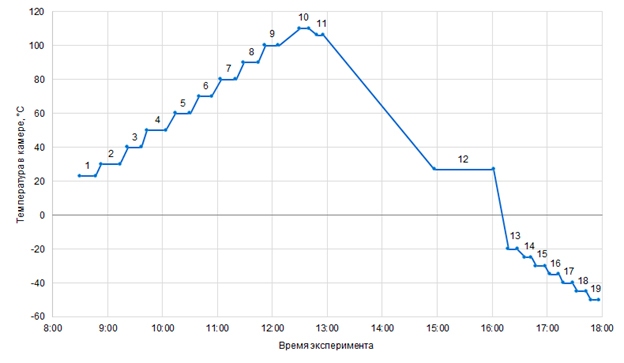
Figure 2. Chamber temperature variation during testing.
Each complete stage of the Sysbench test consisted of the sequential launch of three modules: a processor test, a memory test and a thread test. The result of each Sysbench module was the determination of its execution time in seconds. We describe in more detail each of the tests.
Processor Test (--test = cpu) Sysbench uses 64-bit integers to calculate primes up to the value specified by the --cpu-max-primes parameter. It is also possible to set several streams, but we used the default value - one stream.
A memory test (--test = threads) allocates a memory buffer and performs read or write operations. The amount of data read or written in one operation is determined by the size of the pointer 32 or 64 bits. The process is repeated until the specified volume has been processed (- memory-total-size) . It is possible to set the number of threads (--num-threads) , the buffer size (--memory-block-size) and the type of operation (read or write --memory-oper = [read | write] ).
The test of threads (--test = memory) checks the operation of the processor in the conditions of a large number of competing threads. The test is to create multiple threads (--num-threads) and several mutexes (--thread-locks) . Then each thread starts generating requests that block the mutex, perform processor tasks (to simulate real work), and unlock the mutex. For each request, execution-unlock-execute actions are performed several times, the number of which is specified by the --thread-yields parameter.
The abbreviated text of the bash-script for launching Sysbench modules with the corresponding parameters is shown below:
for count in {1..5}
do
sysbench - test = cpu - cpu -max-prime = 1150 run
sysbench - test = memory - memory -block-size = 1M - memory-total-size = 10G run
sysbench --num-threads = 64 --test = threads --thread-yields = 1000 --thread-locks = 8 run
vcgencmd measure_temp
done
The CPU temperature values in degrees Celsius were derived from its built-in sensor. The readings of the built-in temperature sensor were carried out using the vcgencmd measure_temp command .
Experimental results
The results of the Sysbench tests are shown in Figure 3. At each stage, the Sysbench test was repeated sequentially 5 times, the performance data averaged over the results of 5 tests. The temperatures of the processor are taken from the maximum measured at each stage.
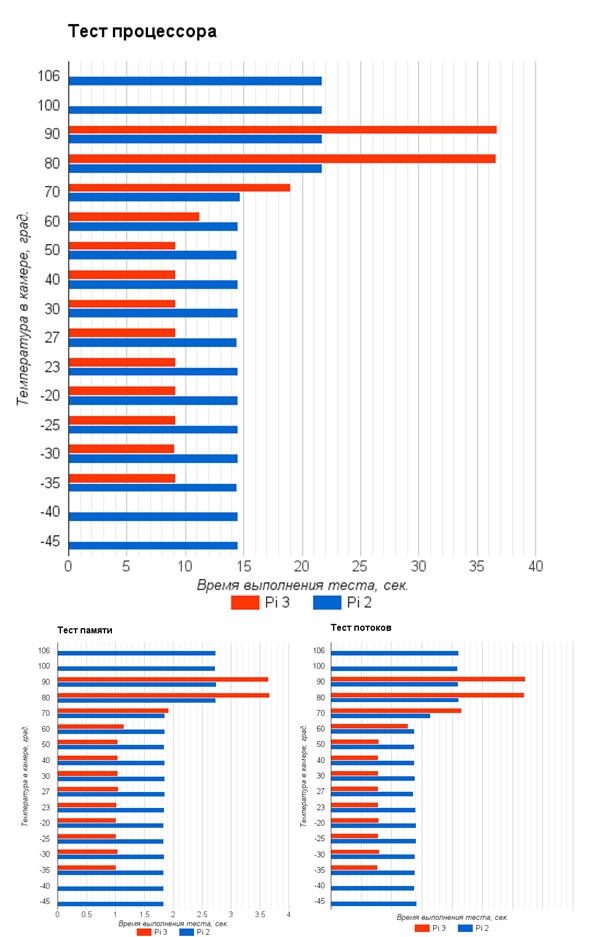
Figure 3. Sysbench test results on Raspberry Pi 3 and Raspberry Pi 2 single-board computers
In Figure 3 it can be seen that the performance picture on all three tests is almost the same for both the RPi 3 and the RPi 2. In the temperature range from -35 to + 50, the RPi 3 board works about 1.6 times faster than the RPi 2, which is consistent with the results of official benchmarks [4]. When the processor reaches the thermal threshold specified in the configuration files, by default it is + 85 ℃, the processor's protection mechanism against overheating is triggered by skipping machine cycles — throttling cycles or throttling [8].
Computers stopped running at different temperatures: RPi 3 at temperatures above + 90, and RPi 2 - at temperatures above + 106. At temperatures below 0 ℃, the performance of both boards does not change. At temperatures below -35, the RPi 3 board and temperatures below -45, the RPi 2 board stops running. Both at high and at low temperatures, the boards resumed their performance after the load was removed - and returned to the operating temperature range.
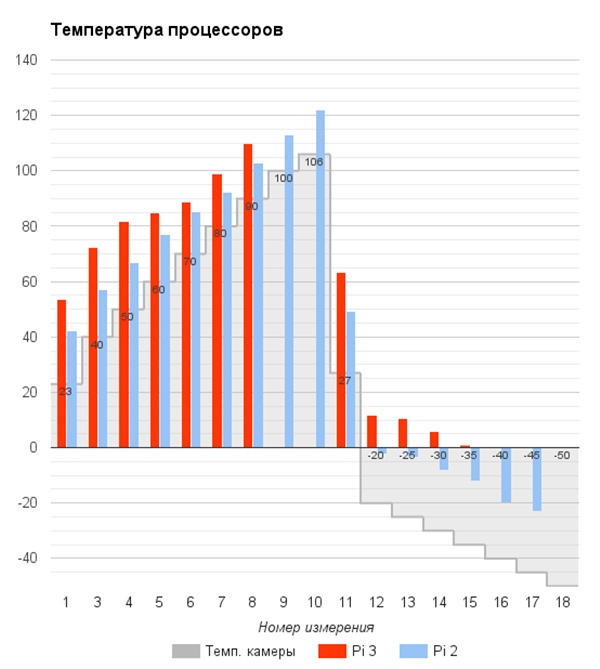
Figure 4. The temperature of the Raspberry Pi 3 and Raspberry Pi 2 processors at different ambient temperatures in the test chamber
The temperatures in the test chamber and the corresponding temperatures of the RPi 2 and RPi 3 processors are shown in Fig. 4. Since the RPi 3 processor is hotter than the RPi 2 processor, the throttling threshold temperature + 85 in it is reached at + 50 environment, RPi 2 launches throttling at + 70. Therefore, in the test results, we see that at temperatures over + 50 RPi 3 is inferior to RPi 2 in performance. At these temperatures, it is recommended to use processor cooling [8].
In the tests carried out, the RPi 3 boards were launched and operated in the temperature range from -35 to + 90, and the RPi 2 boards ranged from -45 to + 106. These ranges are close to the industrial temperature range of used electronic components -40 ... + 85.
Our study does not claim to be complete and unconditional engineering recommendations. The following conditions and circumstances affected its results. First, the problems were caused by SD-memory cards, which often malfunctioned during operation, they had to be reformatted and the system image was re-written to restore the performance of the cards. Secondly, the comparability of test results RPi 2 and RPi 3 could be affected by different ways of communicating with the boards: RPi 2 via Ethernet, and RPi 3 via Wi-Fi. Thirdly, the test parameters were chosen in such a way that the total test time fit into the period of one working day, so we can not judge the preservation of the efficiency of the boards with a longer exposure to temperature. Fourthly, the tests were carried out not in a certified center and not in strict accordance with GOST, although the applied methodology was developed on the basis of standards GOST 28199-89 “The main test methods for external factors. Part 2. Tests. Test A: Cold ”and GOST 28200-89“ Basic test methods for external factors. Part 2. Tests. Test B: Dry Heat. ”
The results of measurements and analysis relate only to the tested samples and cannot be extended to other products of the manufacturer. Test results can not be the basis for decision-making in commercial and legal issues of organizations. At the same time, the authors hope that the results will be useful to the engineering community.
The authors
Daler Arabs, MSTU. Bauman
Pavel Grigoriev, MSTU. Bauman
Pavel Grigoriev, MSTU. Bauman
Literature
1. Sergeeva A., Krivandin S. Single-board computer Raspberry Pi: from textbook to industrial controller. Components and technologies. 2016. №4
2. Ermakov A. Raspberry Pi - an effective tool to reduce costs in the automation of business processes. EMSUP 2016.№1
3. Application of Raspberry Pi and Arduino in an industrial environment
4. Testing Raspberry Pi 3
5. Thermo Raspberry Pi 3
6. Fresh Frozen Raspberry Pi
7. CPU throttling or why performance drops
8. The Raspberry Pi 3 Does Not Halt and Catch Fire
9. Internship at Sovtest
Source: https://habr.com/ru/post/318486/
All Articles