The system of tracking the degree of icy streets: machine learning + Microsoft Azure + Android
Hello to all! Every winter in the Russian (and not only) cities appears harmful ice. A lot of people slip and injure various parts of the body. You will say that this problem should be solved by public utilities - yes, it is, but they often do not understand the state of the sidewalks and yard paths, and maybe they just do not know where to look. In order to somehow improve the situation, modern technologies should increasingly be included in the solution of the problem. A possible improvement is an application in which people can determine for themselves the safest route from point A to point B by looking at an ice map. So, today we will talk about creating a system for assessing the degree of icy streets, based on statistics of people's falls. Under the cut machine learning, clouds and mobile applications.
Where else could be useful?
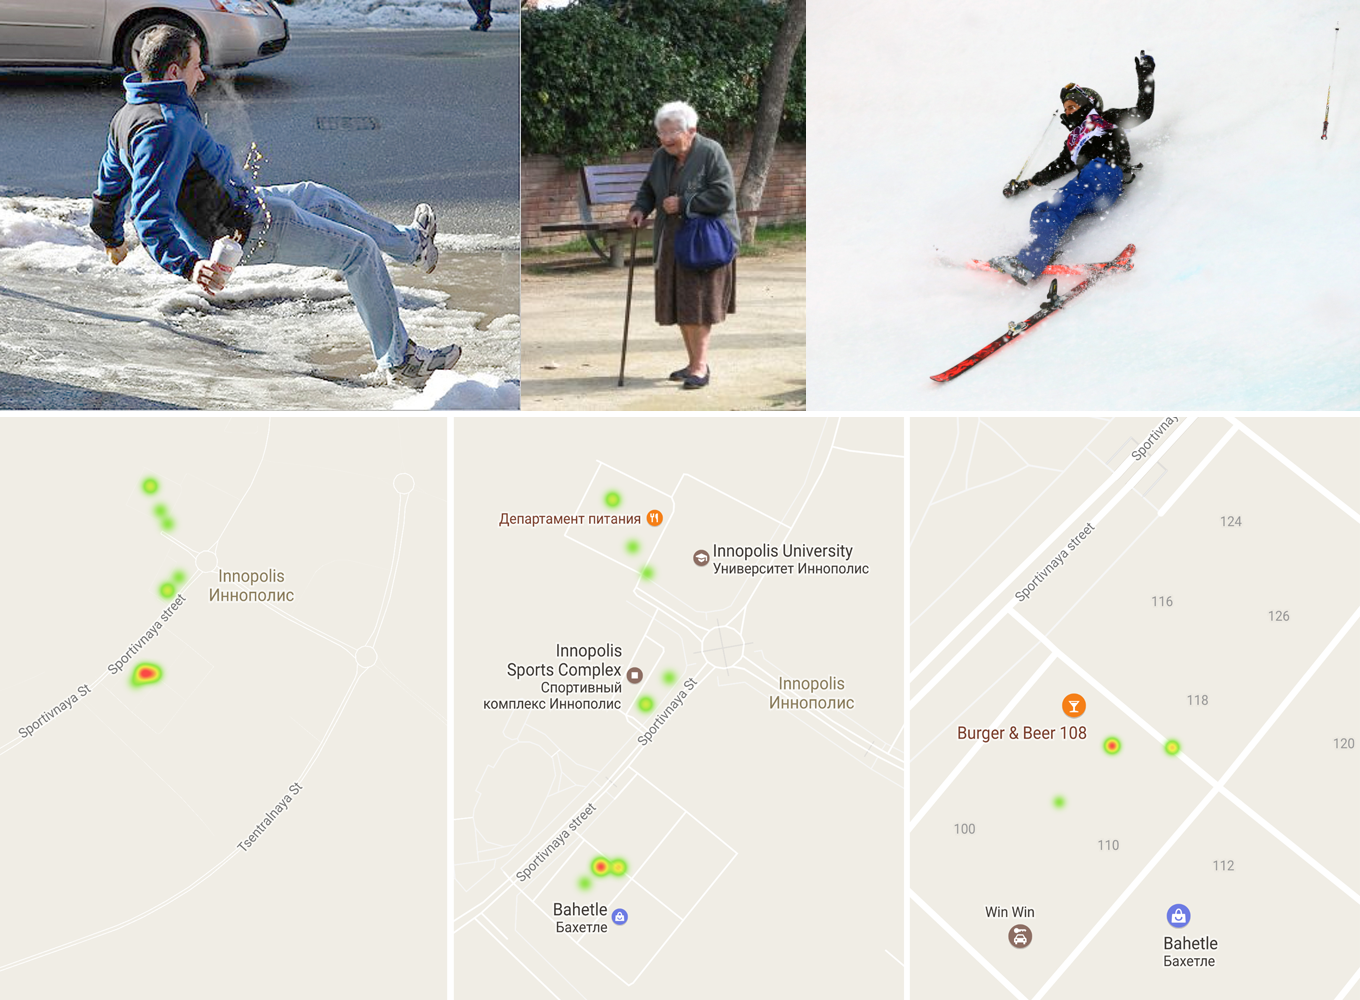
Let me name two more applications of the future system (with the necessary changes). In addition to the falls, considered globally in an urban environment, we want to monitor the condition of our loved ones (especially the elderly). Here, information about the fall (heart attack, loss of consciousness, etc.) and the immediate notification of relatives will allow you to react as quickly as possible and call an ambulance for your grandmother / grandfather, not being directly next to them.
Another useful application would be getting the trainer information about the fall of his athletes on long runs: skiers, runners, etc. All three hallucinations useful in the opinion of the author of the case are shown in the picture above for a more complete understanding of the problems. The author also presents an analysis of the implementation of the system for the urban case and calls it Sleet Monitor. The system will be implemented in a bundle of mobile Android applications and the cloud component. At once I will say that all the code is in the repository on GitHub
What is the difficulty?
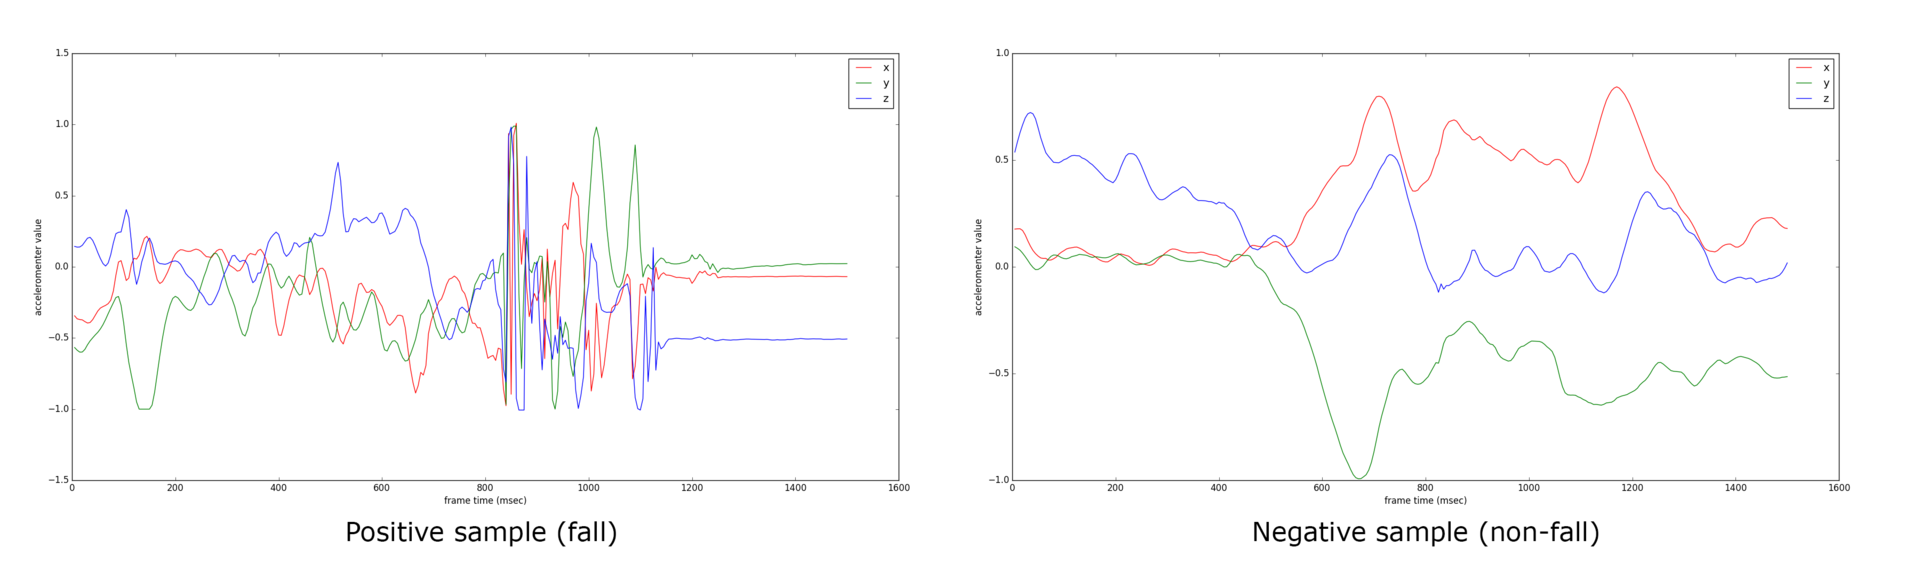
First of all, it is necessary to solve the problem of determining the fact of a fall. The filling of the system will be represented by the fall classifier. The complexity of its construction is mainly in the data that we get from smartphones. Data is the accelerometer readings on three axes, collected continuously. The picture below shows two examples of one and a half second frames: the left one corresponds to a fall, the right one - not to a fall.
Due to the different characteristics of smartphones, the data may be sparse, and the time resolution is not constant for the same device (the operating system for some reason does not return data with the same frequency on many devices). Also the direction of the accelerometer axes can vary from device to device. A plus to the above will be the problem of “freezing” the application (in the locked mode, the OS may very rarely give accelerometer readings, and may unexpectedly bring a whole wad of data).
Currently, the first and partially the last problem is solved by using data interpolation. Due to the listed difficulties and the fact that it is difficult to develop a classifier of falls based on some heuristics, the glance fell on machine learning approaches.
Data collection
 To teach a car something, you need to show it something, and it is even better to point out what is good and what is bad. To collect the data, a separate Android application was written that collects accelerometer readings as often as possible and writes them to a file. The frame size does not exceed 1.5 seconds (the author suggested that the average person falls during this period of time).
The data is a string of the following format: time_offset: x_value y_value z_value ... time_offset: x_value y_value z_value is_fall . Accelerometer readings are normalized to the maximum possible value for a particular type of accelerometer. The number of tuples (time_offset, x_value, y_value, z_value) per line depends on the frequency of data provided by the operating system. Here it is worth noting that the entire sample was collected on a LG Nexus 5 smartphone, which gives stable data every 5 ms with a non-locked screen. Thus, in 1.5 seconds we have 300 data tuples with a time stamp.
All data had to be collected by independent falls with the help of his friend Dmitry Kruchinin. Thus, the collected data is based on a sample of the falls of two people. All collected data (dirty and cleaned) are in the ml/data directory in the repository.
In the application interface, you can specify what is being recorded at the moment - a fall or not a fall. There is also a system to get rid of incorrect data - buttons 1 , 2 , 3 are designed to add Label1 , Label2 , Label3 tags to the end of the file, signaling that the last measurements in Label3 1, 2 or 3 are incorrect. In the future, the researcher will delete this data from the file. There is also a separate GOOD tag, which a person can put to say that all previous measurements are guaranteed to be correct.
There are also Falls and Non-Falls fields on the screen, corresponding to the number of recorded measurements in this session of the application for each type of state. When a new application is launched, the system will write the DataWriter was initialized line to the file, which will allow the researcher to see the new session of the application and, in case of errors in the data, narrow the search to remove them.
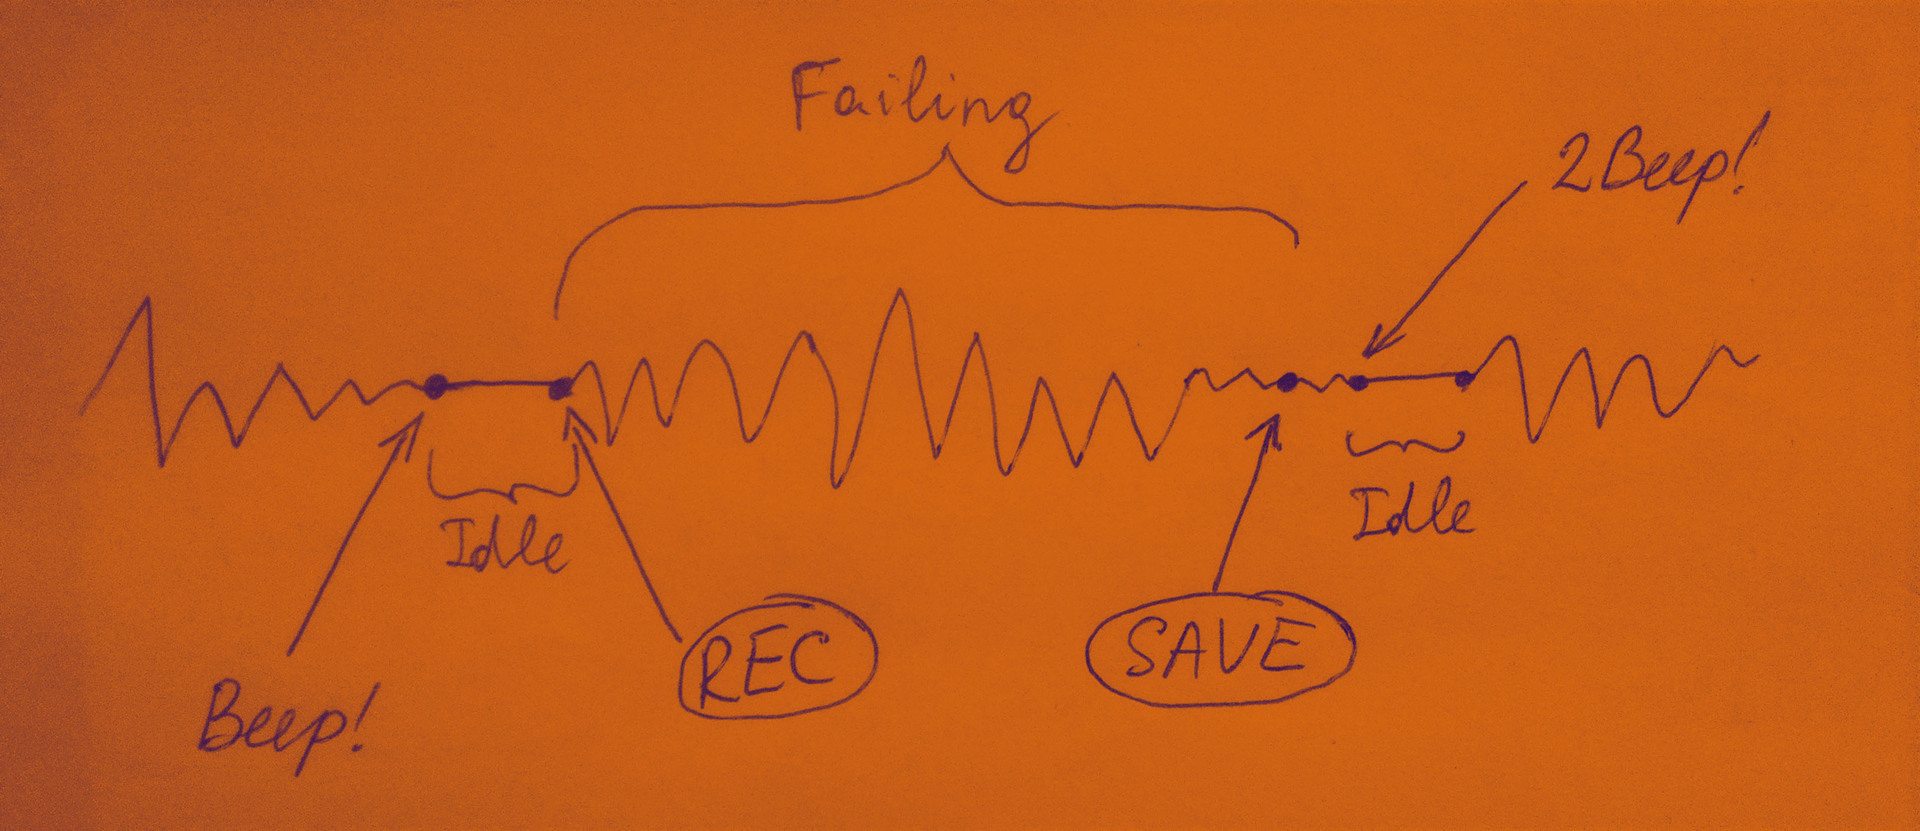
Here it is also worth noting the interface with sound signals in the application. It was designed specifically to collect positive (falling) examples. When a person makes a fall, he cannot get a smartphone out of his pocket to stop or start recording, because in this case the data will be corrupted (do not correspond to reality). The picture below explains how the interface works with audio signals.
')
After pressing the PLAY button, the system waits for the vibrations of the smartphone to become insignificant - a person holds the phone in his hand, or puts it in his pocket before recording. As soon as the oscillations become insignificant, the system realizes that the person is ready to record, and it is also ready - a short Beep sound comes out. Next comes the state of Idle (idleness), which lasts until the person starts to move, or starts to sway the smartphone in his hand. Then the system starts recording data (in the figure, this stage is called Failing ). The recording takes 1.5 seconds and ends with a long Beep signal (the system has written data to a file). While the person is lying, he does not move (again the stage is Idle ). As soon as the person began to move, and with it the smartphone in his pocket, the system understands that the person rises. From this moment the cycle repeats. For recording not falling, everything works exactly the same.
Architecture
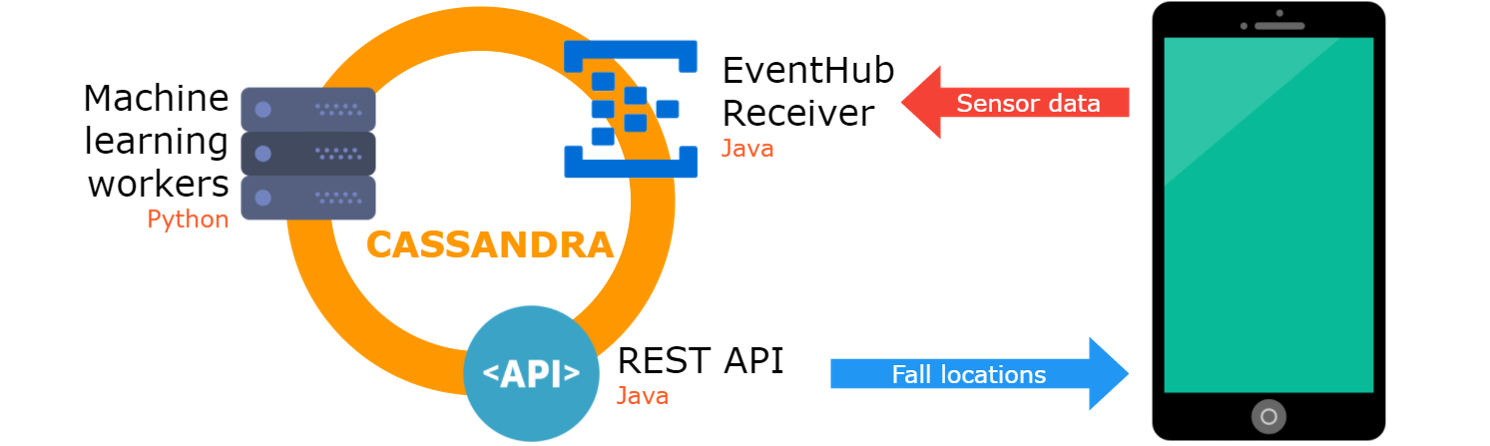
Since the system is based on statistical data from a multitude of users, it requires air support for the central system that processes the data. It consists of several machines and services deployed in the Microsoft Azure cloud, which are divided into three types according to their tasks:
- Receive data from a smartphone
- Fall Detection
- REST API for getting ice map of streets
All machines are in the same network and “communicate” through the Apache Cassandra database. This NoSQL DBMS was chosen due to its main feature - it works efficiently with a large data stream coming in real time from multiple devices. Immediately here it is worth mentioning the design of the database. The database has two tables with the following schemes:
sensor_data(user_id: varchar, x: float, y: float, z: float, lat: double, lon: double, timestamp: bigint, fall_status: int). All tuples of data coming from Android devices are stored here. Why do we keep everything? It is believed that these data may be useful in the future, for example, to train any algorithm without a teacher. The physical storage of rows in this table is arranged in descending order of thetimestampvalue so that you can work effectively with more recent tuples of data.update_info(user_id: varchar, is_updated: boolean). This table is only needed in order for the detector application to determine from which users the new data came. Added not to look for fresh records for each user in a large tablesensor_data, but to immediately know who has the updates.
The picture shows the complete system architecture, followed by a more detailed description of each component.
Currently, Microsoft Azure has deployed one Linux machine with the DataStax Enterprise package, which includes the pre-installed Apache Cassandra. Machine features: 4-core 2.4 GHz Intel Xeon E5-2673 v3 (Haswell), 14 GB RAM, 200 GB SSD. The author rents a car for the funds received monthly under the Microsoft Bizspark program.
Receive data from a smartphone
For sending and receiving data from a smartphone, Azure Event Hub was used, specifically designed for a large flow of short messages. On the server side there is a machine running a Java application that reads data from the Event Hub’s queue and writes it to the Cassandra database.
Data is presented in JSON format. Each message from the client contains accelerometer readings, timestamps, and GPS coordinates for all measurements taken within 1 minute.
If you are going to implement the Azure Event Hub sender on Android, then the author can advise you to immediately look at the HTTPS API, since there is no Android (or the author could not find) a suitable implementation of the AMQP protocol that is used by all Azure Event Hub SDK.
Fall Detector
To handle the flow of data from users in the cloud running a machine with a Python application. Why choose Python? Just because machine learning studies were conducted in Python using the scikit-learn library, and rewriting the application using other technologies just to run it on the server at this stage was superfluous.

The fall detector works on the principle of a sliding window (eng. - sliding window). The window slides over the interpolated data (yes, each piece of fresh data taken from the base is interpolated due to the problem described at the beginning) and starts the classifier to determine if it has fallen. The decision of the classifier 1 (fall) or -1 (not fall) is written back to the database for the first extracted tuple in the examined piece of data. Naturally, this whole procedure is performed independently for each user, which is determined by the user_id in the table.
Classifier
We should also talk about the classifier. It is based on the classical (without using neural networks) machine learning algorithm. The quality of classification is evaluated by the F1-score metric. The following was in the study field:
- Machine learning algorithm and its parameters . Candidates for the title of the best fall classifier were exposed to the Random Forest Classifier, Support Vector Classification / Regression and Linear Regression. After several launches, it was revealed that the Random Forest Classifier with the number of trees 10 and the other default parameters ( set by scikit-learn) shows the best results.
- Dataset . Here varied test and training samples according to the ratio of <number of positives>: <number of negatives> and the set of negatives themselves changed. The final training sample of negatives includes examples of simple movements of the smartphone in the air, walking around the room, throwing, as well as examples in which the classifier gave false positives in combat conditions (that is, when the entire system cycle was implemented and the author intentionally walked around the room and jumping without falling). Total dataset was 84 positive examples and 400 negative. Of these, 80% of random examples were assigned for training, the remaining 20% for testing.
- Accelerometer axis set . Studies have shown that the set of axes
{x, z}gives the best results in the classification, which also has a positive effect on the reduction of user's Internet traffic. But here it is worth making a reservation. The fact is that the data of the falls were collected by the author with the smartphone in a constant position in the pocket with its upper part down. This direction corresponds to the direction ofyon the LG Nexus 5. The algorithm retrained on the data along theyaxis, and despite the fact that it showed good results on the test sample, under combat conditions, it gave a lot of false positives by simply turning the smartphone "upside down ". This problem can be solved by creating a more representative sample. But at the moment, the result with only two axes is very good. - Interpolation parameters As mentioned earlier, due to the large zoo of devices on Android, you have to work with sparse data. This is where linear interpolation helps. And since we take on interpolation, it would be nice to try to reduce the data resolution to reduce Internet traffic from the user and to reduce the server load on the fall detection. Let me remind you that the base dataset contains one and a half second data frames divided into 300 tuples
(x, y, z, timestamp)(one tuple of 5 ms). When the resolution is reduced to one tuple of 50 ms, a still acceptable classification quality is observed, but the data volume is reduced 10 times!
The total F1-score maximum for several training eras with all the specified best parameters and taking into account the intentional dilution of data is 10 times at the level of ~ 90%. Without dilution - ~ 95%.
The amount of data sent from an Android application in a binary representation is small. In fact, 2(- ) * 4 ( ) + 4 ( timestamp) + 8 ( ) = 20 is the size of one data tuple. 1000 / 50 = 20 - the maximum number of tuples per second. 20 * 20 = 400 per second. Further 400 * 60 * 60 * 24 * 30 = 1 036 800 000 or ~980 per month. This is provided that the user walks 24 hours a day, and the application continuously sends data. But in reality, on average, the user spends no more than a third of the day on the move. Given this rough assumption, we get a traffic load in the region of 300 MB, which can be considered very adequate.
REST API and mapping points on the map
To obtain updates by all users of the Sleet Monitor application about the degree of icy streets, a simple Java REST API was written using the spark-java library. The application refers all to the same Cassandra database and gets the fresh coordinates of those points for which the value fall_status = 1 (a fall was detected at this place). In an amicable way, here you can do some data cleaning, like checking for the coincidence of coordinates of several points. At the moment, without additional processing, the coordinates are added to the R-Tree to quickly search the rectangular area that comes in the request from the client.
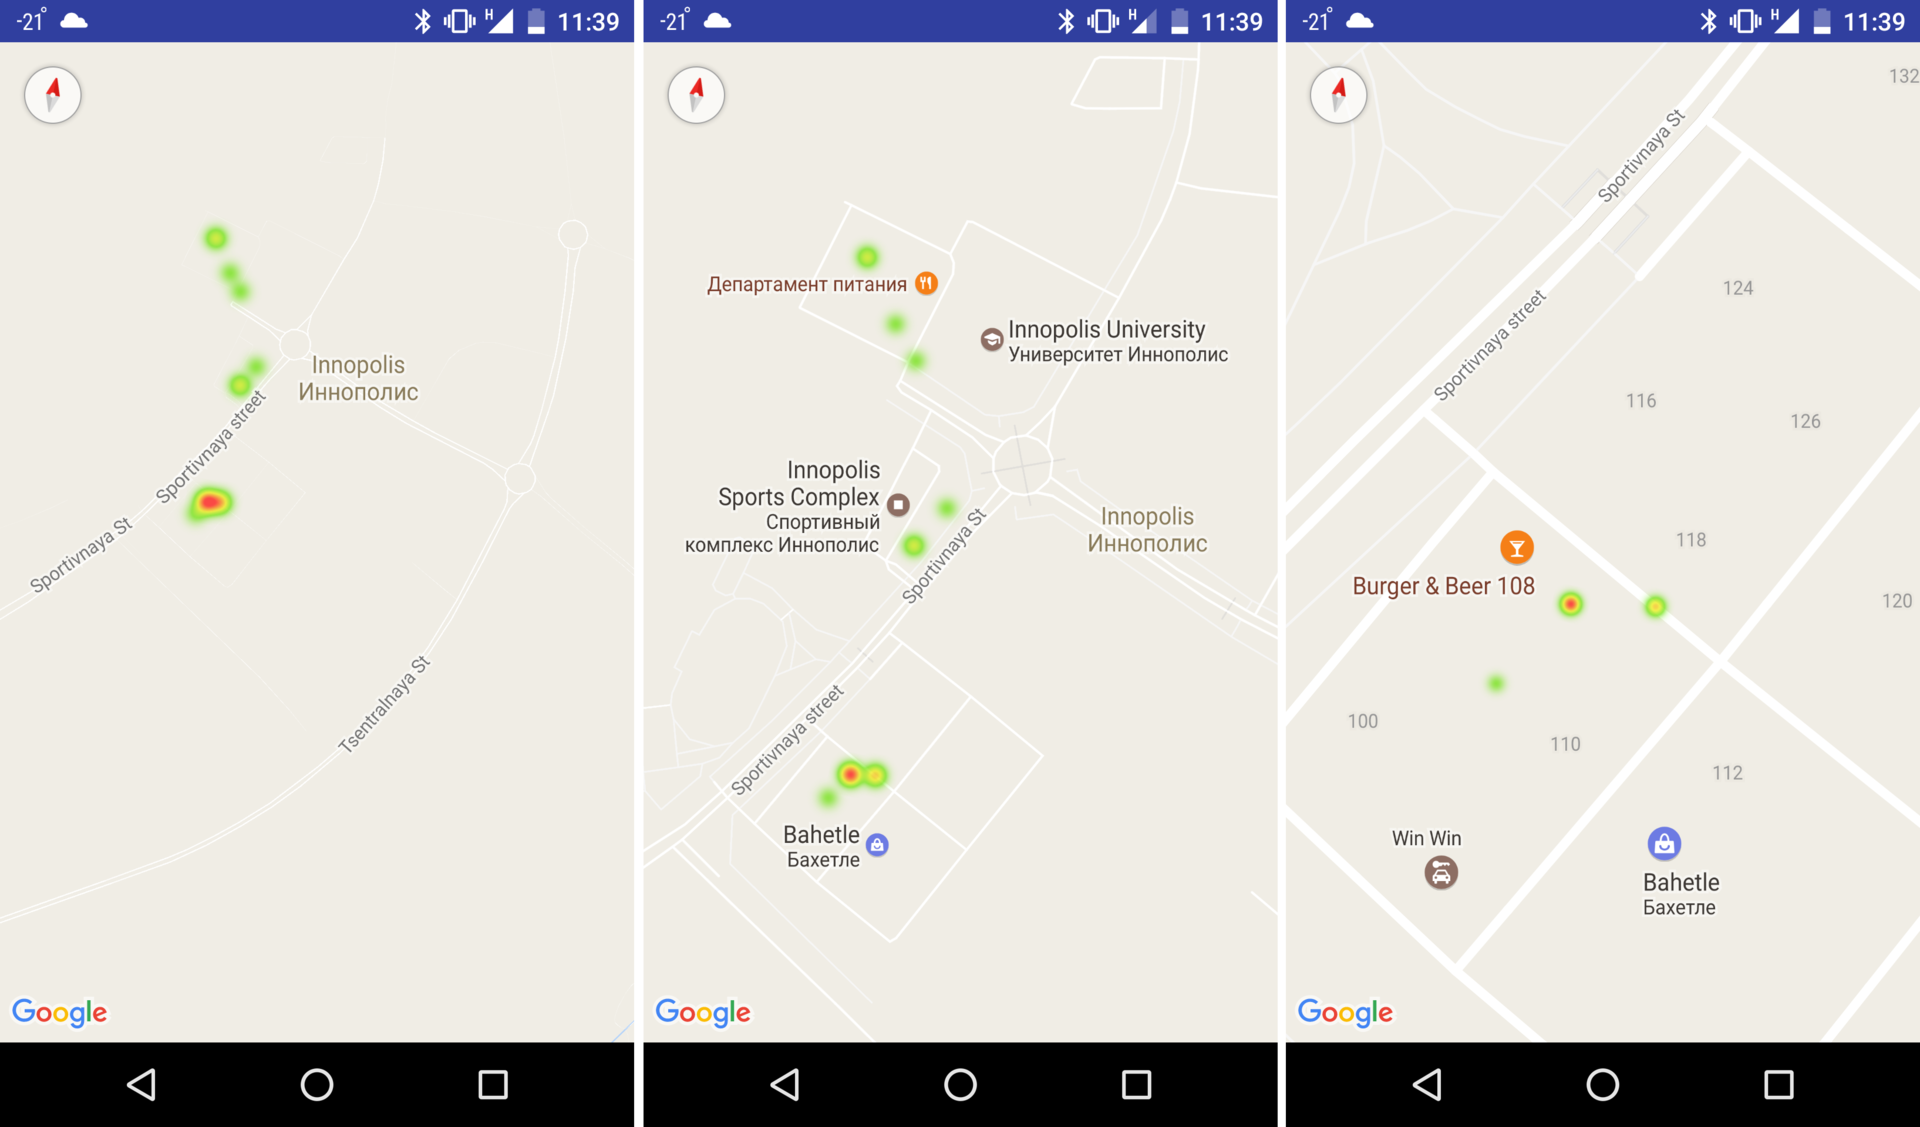
To display the points on the map, my friend Cooper Bogdan implemented the principle of heat map, borrowed from the Google example for Android. The principle is that when the map is zoomed up, the drawn points collapse so that, where the density of the points in the neighborhood is greater, the larger the spot on the map looks.
The figure below shows an example of the drawn drop points. These are real falls, "attacked" by the author in the snow specifically to demonstrate the operation of the system. In the red areas, the author intentionally fell several times to show that the crash classifier works well, and there were no false alarms during the recording, while the recording was made continuously with the same street walk speed.
Conclusion
So, a slight improvement in the urban life of people is possible. The system of tracking people falls is implemented. Naturally, there can and should be done many optimizations to reduce both the server load and the load on the user's Internet traffic — to train the model directly on more sparse data, thereby reducing the computational cost of the crash detector; increase the pitch of the running window in the detector; to reduce the traffic to transfer data from the Android device in binary form, and not as it is now in JSON; and etc.
Improvements can always be made, many of them are trivial, and at the same time they can bring a significant reduction in costs both for the server part and for user traffic. The goal of the development was to gain experience in launching a complete pipeline, including a mobile application and a high-loaded server part, processing a huge data flow in real time. But in order to launch this system in real conditions, you need to significantly expand the fleet of machines in the cloud and distribute the mobile application with the achievement of a high concentration of users in at least one city. And with monetization, nothing is clear yet.
Anticipating this problem at the stage of conceiving an idea, it was immediately decided to make the project open. Let me remind you, all the code is in the repository on GitHub . The goal of writing a debut for the author of an article on Habrahabr was not only to talk about the experience gained in building such systems, but also to get some feedback from the community. Therefore, comments are very welcome, as well as suggestions for further development of the system. Thanks for attention.
Source: https://habr.com/ru/post/318470/
All Articles