Comparison of monitoring systems: Shinken vs Sensu vs Icinga 2 vs Zabbix
Shinken
According to the official website, Shinken is a monitoring framework; rewritten from scratch on the python Nagios Core, with improved support for larger environments and more flexible.
Scalability
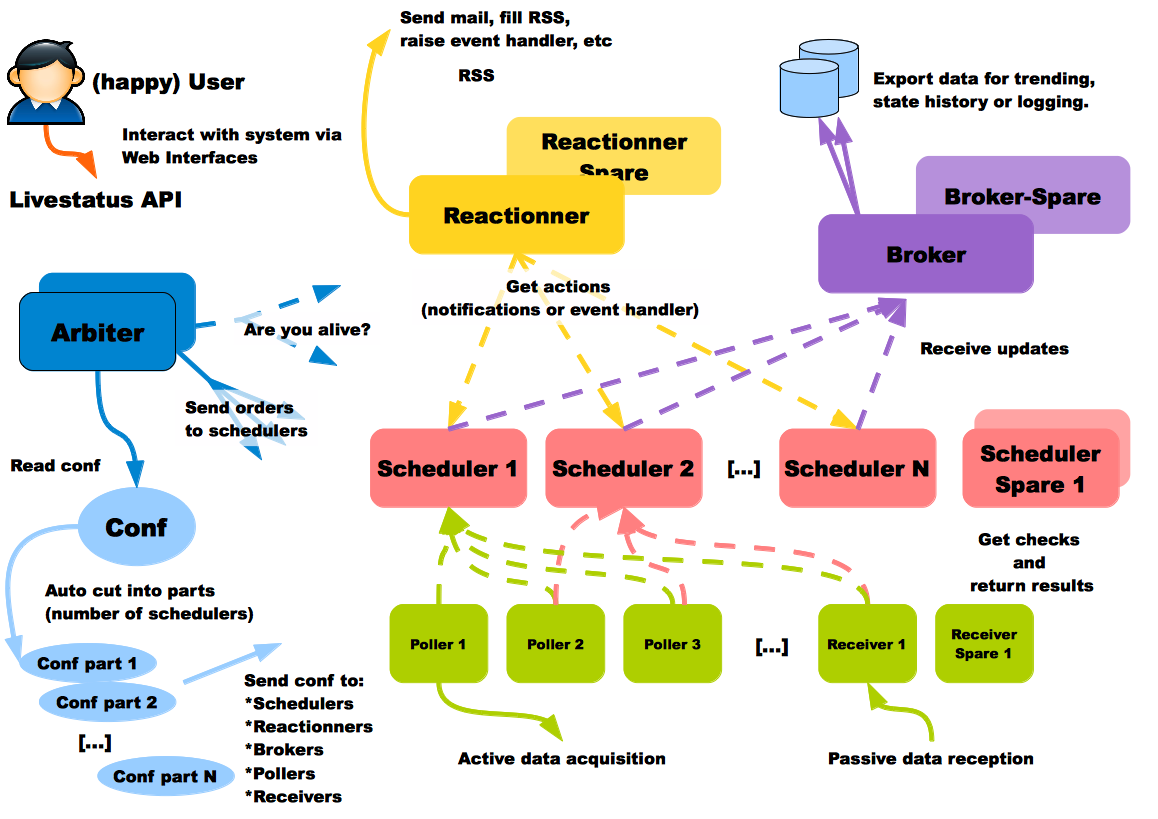
According to the documentation , each type of processes used can be run on a separate host. This is a very useful feature, because you may want to have a database in the cheapest place, processes for collecting information in each data center, and processes for sending notifications closer to your physical location. User Shinken on the diagram is happy, this is definitely a good sign:
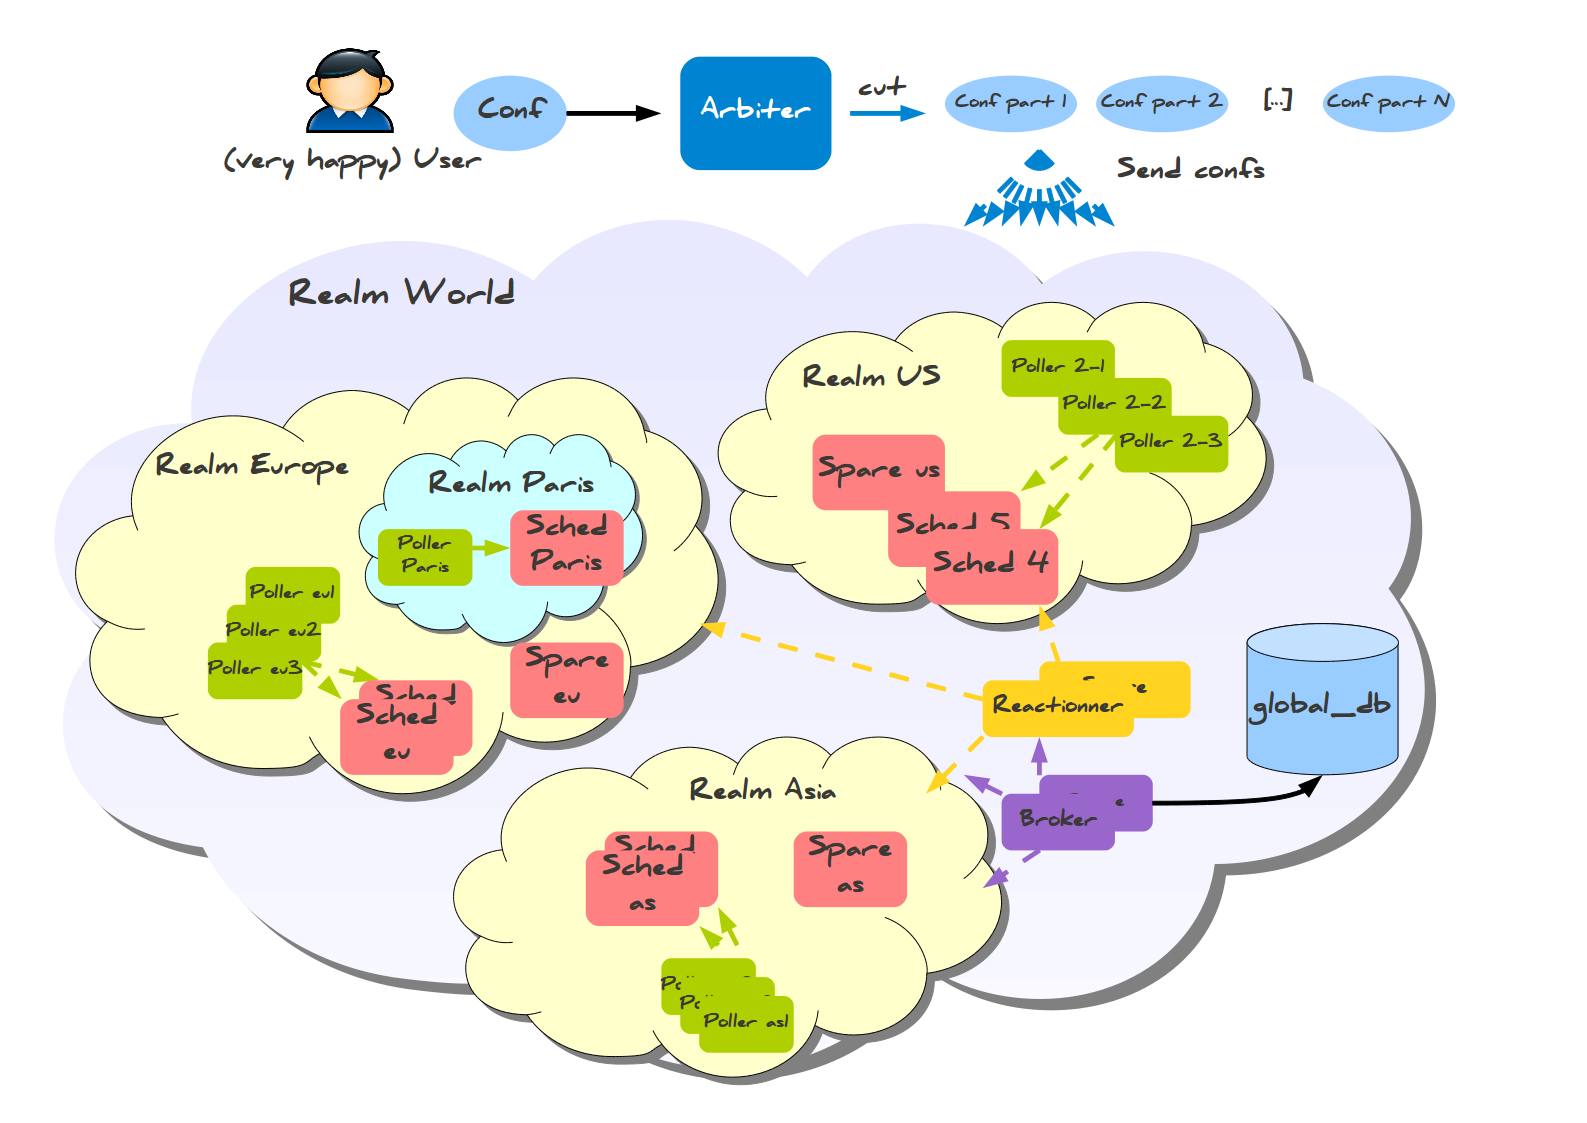
This system also has a ready-made configuration for inter-regional monitoring, called Realms (Spheres).
Here you can notice something amazing: the information is collected in regional databases, and not in one master database. There is also a smaller form of configuration with spheres for smaller distributed configurations, which requires only one database and several hosts for installation:
Failover is another pain point in assessing scalability. I will quote this information from the documentation:
Nobody is perfect. The server can fall, as well as the application, so the administrators have substitutions: they can take the configuration of the fallen elements and re-raise them. Currently, the only process that does not have a substitution is the Arbitrator, but in the future it will be finalized. Armiber regularly checks to see if all other processes are available, and if the scheduler or another process is dead, it sends its configuration to another node defined by the administrator. All processes are notified of this change, so that they can use the new node to access the process, and will not attempt to use the failed one. If the node was lost due to network problems, and returned to operation, the Arbitrator will notice this and ask the replacement node to reset its temporary role.
Integration with configuration management systems
Automatic discovery of hosts and services is well covered by documentation , and since the configuration is stored in files, you can quite easily generate it using Chef \ Puppet, based on information already available in the configuration system (for example, PuppetDB).
Logging actions
Since the configuration is stored in files, you can use existing tools such as a version control system (Git, Mercurial) to track changes and their owners. In the documentation, I did not find any evidence that Shinken records user actions in the web interface.
Ui
Shinken WebUI, according to the assurances of people using it, showed itself well when working with thousands of machines and dozens of groups.
disadvantages
Having gone through the documentation, I did not find any visible flaws. The only thing that confuses me is the rapid development in the past and the very slow rate of commits in the present: about 40 this year, most of them are infusion of pull requests with bugfixes. The system is either too good for further development (which is not the case in nature, even old people like vim and emacs are getting new releases), or now this is another open project with a community that is not large enough or problems with a maintainer is such information that I would like to know before using such a complex thing as a monitoring system.
Frédéric Mohier , who was once on the development team Shinken kindly provided information on this issue: over a year ago, several developers from the team, disagreeing with the development policy, left the project and made a fork, called Alignak , which is currently being actively developed, the first stable release (1.0) is scheduled for December 2016.
Links
Sensu
Sensu is a monitoring framework (or a platform, as they say about themselves), but not a complete monitoring system.
Her strengths include:
- Integration with Puppet \ Chef - determine what to check and where to send notifications directly to your configuration management system
- Using existing technical solutions, where possible, instead of inventing bicycles (Redis, RabbitMQ)
Sensu pulls events from the queue and handles them, that's all. Handlers can send messages, do something on the server, or do anything else you teach them.
Scalability
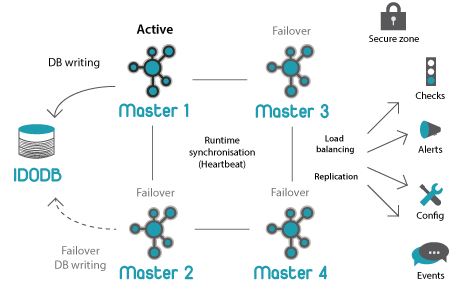
Sensu has a flexible architecture, since each component can be duplicated and replaced in several ways. An example of a simple fault-tolerant system is described in the following presentation ; Here is a general scheme:
With HAProxy and Redis-sentinel you can build a system in which, if there is at least one live machine of each type (Sensu API, Sensu Dashboard, RabbitMQ, Redis), monitoring will continue to work without any manual intervention.
Integration with configuration management systems
Built-in (Puppet, Chef, EC2 ?!) but only in the paid version, which is bad, especially if you have thousands of servers and you don’t want to pay for something that has free analogues.
Logging actions
Built , but only in paid edition.
Ui
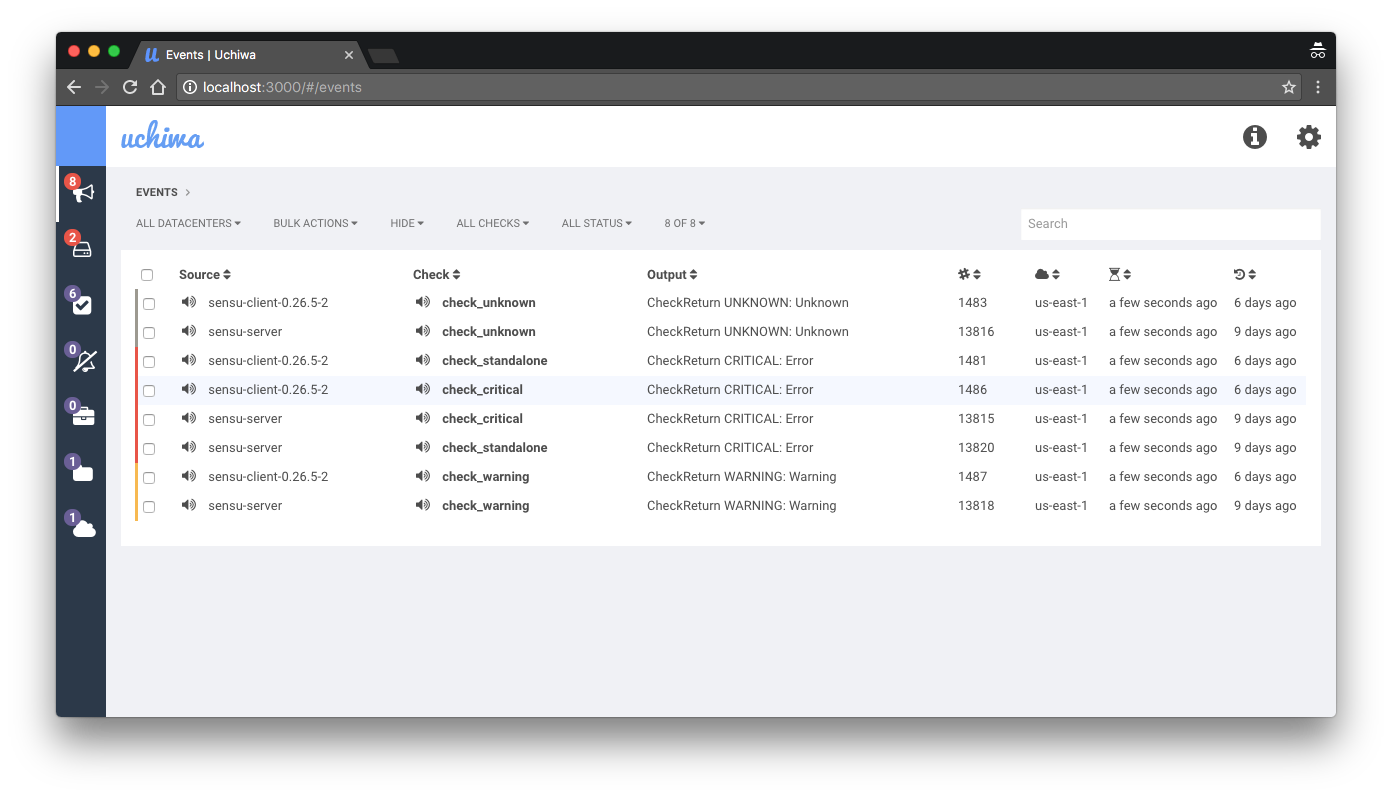
The default interface for Sensu, Uchiwa , has many limitations. It looks too simple for the environment with thousands of hosts that have a wide range of roles. The paid version has its own dashboard, but it is not much different from the free edition, and only adds a few features of the open version that are turned off.
disadvantages
- Lack of historical information and very limited ability to create audits based on it;
- The "do it yourself" approach - there is no ready monitoring that could be enabled for your system immediately after installation;
- Event aggregation is nontrivial;
Wisely sending messages, which is scary (because this is the part of the system that should be the simplest and most reliable)- not true, I got the wrong impression of the documentation , thanks x70b1 for clarification;- The path “we don’t want to reinvent the wheel” has its limitations, which you may be familiar with if you have ever used such systems (in my case, it was the Prometheus monitoring system that left a number of functions to the user, for example, authorization / authentication \ identification).
Links
Icinga 2
Icinga is a fork of Nagios, rewritten from scratch in the second version. Unlike Shinken, this lively, frequently updated project.
Scalability
General architecture:
Icinga 2 has a well-designed distributed monitoring scheme . The only minus that I found when raising a test cluster is a complicated initial setup of even the simplest distributed scheme.
Integration with configuration management systems
The integration is pretty good, here are two presentations on the topic: The Road to Lazy Monitoring with Icinga 2 and Puppet from Tom de Vylder, and Icinga 2 and Puppet: Automated Monitoring from Walter Heck. The key feature of Icinga is to store the configuration in files, which makes it easy to generate the configuration using Puppet, which in my case turned out using PuppetDB as a source of information about all hosts and services.
Logging actions
As I discovered, action logging is presented in the director . There is no built-in support for auditing in IcingaWeb2.
Ui
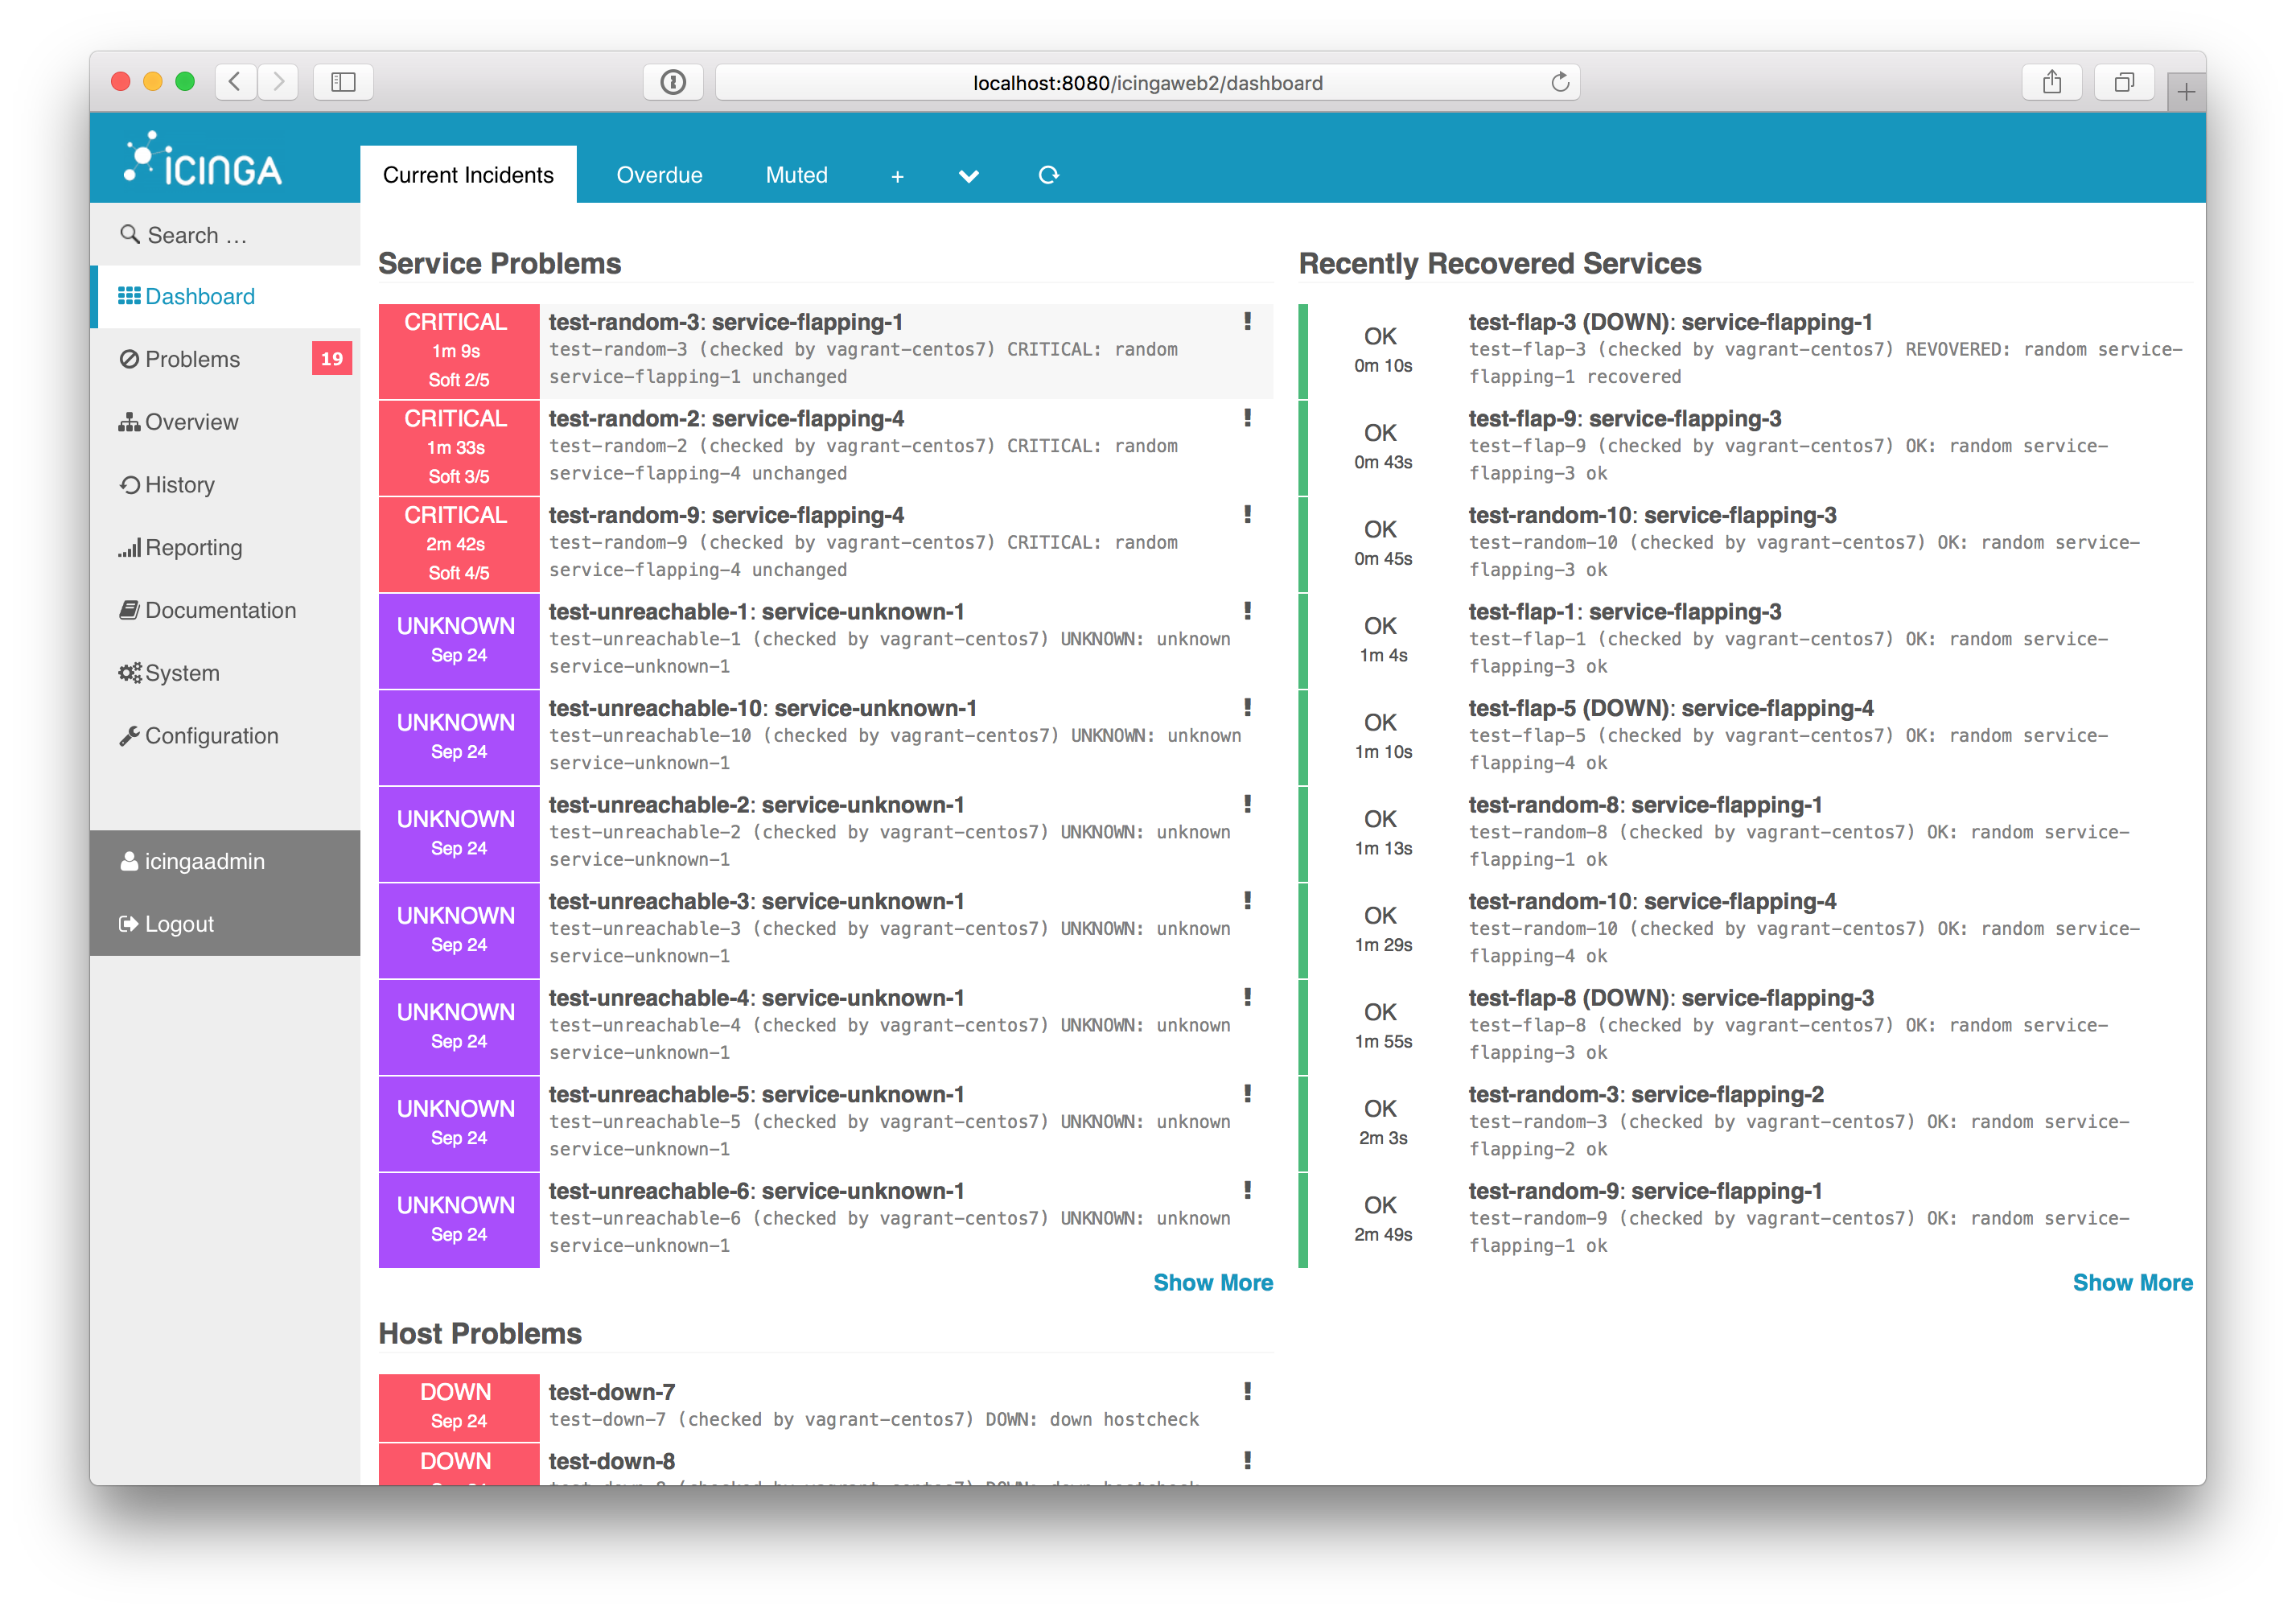
IcingaWeb2 looks like a good UI with a lot of add-ons for different needs. From what I've seen, it looks the most flexible and expandable, while at the same time out of the box supporting all the features you can expect.
disadvantages
The only flaw I have encountered is the complexity of the initial setup. It’s not easy to understand Icing’s view of monitoring, if you used something completely different before, like in my case, Zabbix.
Zabbix
Zabbix is a stable and reliable monitoring system with a steady development rate. It has a huge community of users and most of the questions you ask are already answered somewhere, so you won’t have to worry once again whether this or that is possible in Zabbix.
Scalability
The server works with a single database, and regardless of your actions, with any other resources on your hands (memory, network, CPU), you will at some point rest against the limitations of IO on the disk used by the database. With 6000 IOPS in Amazon, we support about two thousand nvps, new values per second, which is not bad, but still leaves much to be desired. Proxy and database partitioning improves performance, but in terms of resiliency, you still have a single database, which is the point of failure for the entire system.
Integration with configuration management systems
Zabbix is poorly prepared for a diverse environment that is controlled by the configuration management system. It has built-in capabilities for low-level discovery of hosts and services, but they have their limitations and are not tied to the configuration system. The only possibility for such integration is your own solution using the API.
Logging actions
Zabbix logs user actions well, with the exception of one blind spot: changes made through the API are mostly not logged , which may or may not be a problem for you. Another thing I would like to mention is that all the problems with Zabbix are recorded somewhere in the bug tracker, and if they get enough attention from the community, then sooner or later they are eliminated.
Ui
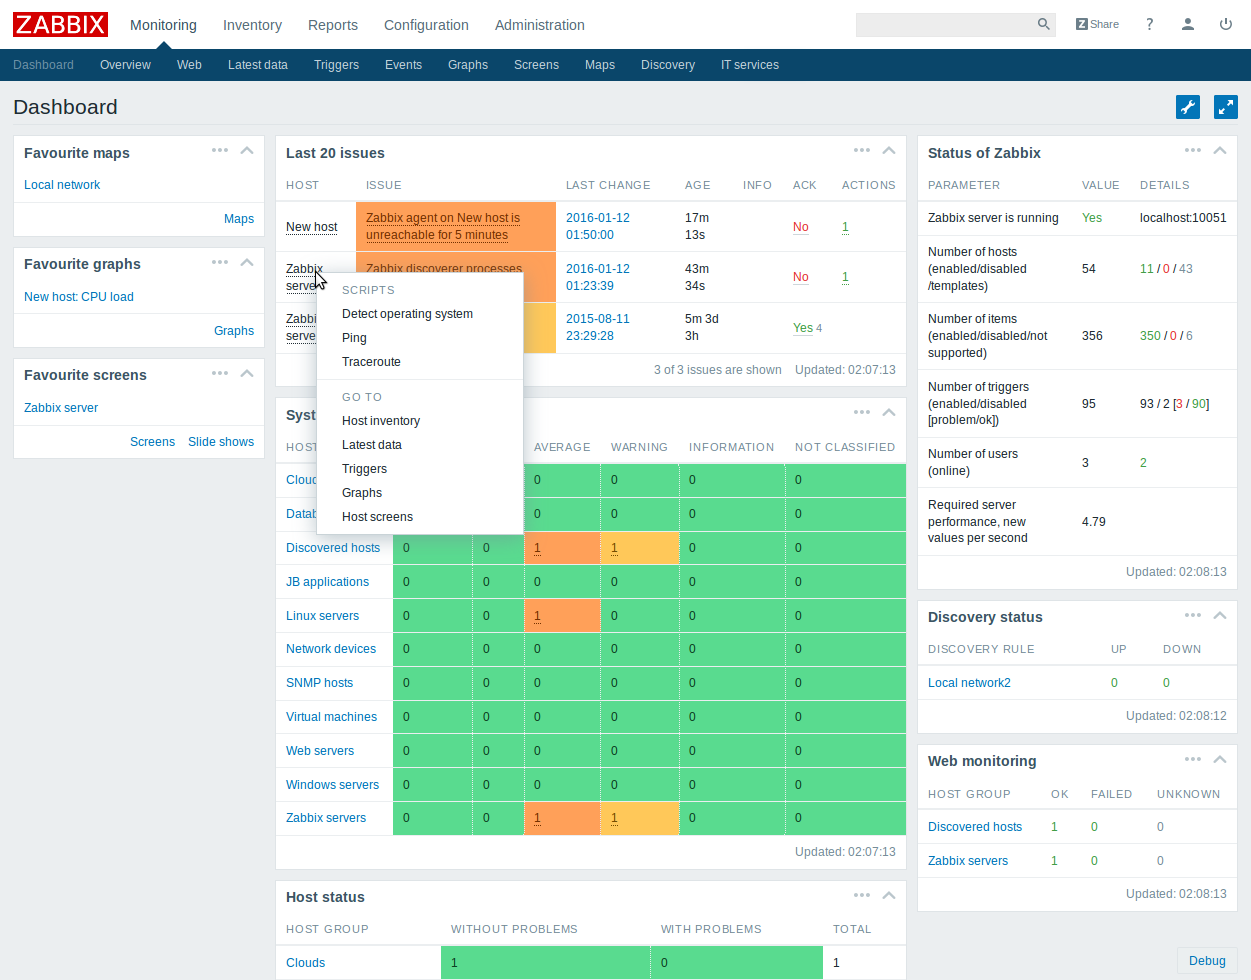
Zabbix's UI is convenient and includes many features. The reverse side - it practically does not expand, you either reconcile with what the standard dashboard offers you, or create your own. Refinement of the standard UI is a very non-trivial task due to its complexity.
disadvantages
- Only basic analytics about what is happening at the moment (not in terms of current problems, but frequencies from the origin and similar information). The situation has greatly improved with the appearance of the “top 100 shooting triggers” in 3.0;
- Setting the planned work (maintenance), in contrast to the systems based on Nagios, can not be set at the trigger level, and was quite complicated before the recent rework 3.2;
- The generation of alerts out of the box leaves much to be desired (which, however, is a problem for every single monitoring system). In our case, we had to develop an external system for the aggregation of alerts (perhaps someday it will be published in the opensource);
- Investigating performance problems without relevant experience becomes a mess, because you have one indivisible server that you need to diagnose.
Disclaimer
This is a long entry with lots of pictures and even more text. Here you will not find a definitive answer to simple questions like "what's better", but the information to answer these questions, based on your experience and desires. I consider the working conditions in Linux and the tracking of Linux-hosts, so the system support for different platforms was not taken into account. Also, the condition was the requirement to monitor thousands of machines and thousands of services.
In my opinion, only Zabbix and Icinga 2 are mature enough to be used in the "Enterprise", the main question that someone who chooses the system should ask themselves is which monitoring philosophy is closer to it, since both of them allow you to get the same result using completely different approaches.
')
Source: https://habr.com/ru/post/318466/
All Articles