Dataset study with IMDB

Problematics
Films are cool, films inspire us, fill us with confidence, generally give us a lot. And so in this article I would like to tell you about the study of trends in modern cinema using data analysis tools, which was already presented in the Science Slam ITMO University 2.0 final. The full issue is available here .
Once at the Kinopoisk I stumbled upon an unfamiliar film. It turned out to be "Green Elephant" - the notorious tape of the VHS era. Those who have heard about him can understand the impressions that I felt after reading the page about this film on Wikipedia ...

But stupid films are a dime a dozen, and should they be given any attention at all? But the rating of this film was abnormally high. And it was very surprising, because as such a frank cinematic "slag" is gaining a rating above the average (for all films).
And here I am, full of skepticism and distrust of the
')
Data first
So, we must begin with the search for data, which we are actually going to analyze. Of course, I didn’t really like to collect data manually, but I wanted to immediately concentrate on analyzing it. Therefore, I immediately began to look for the necessary data on the Internet. Found it in the place where it was worth to look in the first place - on the site kaggle.com . This turned out to be a dataset containing more than 5,000 films from the famous imdb movie site. The characteristic description of each film contained a lot of categorical and material signs, which you can find on the page of the dataset of the page of the dataset .
But since I was originally interested in the Kinopoisk rating, the search for the desired dataset continued. API Kinopoisk turned out to be closed, and
What is the article
The study found dataset divided into two volume parts:
- Prediction algorithm training (movie rating is target label)
- Search for interesting and non-trivial data correlations
In this article, I would like to pay more attention to the second part of the study, but only note that in the first part I tried to train a large number of different models. The accuracy of prediction achieved using gradient boosting is 0.4 points (mse error) on the IMDB scale. But the process of building a predictive model deserves a separate article, and in this one I propose to focus on the second paragraph.
Let's start
I began the second part of my research by taking the linear regression algorithm with lasso regularization, trained in the first part, and plotting the weighting coefficients for the attributes. Let's take a look at it:
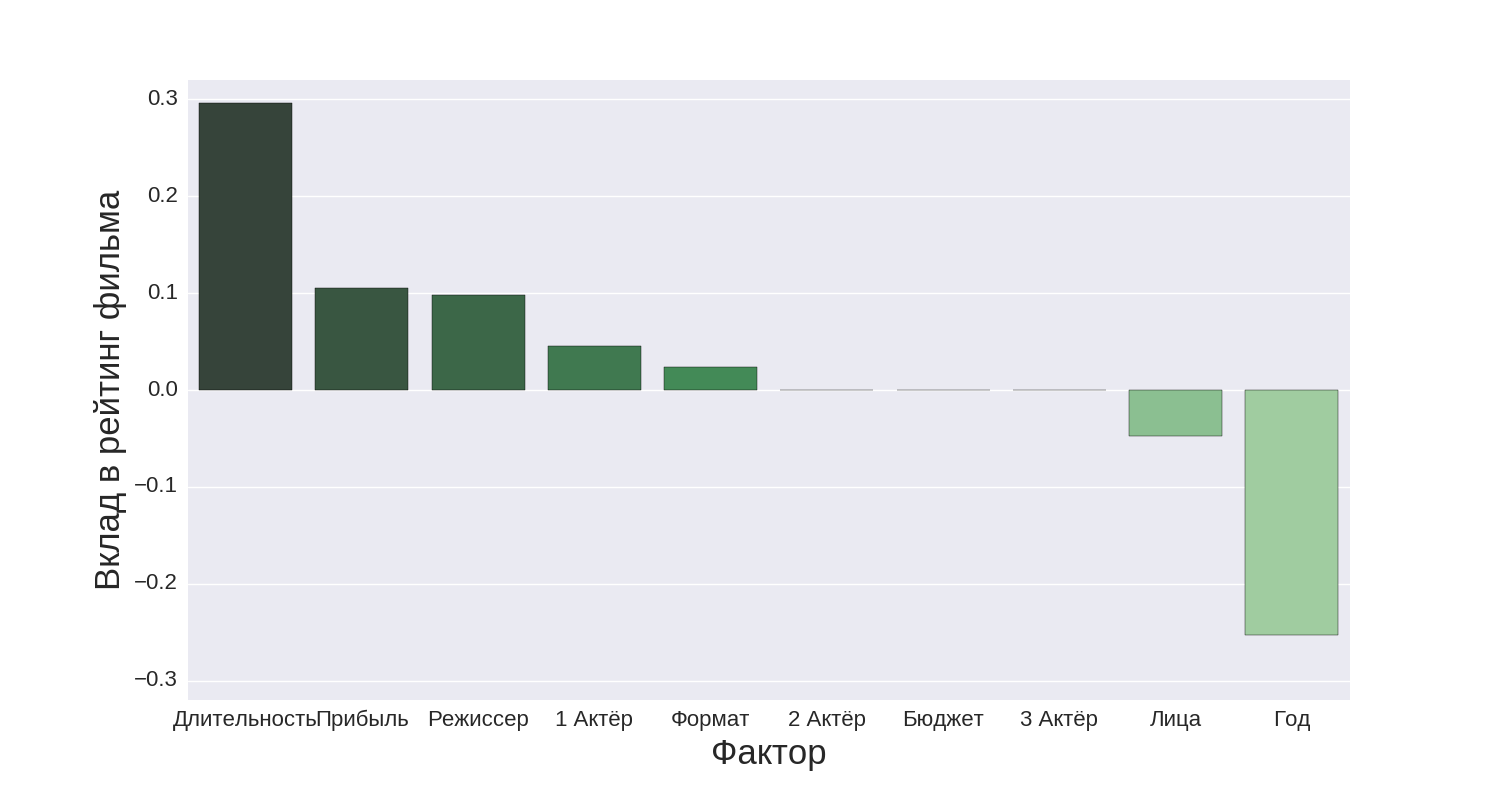
The columns "Director", "[123] Actor" correspond to the number of likes on Facebook from the respective individuals. "Format" is the aspect ratio of the picture. "Persons" is an interesting real sign, reflecting the number of persons on the poster of the film. The significance of the remaining signs is obvious. There are several interesting points to note on this diagram:
- The duration of the film makes a positive contribution to the rating of the film (apparently long films go to the audience better)
- The year gives a negative contribution (that is, the newer the film, the more likely that the rating will be low)
- The number of people on the poster also makes a negative contribution
The last point I, as a fan of the film "Hotel Grand Budapest", caused outrage, but you can not argue with the algorithm.
Genre
Now let's take a look at, perhaps, the main feature of the film - “Genre”.
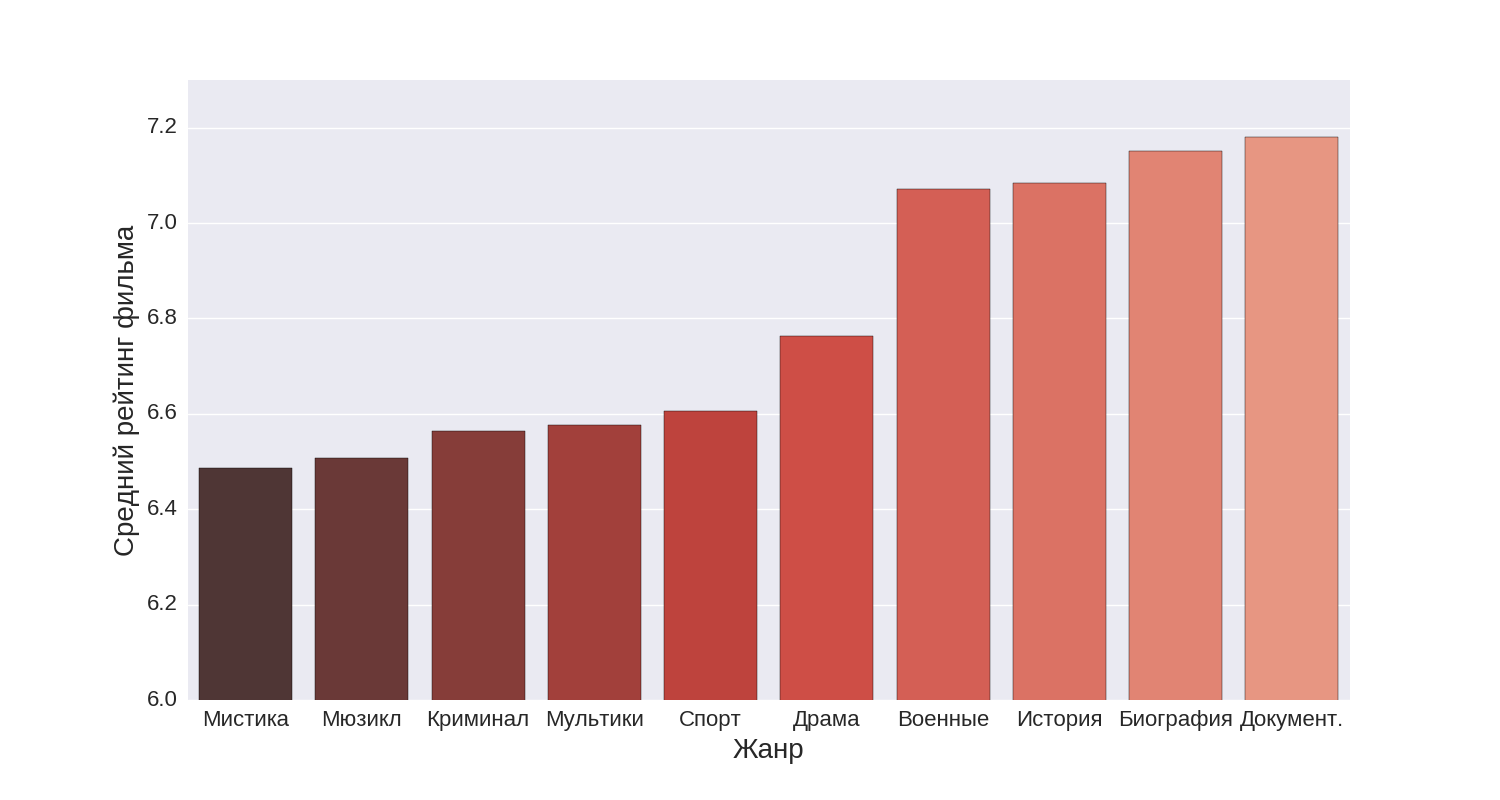
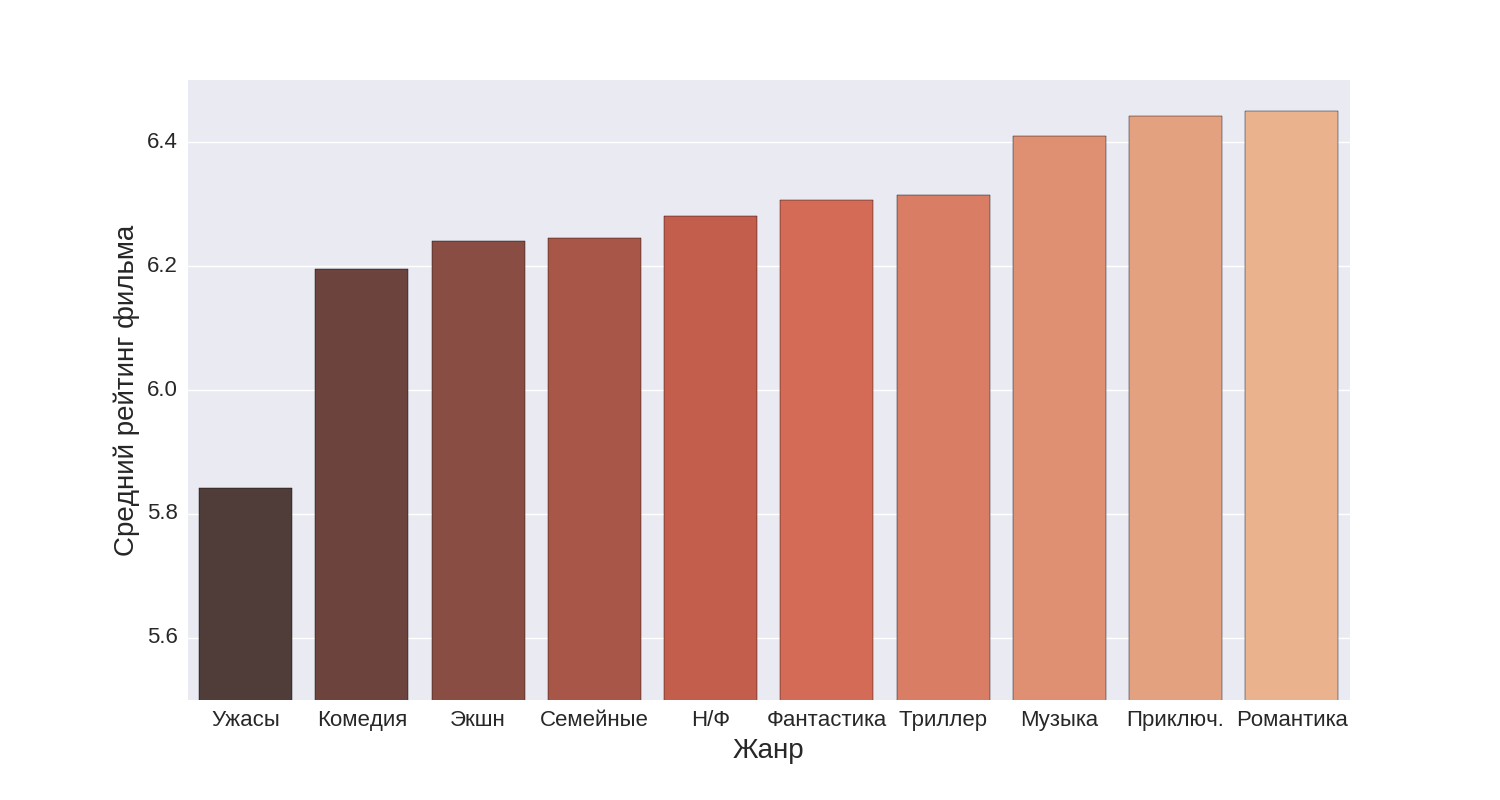
The first diagram shows the first top ten genres, the second genres from 11th to 20th place according to the average rating.
It turns out the highest rating is recruited documentary, biographical and historical films. In turn, with a large margin, the lowest rating is recruited from horror films.
Country of Origin
Quite an interesting result can be seen in the diagram, reflecting the average rating of the film from different countries. Let's look at the top six countries by the average rating:
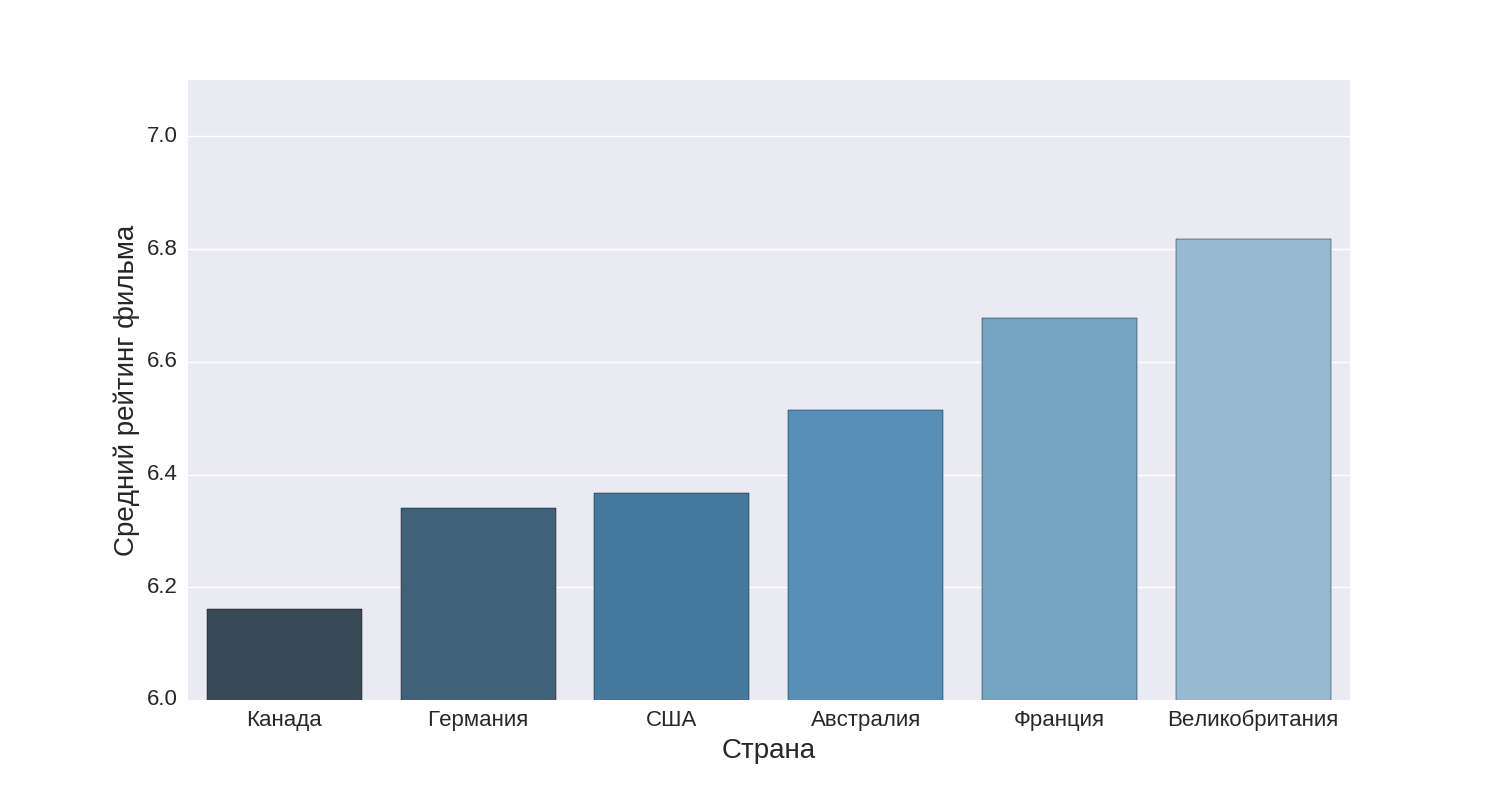
As you can see, the most rated films (on average) are shot in the UK, after which France comes, but in third place Australia was a very interesting surprise. Personally, it was difficult for me to recall
And now let's take a look at the financial component - on the costs of each country for its film production:
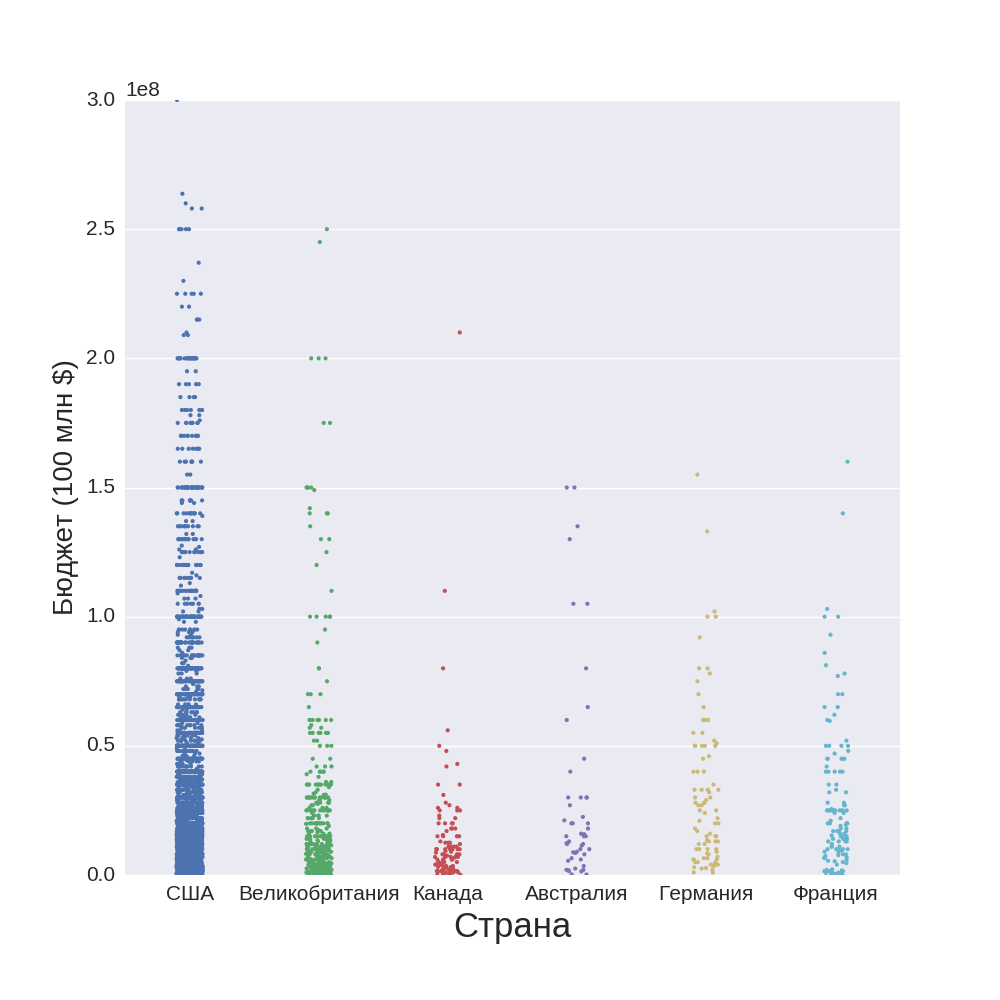
Everything is quite expected, the United States leads by a huge margin, although this does not fit in with the previous chart. It turns out that Americans use their resources inefficiently, since they spend more, but they lose in quality. Although no one denies that they can take not quality, but quantity.
Time
Now let's look at how different signs of films depend on time. This graph shows the average movie rating at some point in time:
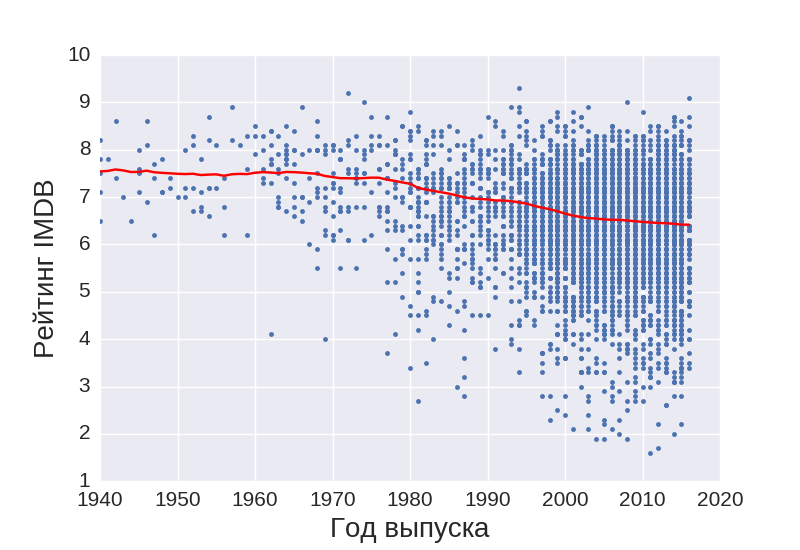
We can see that the average rating of films grows in inverse proportion to the year the film was released.
In turn, this fact does not dock with the content of the following schedule:
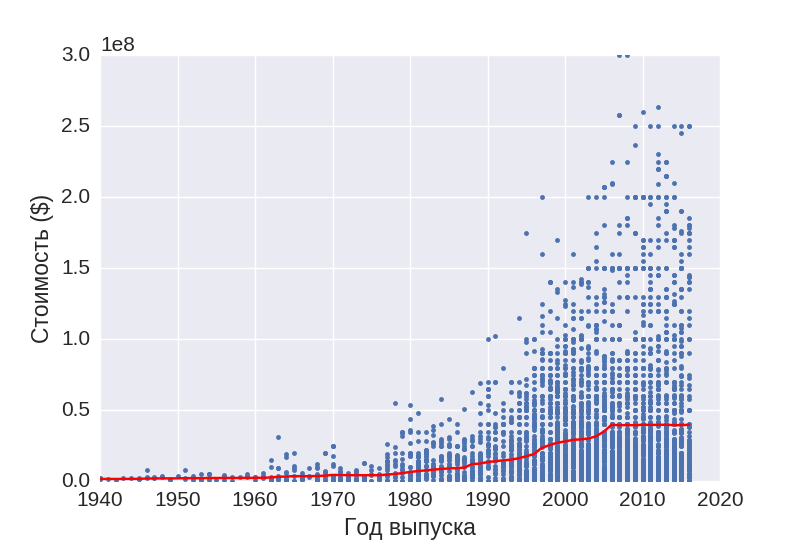
This graph shows the dynamics of changes in the average budget of the film. From the last two graphs, we can conclude that over the years we spend more on films, and we get them lower in quality.
Also very interesting picture gave the dependence of the average duration of the film from time to time:
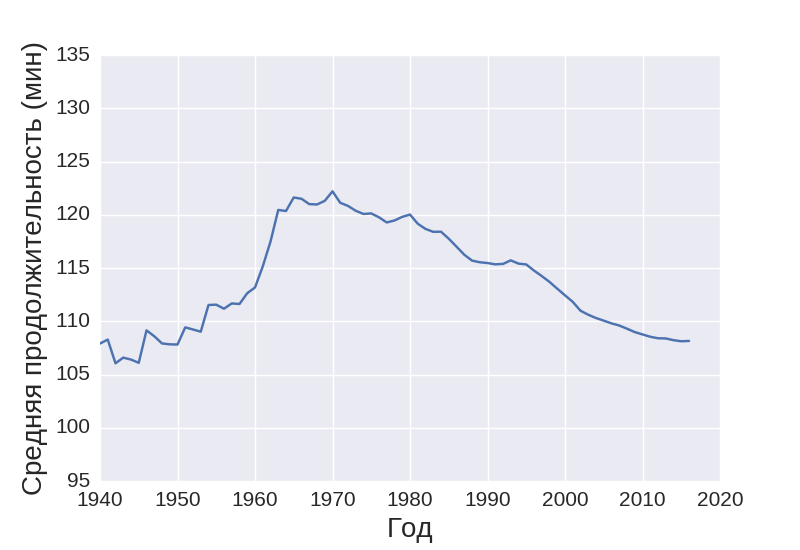
You can see that the longest films were shot in the 70s. It is very difficult to explain and you can be sure that no one knows the exact answer to this. One can only assume that in the 70s video and audio equipment was seriously developed, at the same time, directors and screenwriters had a sea of ideas and therefore it was difficult for them to stop the flow of thoughts. And nowadays so many films have already been made that it is already difficult to come up with something new and therefore films are made shorter.
findings
As you can see, Data Mining research provides very interesting results and can be used to analyze various current processes in one of the most dynamic and fast-developing industries in the world. A good example of the use of these dependencies in practice is the series “House of Cards”. How Netflix selected directors and actors using data analysis methods can be found here .
Source: https://habr.com/ru/post/318330/
All Articles