Netdata: real-time monitoring
We have already considered the issues of monitoring, collecting and storing metrics in previous publications. Today we will talk about another tool — Netdata.
Unlike other tools of a similar plan, it is focused on collecting and visualizing metrics in real time (if necessary, you can connect backends to collect and store collected metrics).
With the help of netdata, you can track just a huge number of indicators: CPU usage, memory consumption, I / O operations, network (the list is far from complete). Netdata is also equipped with plug-ins for tracking various services: Postfix, Squid, PHP-FPM and others.
In this article we will describe how to install and configure Netdat on a server running OC Ubuntu 16.04.
')
Installation
Before installing Netdata, install all the necessary dependencies:
$ sudo apt-get install git zlib1g-dev uuid-dev libmnl-dev gcc make autoconf autoconf-archive autogen automake pkg-config curl $ sudo apt-get install python python-yaml python-mysqldb python-psycopg2 nodejs lm-sensors netcat After the installation is completed, we clone the official netdata repository:
$ git clone https://github.com/firehol/netdata.git --depth=1 ~/netdata Next, run:
$ cd ~/netdata $ sudo ./netdate-installer.sh The last command will launch an automatic build and install script for Netdata. When the installation is complete, Netdata is ready for use. And if you change some configuration parameters, everything will work with much greater speed and performance. We will discuss this in more detail in the following sections.
Turn on deduplication of memory pages.
We begin with the fact that we activate KSM (Kernel Same-Page Merging, combining identical memory pages). This technology allows you to combine memory pages between different processes for sharing. As the creators of Netdata themselves assure in their blog, with its help you can increase productivity by 40 - 60%.
Run the command:
$ sudo nano /etc/rc.local The rc.local file (its name is short for run control) is a script that executes after all other services and processes are started. Edit this file as follows:
#!/bin/sh -e # # rc.local # # This script is executed at the end of each multiuser runlevel. # Make sure that the script will "exit 0" on success or any other # value on error. # # In order to enable or disable this script just change the execution # bits. # # By default this script does nothing. echo 1 > /sys/kernel/mm/ksm/run echo 1000 > /sys/kernel/mm/ksm/sleep_millisecs exit 0 The first command writes the unit to the / sys / kernel / mm / ksm / run file and thereby activates the KSM, and the second indicates that the KSM daemon should run once a second and check 100 pages for duplicates.
KSM will be activated after server reboot.
Set the retention period for metrics
All Netdata settings are written in the /etc/netdata/netdata.conf configuration file.
In the [global] section (general settings are written in it) we find the history parameter. Its value is the period (in seconds) during which the collected metrics are stored. Memory consumption also depends on this period:
- 15 MB of RAM is required to store data for 3600 seconds (1 hour);
- within 7200 seconds (2 hours) - 30 MB of RAM;
- within 14400 seconds (4 hours) - 60 MB of RAM;
- within 28,800 seconds (8 hours) - 120 MB of RAM;
- for 43200 seconds (12 hours) - 180 MB of RAM;
- for 86400 seconds (ie, days) - 360 MB of RAM.
Here are the indicators for standard dashboards; for custom dashborods, the amount of memory consumed can be both more and less. Set the desired value (in our case it is 14,400) and save the changes.
For more information about the features of configuring Netdata can be found in the official documentation .
Dashboards: structure and functions
The page where Netdata displays all metrics and graphs is available in the browser at http: // [server IP address]: 19999. In appearance, it resembles the web interface of the popular tool Grafana, about which we have already written.
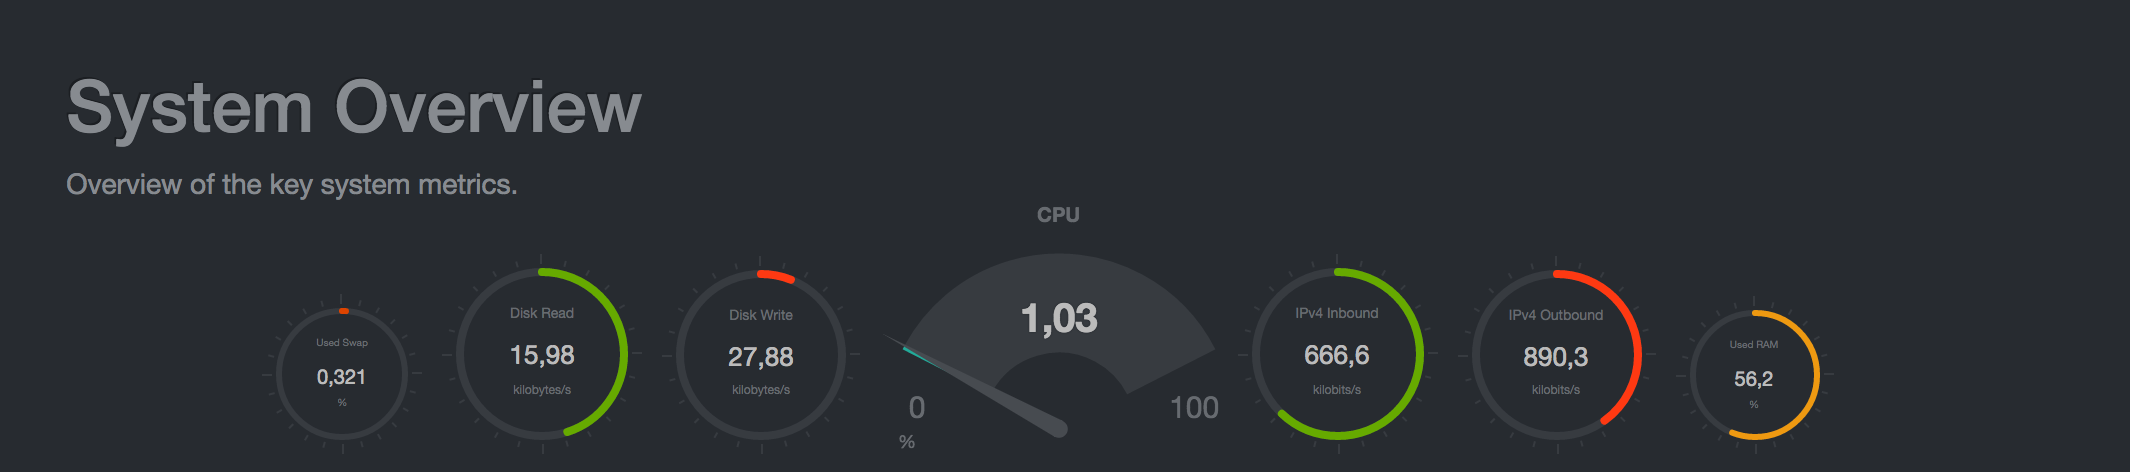
On the very first dashboard, the main metrics of the system are shown:
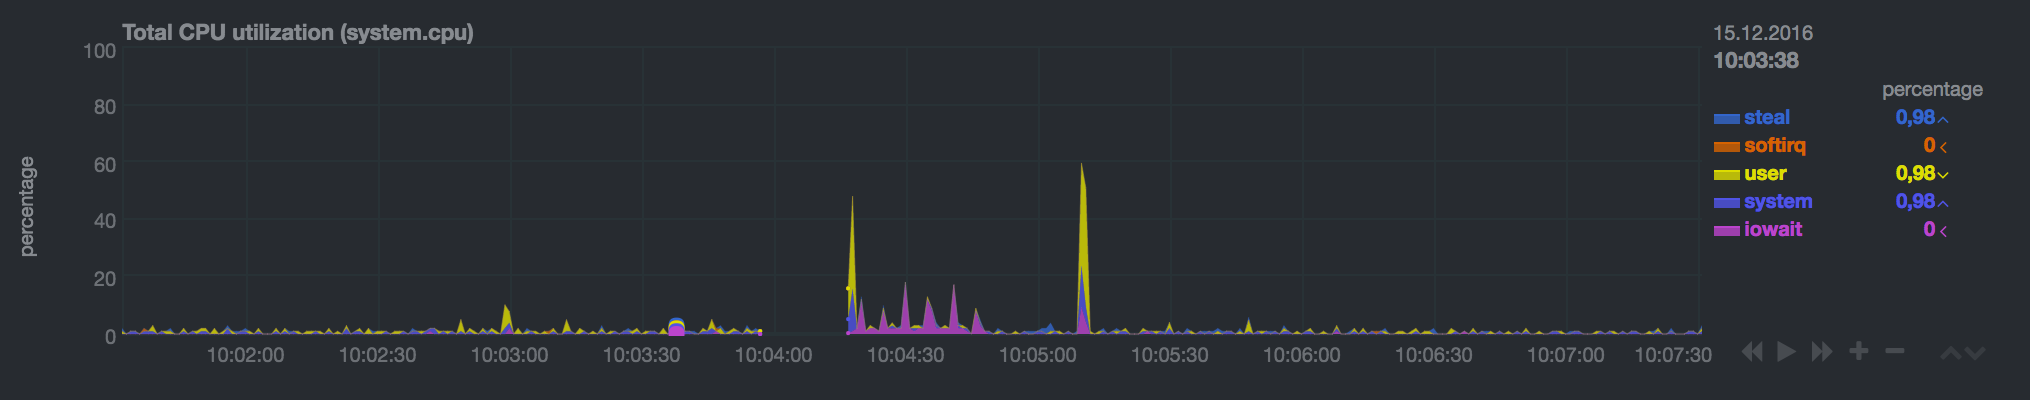
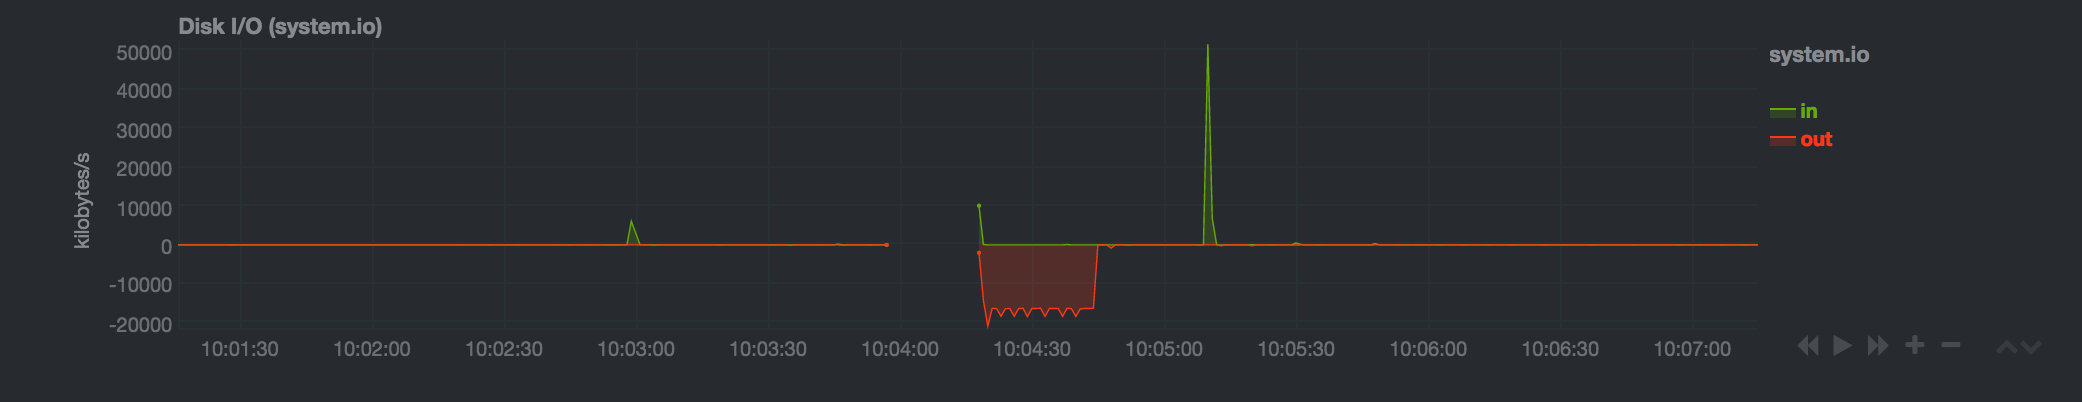
Next come the graphics of CPU usage, memory consumption, I / O operations, network activity, and others:

We can increase (or, on the contrary, decrease) the time intervals on the charts: to do this, move the cursor to the dashboard, press SHIFT and twist the mouse wheel. Numerous additional graphics can be added to the page; more about this can be found here .
Configure Alerts
Some types of alerts in Netdata are configured straight out of the box, in particular:
- alerts to stop any of the monitored applications;
- error notifications on network interfaces;
- disk space alerts.
Netdata also calculates how much free space is left on the disk and for how long this free space will be exhausted; if this period is less than 48 hours.
As you can see, for typical situations such alerts are more than enough. And if you need to set up custom alerts, Netdata has special templates that are described in configuration files stored in the /etc/netdata/health.d directory.
Consider the structure and syntax features of these templates. Let's start with the following example:
template: disk_space_usage on: disk.space calc: $used * 100 / ($avail + $used) units: % every: 1m warn: $this > (($status >= $WARNING ) ? (80) : (90)) crit: $this > (($status == $CRITICAL) ? (90) : (98)) delay: up 1m down 15m multiplier 1.5 max 1h info: current disk space usage to: sysadmin Everything here is intuitive: the template indicates when to send out warnings about the exhaustion of disk space. We analyze its structure.
The template field contains the name of the template. The on field indicates that the pattern should be applied to all graphics, where context = disk.space (i.e., all dashboards with I / O statistics).
The calc field is probably the most interesting for us: it contains the formula for calculating the critical amount of free disk space. It looks like this: $ used * 100 / ($ avail + $ used). As you might guess, $ used is the amount of used space, and $ use is free disk space.
In the units field, we indicate that the indicator is expressed as a percentage, and in the every field - that the test should be carried out once a minute.
Pay attention to the warn and crit fields: they indicate the values at which a warning should be sent, respectively (in our case, 80 -90%) and a message about the critical value of the indicator (98%).
Here we give only a brief description; more details about the templates can be found here .
Restrictions
Like any tool, Netdata has its limitations and disadvantages. The first minus is that Netdata cannot be used to monitor a cluster of servers: it must be installed on each server separately. And if these servers are accessible from the Internet, then the Netdata interface must be shut down for external visitors (: attackers can use the monitoring data as an aid in organizing a DOS attack.
Another drawback is the support of a very limited number of backends for storing metrics: today Graphite and OpenTSDB are claimed to be those. Of course, other backends can be “screwed” (see here ), but this is not so easy, especially for novice users who do not have programming skills.
Among the disadvantages of Netdata, you also need to highlight the insufficiently detailed and poorly structured documentation (so far it is available only on the wiki on Github ): it is sometimes extremely difficult to find the answer to the necessary question in it.
Conclusion
In this article, we have done a brief overview of the capabilities of Netdata. If you want to see Netdata in action, the developers have opened access to demo servers for a wide audience, where you can see and “touch” everything. If you already use Netdata - share your impressions in the comments.
In conclusion, according to tradition, we provide useful links for those who want to learn more:
- Netdata official documentation (insufficiently detailed and somewhat chaotic, as mentioned above);
- A good guide to installing and configuring Netdata (we used it when writing this article);
- A good article is an overview of the capabilities of Netdata (in French).
Source: https://habr.com/ru/post/318284/
All Articles