The truth about traditional JavaScript benchmarks

It may be fair enough to say that JavaScript is the most important modern technology in software development. For many of those who have studied programming languages, compilers and virtual machines, it’s still surprising that, for all its elegance in terms of the structure of the JavaScript language, we are not very good at compiling and cannot boast a great standard library. Depending on who your interlocutor is, you can list the flaws in JavaScript for weeks and still find out some oddity about which you have not heard. But despite the obvious shortcomings, today JavaScript is a key technology on the web, it is moving toward dominance in the server / cloud realm (thanks to Node.js), and also penetrates the Internet of things.
The question arises - why is JavaScript so popular? I am afraid I do not have an exhaustive answer. Today there are many reasons for using this language, the most important of which are probably a huge ecosystem built around JavaScript and a myriad of resources. But all this is to a certain extent a consequence. And why did the language initially become popular? You can say: because for a long time he was a lingua franca for the web. But that was a long time ago, and developers passionately hated JavaScript. Looking back, the popularity of JavaScript began in the second half of the 2000s. Just at that time, JavaScript engines started working much faster with various loads, which probably influenced the attitude of many to this language.
In those years, so-called traditional JavaScript benchmarks were used to measure speed, starting with Apple SunSpider , the progenitor of all JS micro benchmarks, then there were Mozilla Kraken and Google V8. Later, Google's benchmark was supplanted by Octane , and Apple released JetStream . These traditional benchmarks have made incredible efforts to bring JavaScript performance to a height that no one had expected at the beginning of the century. Thousands of accelerations were noted, and suddenly the use of
<script> no longer a dance with the devil, and the execution of calculations on the client side was not only possible, but even encouraged.')
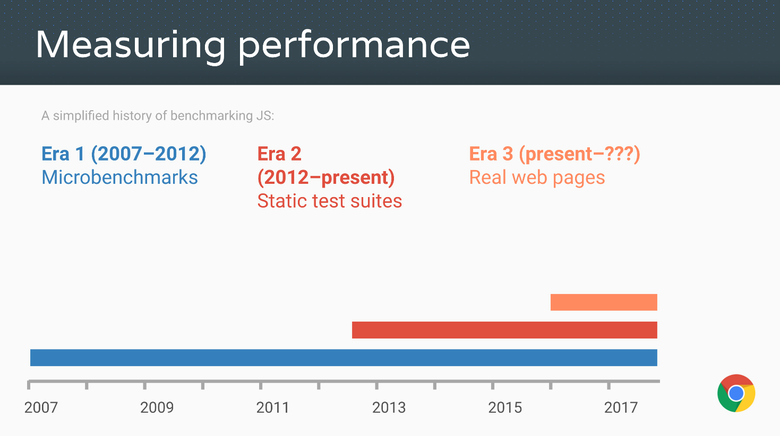
Source: Advanced JS performance with V8 and Web Assembly , Chrome Developer Summit 2016, @ s3thompson .
In 2016, all (significant) JS engines achieved incredible performance, and web applications became as nimble as their native (or can be as nimble as). The engines come with sophisticated optimized compilers that generate short sequences of highly optimized machine code. This is achieved through a thoughtful choice of type / shape (type / shape) for each operation (access to properties, binary operations, comparisons, calls, and so on) depending on the available statistics on various types / forms. Most of these optimizations were dictated by microbenches like SunSpider and Kraken, as well as statistical packages like Octane and JetStream. Thanks to JavaScript-based technologies like asm.js and Emscripten, today you can compile large C ++ applications in JavaScript and run them in a browser without any download or installation. For example, you can easily play out of the box on the network in AngryBots , while earlier this required special plug-ins like Adobe Flash or Chrome PNaCl.
The overwhelming majority of all these achievements became possible due to the presence of microbench marks and performance measurement packages, as well as competition between traditional JS benchmarks. You can say anything about SunSpider, but obviously, without it, JavaScript performance would hardly be the same as today.
But enough praise, it's time to look at the back of the coin. All measurement tests — be it microbenchmarks or large packages — are doomed to become irrelevant over time! Why? Because the benchmark can teach you something only until you start playing with it. As soon as you exceed (or do not exceed) a certain threshold, the overall applicability of optimizations that give a gain for a given benchmark will decrease exponentially.
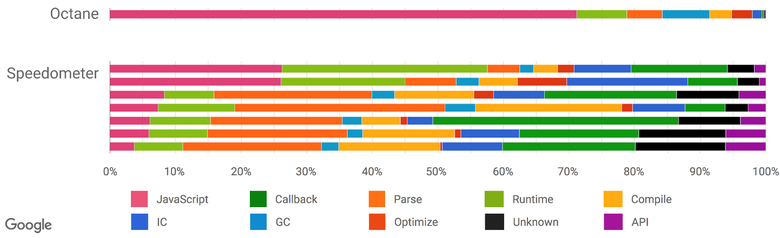
For example, we used Octane as a proxy to measure the performance of real web applications. And for some time he coped well with this task. But today, the distribution of time in Octane and real-world applications is very different, so further optimization of Octane is unlikely to lead to any significant improvements in real-world applications (including for Node.js).

Source: Real-World JavaScript Performance , BlinkOn 6 Conference, @tverwaes .
As it became increasingly obvious that all the traditional benchmarks for measuring JavaScript performance, including the most recent versions of JetStream and Octane, seemed to have become obsolete, we began to look for new ways to measure real-world applications, adding new interceptors for profiling and tracing. We also used funds that allow us to understand what we spend more time on when browsing websites: the execution of the script, garbage collection, compiling, and so on. The results of the research were very interesting and unexpected. As can be seen from the previous illustration, when you start Octane, more than 70% of the time is spent on executing JavaScript and garbage collection, while viewing sites on JavaScript always takes less than 30% of the time, and garbage collection does not exceed 5%. But a lot of time is spent on parsing and compiling, which cannot be said about Octane. So significant efforts to optimize the execution of JavaScript will give you a good gain of parrots in Octane, but sites will not load much faster. Moreover, the enthusiasm for optimizing the execution of JavaScript can even harm the performance of real applications, because the compilation will take more time - or you will need to keep track of additional parameters that will lengthen the compilation, IC and Runtime.
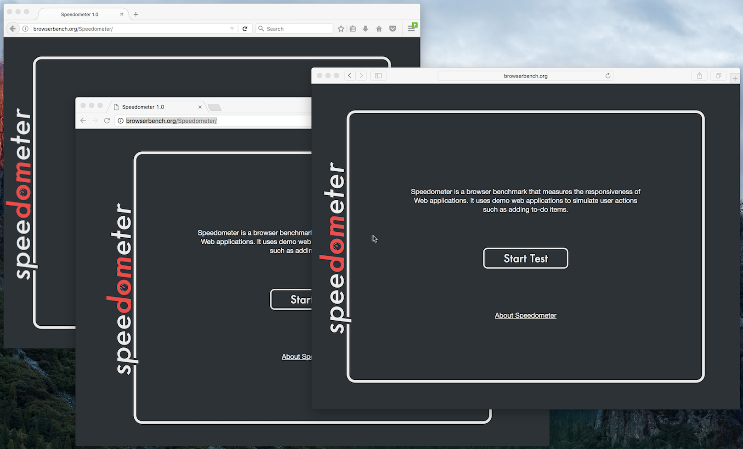
There is another benchmark package that attempts to measure the overall performance of the browser, including JavaScript and the DOM: Speedometer . He tries to approach the measurement more realistically by running a simple TodoMVC application implemented on various popular web frameworks (today it is a bit out of date, but a new version is already being made). The package includes new tests (angular, ember, react, vanilla, flight and backbone). Today, the Speedometer seems to be the preferred option for the role of a proxy to measure the performance of real applications. But note that this is data as of mid-2016, and everything could change as the patterns used on the web evolved (for example, we will refactor the IC system to drastically reduce costs, and also redesign the parser ). Although it looks like the situation described above is only related to browsing sites, we received very convincing evidence that traditional peak performance benchmarks are not very well suited for the role of proxy in the case of real Node.js applications.
Source: Real-World JavaScript Performance , BlinkOn 6 Conference, @tverwaes .
Probably, all this is already known to a wide audience, so I’ll only dwell on a few specific examples illustrating the idea why it’s not just useful for the JS community, but it is also crucial for us to stop paying attention to static benchmarks of peak performance from a certain point. I’ll start with examples of how JS engines can run benchmarks and how they actually do it.
Infamous SunSpider Examples
An article on traditional JS benchmarks would be incomplete without mentioning the obvious problems of SunSpider. Let's start with the performance test, whose applicability in real situations is limited: bitops-bitwise-and.js .
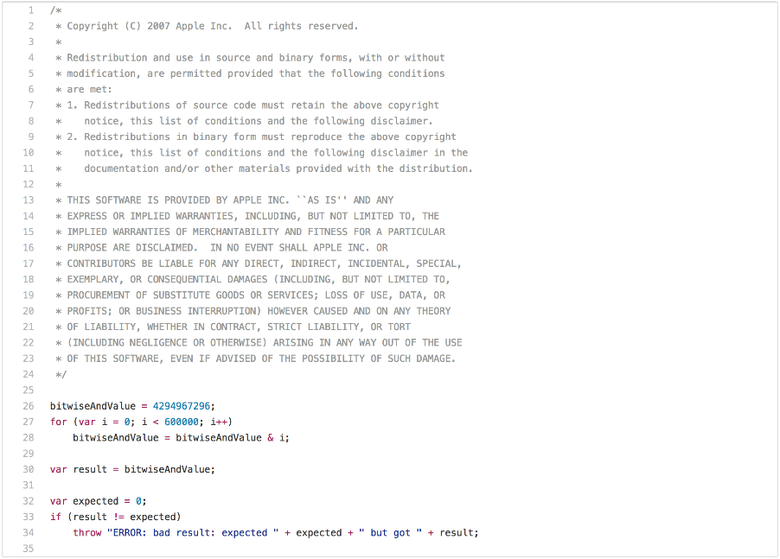
There are a couple of algorithms that require a quick bitwise AND operation (bitwise AND), especially in code transpile from C / C ++ to JavaScript. However, it is unlikely that web pages care whether the engine can perform the bitwise operation AND in a cycle twice as fast as another engine. You probably noticed that after the first iteration of the loop, bitwiseAndValue becomes 0 and remains so for the next 599,999 iterations. So as soon as you run it with good performance, that is, faster than 5 ms on a decent hardware, you can start chasing this benchmark in an attempt to understand that only the first iteration of this cycle is needed, and all the others are just a waste of time (i.e. dead code after splitting cycle ). To perform such a conversion to JavaScript, you will need to check:
- is
bitwiseAndValuenormal property of a global object before the script is executed, - so that there is no interceptor of a global object or its prototypes, and so on.
But if you really want to win the benchmark and are ready for anything for this, you can complete the test in less than 1 ms. But the applicability of optimization is limited only to this particular case, and small changes to the test probably will not lead to its triggering.
In short, the bitops-bitwise-and.js test was the worst example of a microbenchmark. Let us turn to a more practical example - the test string-tagcloud.js . In fact, it drives a very early version of the json.js
json.js . Perhaps this test looks much more reasonable than the previous one. But if you take a closer look at the benchmark profile, it becomes obvious that he spends a lot of time on a single eval expression (up to 20% of the total execution time for parsing and compiling and up to 10% for real execution of the compiled code):
Let's take a closer look:
eval is executed only once and is transmitted to a JSON string containing an array of 2501 objects with the tag and popularity fields: ([ { "tag": "titillation", "popularity": 4294967296 }, { "tag": "foamless", "popularity": 1257718401 }, { "tag": "snarler", "popularity": 613166183 }, { "tag": "multangularness", "popularity": 368304452 }, { "tag": "Fesapo unventurous", "popularity": 248026512 }, { "tag": "esthesioblast", "popularity": 179556755 }, { "tag": "echeneidoid", "popularity": 136641578 }, { "tag": "embryoctony", "popularity": 107852576 }, ... ]) Obviously, it will be expensive to parse these object literals, generate native code, and then execute it. It is much cheaper to simply parse the input string as JSON and generate the corresponding object graph. To improve the results in the benchmark, you can always try to initially interpret
eval as JSON and actually perform the parsing, compiling and execution only if you cannot read it in the form of JSON (true, additional magic will be required to skip parentheses). In 2007, this would not have come down even for a bad hack, because JSON.parse did not exist yet . And by 2017 it turned into just a technical debt in a JavaScript engine, and it could potentially slow down the use of eval . Essentially, the benchmark update to modern javascript --- string-tagcloud.js.ORIG 2016-12-14 09:00:52.869887104 +0100 +++ string-tagcloud.js 2016-12-14 09:01:01.033944051 +0100 @@ -198,7 +198,7 @@ replace(/"[^"\\\n\r]*"|true|false|null|-?\d+(?:\.\d*)?(:?[eE][+\-]?\d+)?/g, ']'). replace(/(?:^|:|,)(?:\s*\[)+/g, ''))) { - j = eval('(' + this + ')'); + j = JSON.parse(this); return typeof filter === 'function' ? walk('', j) : j; } leads to an immediate increase in performance: today the runtime for the V8 LKGR is reduced from 36 to 26 ms, a 30 percent improvement!
$ node string-tagcloud.js.ORIG Time (string-tagcloud): 36 ms. $ node string-tagcloud.js Time (string-tagcloud): 26 ms. $ node -v v8.0.0-pre $ This is a common problem with static benchmarks and performance testing packages. Today, no one will seriously use
eval to parse JSON data (for security reasons, not just performance). Instead, all code written in the last five years uses JSON.parse . Moreover, using eval for parsing JSON in production can be regarded as a bug! So in this ancient benchmark, the efforts of the authors of engines to increase the performance of relatively recently written code are not taken into account. Instead, it would be useful to make eval unnecessarily complicated to get a good result in string-tagcloud.js .Let's move on to another example - 3d-cube.js . This benchmark performs many matrix operations that even the smartest compilers cannot do anything with but simple execution. The benchmark spends a lot of time performing the Loop function and the functions it calls.

An interesting observation: the functions
RotateX , RotateY and RotateZ always called with the constant parameter Phi .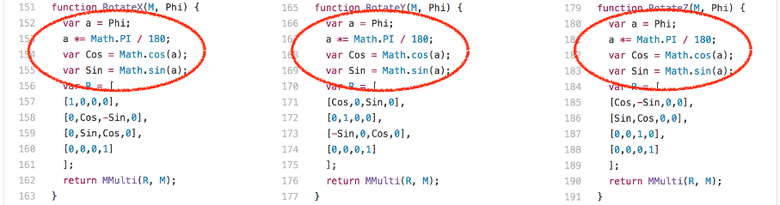
This means that we always calculate the same values for Math.sin and Math.cos , each 204 times. There are only three different input values:
- 0,017453292519943295
- 0.05235987755982989
- 0.08726646259971647
To avoid unnecessary calculations of the same sine and cosine values, you can cache previously calculated values. Previously, the V8 did just that, and all the other engines are doing so still. We have removed the so-called transcendental cache from V8, since its redundancy was noticeable under real loads, when you do not always calculate the same values in a row. We have greatly failed in the results of the SunSpider benchmark, removing this specific optimization, but we are completely sure that it does not make sense to optimize for the benchmark and at the same time worsen the results on real projects.
Source: arewefastyet.com .
Obviously, the best way to work with such constants — the input sine / cosine — is a normal inlining heuristic heuristic that will try to balance the substitution and take into account various factors like substitution preferences at the call points when a constant folding ( as in the case of
RotateX , RotateY and RotateZ ). But for a number of reasons this was not suitable for the Crankshaft compiler. But this is a reasonable option in the case of Ignition and TurboFan, and we are already working on improving the replacement heuristics .Garbage collection is considered harmful.
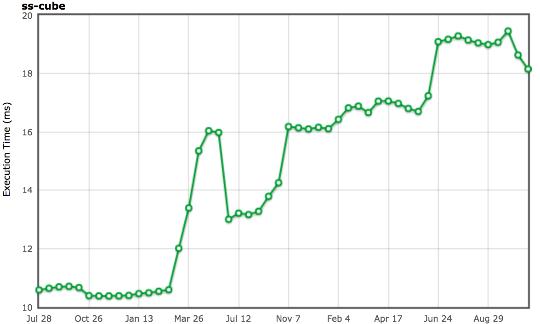
In addition to specific cases, SunSpider has another fundamental problem: the total execution time. Now, on a decent hardware Intel, the V8 engine drives the entire benchmark in about 200 ms (depending on living objects in the new space and fragmentation of the old space), while the main pause for garbage collection can easily reach 30 ms. And we still do not take into account the costs of incremental marking (incremental marking), and this is more than 10% of the total execution time of the SunSpider package! So if the engine does not want to slow down by 10-20% due to garbage collection, then it needs to somehow make sure that it will not be initiated during the execution of SunSpider.
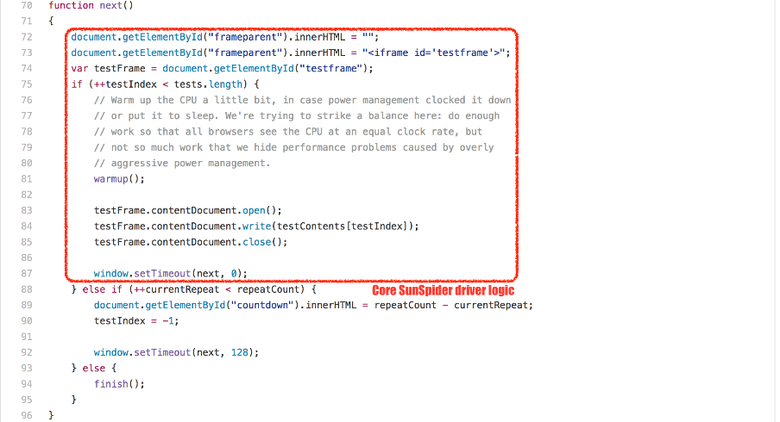
Different tricks are used for this, but all of them, as far as I know, do not have a positive effect on real tasks. V8 comes easy: since each SunSpider test is performed in a new
<iframe> corresponding to a new native context , we simply register the creation and placement of the <iframe> (each of the SunSpider tests takes less than 50 ms). And then garbage collection is performed between the placement and creation procedures, and not during the test. This trick works well and in 99.99% of cases does not affect real projects. But if V8 decides that your application looks like a SunSpider test, then it will force the garbage collector to run, and this will negatively affect the speed of work. So do n't let the app look like SunSpider !I could cite other examples related to SunSpider, but I don’t think it would be useful. I hope it is already clear to you that optimizing for SunSpider in order to exceed the results of good performance does not make sense for real applications. I think the world would benefit from the fact that SunSpider would not exist anymore, because the engines can use strange hacks, useful only for this package and can harm in real situations.
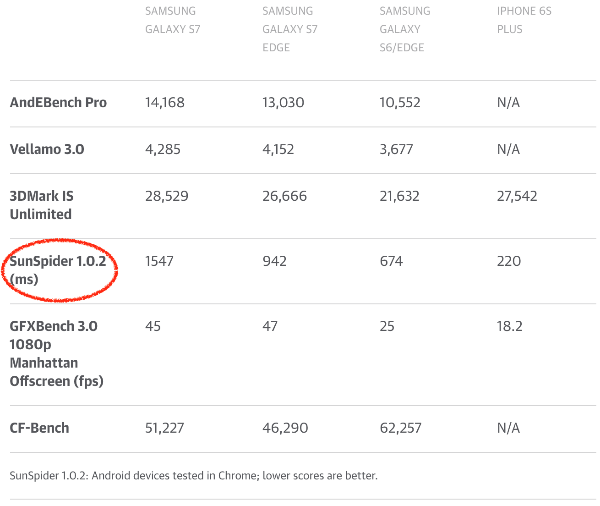
Unfortunately, SunSpider is still very actively used in the press when comparing what journalists consider browser performance. Or, even worse, to compare smartphones! Of course, there is also an interest of manufacturers. Android camp is important that Chrome showed good results on SunSpider (and other now meaningless benchmarks). Smartphone makers need to make money selling their products, and this requires good reviews. Some companies even deliver older versions of the V8 in smartphones that show higher results in SunSpider. As a result, users get unsecured security holes that have long been fixed in later versions. And the old versions of the V8 in fact work slower!
Source: Galaxy S7 and S7 Edge review: Samsung's finest get more polished, www.engadget.com .
If the JavaScript community is really interested in obtaining objective performance data, then we need to make journalists stop using traditional benchmarks when comparing browsers and smartphones. I understand that it is easier to run a benchmark in each browser and compare the numbers obtained, but in this case, please, please! - Pay attention to the benchmarks, which somehow correspond to the current state of affairs. That is the real web pages. If you need to compare two smartphones through a browser benchmark, take at least a Speedometer .
Less obvious situation with Kraken
Kraken benchmark was released by Mozilla in September of 2010 . It was declared that it contains code fragments and kernels of real applications. I won’t spend too much time on Kraken because it didn’t have such an impact on JavaScript performance as SunSpider and Octane. I will describe only an example with the audio-oscillator.js test.

The test calls the
calcOsc function 500 times. She first calls generate for the global sine Oscillator , then creates a new Oscillator , calls for generate for it and adds it to the sine Oscillator . Without going into the details of why this is done here, let's consider the generate method in the Oscillator prototype.
Looking at the code, we can assume that the bulk of the time is taken by accessing arrays, or multiplications, or cyclic calls to Math.round . But in fact, the expression
offset % this.waveTableLength dominates in the Oscillator.prototype.generate runtime. If you run a benchmark in the profiler on any Intel-machine, it turns out that more than 20% of processor cycles are spent on the idiv instruction, which is generated for the module (modulus). An interesting observation: the waveTableLength field of the waveTableLength instance always contains the value 2048, once assigned in the Oscillator constructor.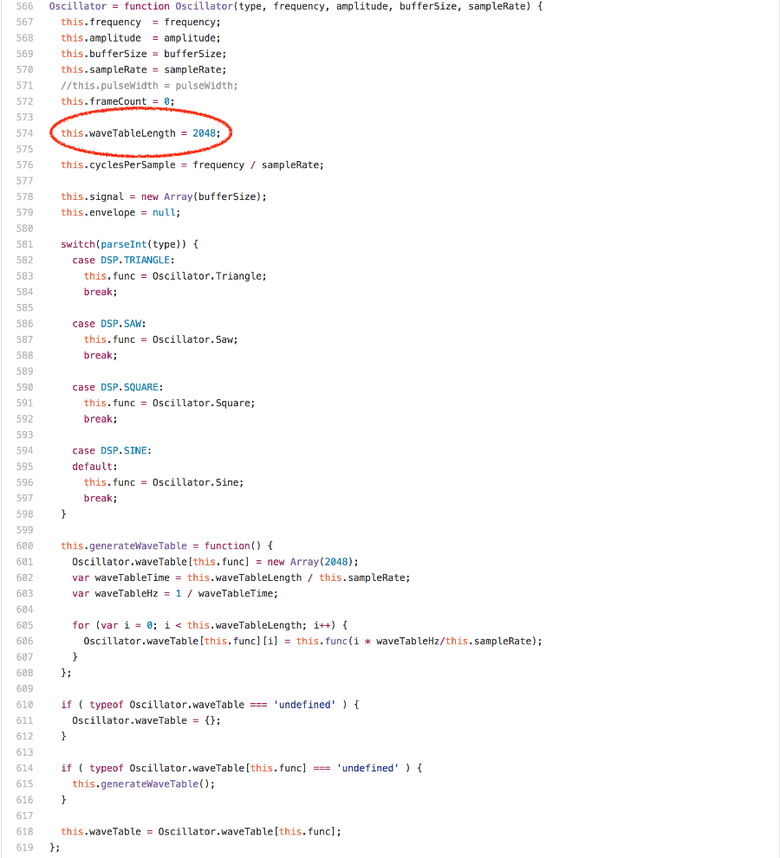
If we know that the right-hand side of the operation of an integer module is a power of two, then we can generate much better code and completely avoid the
idiv instruction on Intel. calcOsc /. sine Oscillator , calcOsc ., . V8 - ,
+ , * % , , , (. Fast arithmetic for dynamic languages ).fullcodegen Crankshaft,
BinaryOpIC MOD . V8 (c Crankshaft fullcodegen) $ ~/Projects/v8/out/Release/d8 --trace-ic audio-oscillator.js [...SNIP...] [BinaryOpIC(MOD:None*None->None) => (MOD:Smi*2048->Smi) @ ~Oscillator.generate+598 at audio-oscillator.js:697] [...SNIP...] $ ,
BinaryOpIC (constant feedback) , , ( Smi V8), . --print-opt-code --code-comments , , Crankshaft Oscillator.prototype.generate : [...SNIP...] ;;; <@80,#84> load-named-field 0x133a0bdacc4a 330 8b4343 movl rax,[rbx+0x43] ;;; <@83,#86> compare-numeric-and-branch 0x133a0bdacc4d 333 3d00080000 cmp rax,0x800 0x133a0bdacc52 338 0f85ff000000 jnz 599 (0x133a0bdacd57) [...SNIP...] ;;; <@90,#94> mod-by-power-of-2-i 0x133a0bdacc5b 347 4585db testl r11,r11 0x133a0bdacc5e 350 790f jns 367 (0x133a0bdacc6f) 0x133a0bdacc60 352 41f7db negl r11 0x133a0bdacc63 355 4181e3ff070000 andl r11,0x7ff 0x133a0bdacc6a 362 41f7db negl r11 0x133a0bdacc6d 365 eb07 jmp 374 (0x133a0bdacc76) 0x133a0bdacc6f 367 4181e3ff070000 andl r11,0x7ff [...SNIP...] ;;; <@127,#88> deoptimize 0x133a0bdacd57 599 e81273cdff call 0x133a0ba8406e [...SNIP...] ,
this.waveTableLength ( rbx this ), , 2048 ( 0x800). , idiv ( r11 i ), ., , , , : ! , ( , ).
idiv , BinaryOpIC Smi*Smi->Smi . , Oscillator , waveTableLength generate . 20 % , Oscillator '; (non-local penalization). --- audio-oscillator.js.ORIG 2016-12-15 22:01:43.897033156 +0100 +++ audio-oscillator.js 2016-12-15 22:02:26.397326067 +0100 @@ -1931,6 +1931,10 @@ var frequency = 344.53; var sine = new Oscillator(Oscillator.Sine, frequency, 1, bufferSize, sampleRate); +var unused = new Oscillator(Oscillator.Sine, frequency, 1, bufferSize, sampleRate); +unused.waveTableLength = 1024; +unused.generate(); + var calcOsc = function() { sine.generate(); audio-oscillator.js , Oscillator waveTableLength , : $ ~/Projects/v8/out/Release/d8 audio-oscillator.js.ORIG Time (audio-oscillator-once): 64 ms. $ ~/Projects/v8/out/Release/d8 audio-oscillator.js Time (audio-oscillator-once): 81 ms. $ . , , , . , , . , - -
BinaryOpIC , 20- ( , ). , , .JavaScript. , , JavaScript . , , () . ,
idiv , , ( ). TurboFan, Crankshaft, runtime , , () (): if 0 < rhs then msk = rhs - 1 if rhs & msk != 0 then lhs % rhs else if lhs < 0 then -(-lhs & msk) else lhs & msk else if rhs < -1 then lhs % rhs else zero ( TurboFan):
$ ~/Projects/v8/out/Release/d8 --turbo audio-oscillator.js.ORIG Time (audio-oscillator-once): 69 ms. $ ~/Projects/v8/out/Release/d8 --turbo audio-oscillator.js Time (audio-oscillator-once): 69 ms. $ , , , , , . , JS- , Kraken , TurboFan. TurboFan Crankshaft, , , , ! , , , , . . . , , , .
Kraken , JS- — Octane.
Octane
Octane — V8. Google 2012 , Octane 2.0 — 2013- . 15 , — Splay Mandreel — (throughput) . , Microsofts TypeScript, asm.js zlib, (ray tracer), . . JavaScript, 2012 .
, Octane JavaScript 2012—2013-. . Octane (, TypeScript zlib Emscripten , Mandreel ).
, Ember AngularJS , JavaScript, Octane () . JavaScript , JS- , , Octane. , , Octane .
Octane, . , ! , Octane — JavaScript, . , JS- , , Octane — ! , , !
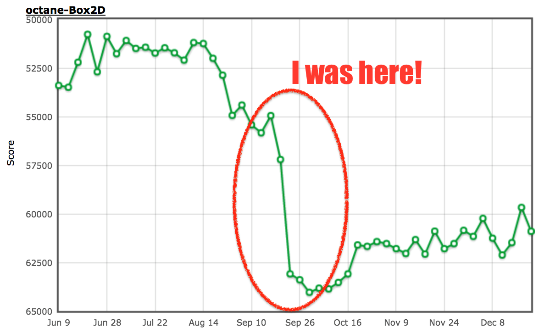
Box2D, Box2DWeb , , JavaScript. , JS- . , , , ( ).
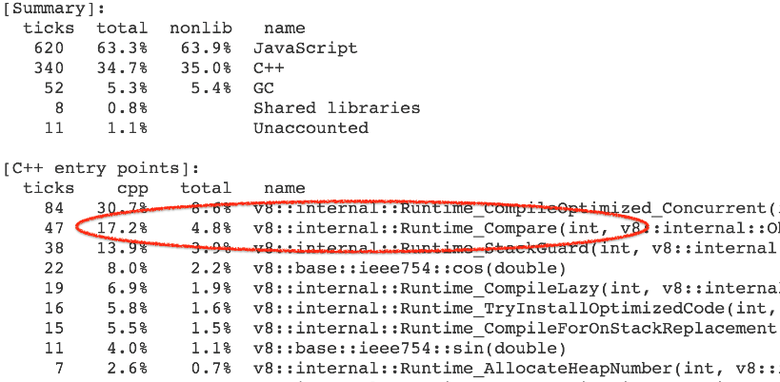
D.prototype.UpdatePairs (): D.prototype.UpdatePairs = function(b) { var e = this; var f = e.m_pairCount = 0, m; for (f = 0; f < e.m_moveBuffer.length; ++f) { m = e.m_moveBuffer[f]; var r = e.m_tree.GetFatAABB(m); e.m_tree.Query(function(t) { if (t == m) return true; if (e.m_pairCount == e.m_pairBuffer.length) e.m_pairBuffer[e.m_pairCount] = new O; var x = e.m_pairBuffer[e.m_pairCount]; x.proxyA = t < m ? t : m; x.proxyB = t >= m ? t : m; ++e.m_pairCount; return true }, r) } for (f = e.m_moveBuffer.length = 0; f < e.m_pairCount;) { r = e.m_pairBuffer[f]; var s = e.m_tree.GetUserData(r.proxyA), v = e.m_tree.GetUserData(r.proxyB); b(s, v); for (++f; f < e.m_pairCount;) { s = e.m_pairBuffer[f]; if (s.proxyA != r.proxyA || s.proxyB != r.proxyB) break; ++f } } }; , ,
e.m_tree.Query : function(t) { if (t == m) return true; if (e.m_pairCount == e.m_pairBuffer.length) e.m_pairBuffer[e.m_pairCount] = new O; var x = e.m_pairBuffer[e.m_pairCount]; x.proxyA = t < m ? t : m; x.proxyB = t >= m ? t : m; ++e.m_pairCount; return true } , , . 4—7 % runtime- Compare , (abstract relational comparison).
runtime- CompareICStub , :
x.proxyA = t < m ? t : m; x.proxyB = t >= m ? t : m; 99 % ! How so? , JavaScript, .
t m — L , . Symbol.toPrimitive , "toString" , "valueOf" Symbol.toStringTag , . t < m , :- ToPrimitive (
t,hint Number). - OrdinaryToPrimitive (
t,"number"),Symbol.toPrimitive. t.valueOf(),t, Object.prototype.valueOf .t.toString(),"[object Object]", Object.prototype.toString , Symbol.toStringTagL.- ToPrimitive (
m,hint Number). - OrdinaryToPrimitive (
m,"number"), Symbol.toPrimitive. m.valueOf(), m, Object.prototype.valueOf .m.toString(),"[object Object]", Object.prototype.toString , Symbol.toStringTagL."[object Object]" < "[object Object]",
t >= m , true . , . : , : --- octane-box2d.js.ORIG 2016-12-16 07:28:58.442977631 +0100 +++ octane-box2d.js 2016-12-16 07:29:05.615028272 +0100 @@ -2021,8 +2021,8 @@ if (t == m) return true; if (e.m_pairCount == e.m_pairBuffer.length) e.m_pairBuffer[e.m_pairCount] = new O; var x = e.m_pairBuffer[e.m_pairCount]; - x.proxyA = t < m ? t : m; - x.proxyB = t >= m ? t : m; + x.proxyA = m; + x.proxyB = t; ++e.m_pairCount; return true }, 13 %, :
$ ~/Projects/v8/out/Release/d8 octane-box2d.js.ORIG Score (Box2D): 48063 $ ~/Projects/v8/out/Release/d8 octane-box2d.js Score (Box2D): 55359 $ ? , ,
CompareIC : (map) (known receiver map tracking) ( V8 map — + ). . : $ ~/Projects/v8/out/Release/d8 --trace-ic octane-box2d.js [...SNIP...] [CompareIC in ~+557 at octane-box2d.js:2024 ((UNINITIALIZED+UNINITIALIZED=UNINITIALIZED)->(RECEIVER+RECEIVER=KNOWN_RECEIVER))#LT @ 0x1d5a860493a1] [CompareIC in ~+649 at octane-box2d.js:2025 ((UNINITIALIZED+UNINITIALIZED=UNINITIALIZED)->(RECEIVER+RECEIVER=KNOWN_RECEIVER))#GTE @ 0x1d5a860496e1] [...SNIP...] $ CompareIC , « » « » RECEIVER ' (JavaScript- V8). (map) 0x1d5a860493a1 , L . false true , : — 0x1d5a860493a1 . L , the Symbol.toPrimitive , "valueOf" "toString" . Symbol.toStringTag . Crankshaft Symbol.toStringTag :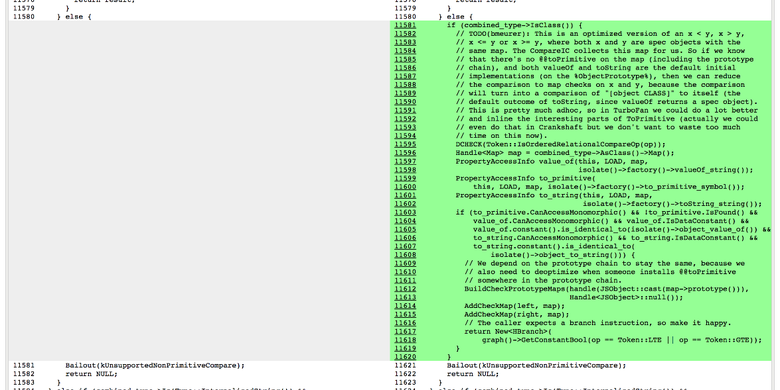
:
: , . , , , JS- . , ! , ( ,
true false , ). , , . ES2015, , (ES2015 — !).Mandreel. C/C++ JavaScript. asm.js , Emscripten , ( ). Octane Bullet , Mandreel . MandreelLatency, . , Mandreel , . , . , . , .
Mandreel
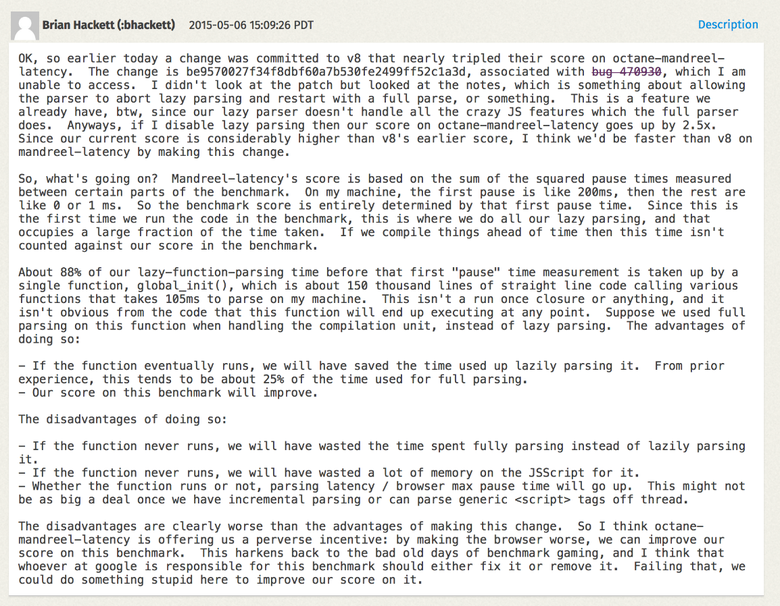
global_init , . , ( ), , , ( ). V8 . , , , . global_init Mandreel , + + . global_init , .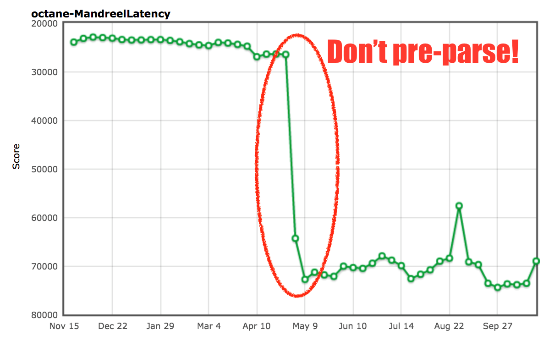
: arewefastyet.com .
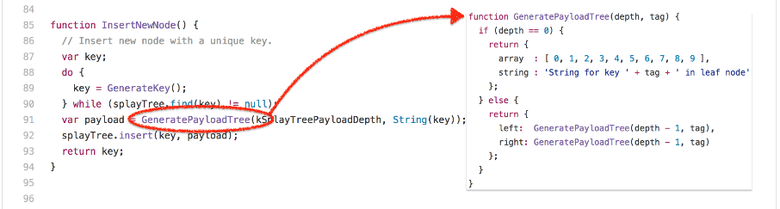
global_init , 200- . , , , , ( )., — splay.js . , (splay trees) ( ). : . (buckets) , . ! In theory. , :
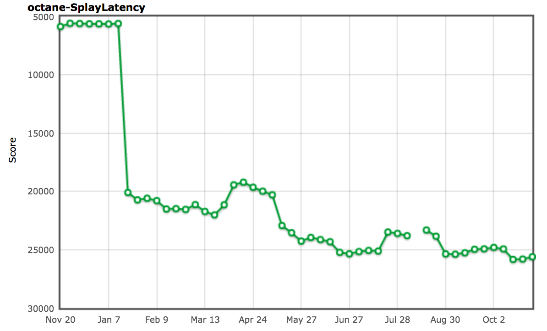
, , , , SplayLatency. Why? , , . , (generational garbage collector), V8: ( generational hypothesis ), . V8 :
$ out/Release/d8 --trace-gc --noallocation_site_pretenuring octane-splay.js [20872:0x7f26f24c70d0] 10 ms: Scavenge 2.7 (6.0) -> 2.7 (7.0) MB, 1.1 / 0.0 ms allocation failure [20872:0x7f26f24c70d0] 12 ms: Scavenge 2.7 (7.0) -> 2.7 (8.0) MB, 1.7 / 0.0 ms allocation failure [20872:0x7f26f24c70d0] 14 ms: Scavenge 3.7 (8.0) -> 3.6 (10.0) MB, 0.8 / 0.0 ms allocation failure [20872:0x7f26f24c70d0] 18 ms: Scavenge 4.8 (10.5) -> 4.7 (11.0) MB, 2.5 / 0.0 ms allocation failure [20872:0x7f26f24c70d0] 22 ms: Scavenge 5.7 (11.0) -> 5.6 (16.0) MB, 2.8 / 0.0 ms allocation failure [20872:0x7f26f24c70d0] 28 ms: Scavenge 8.7 (16.0) -> 8.6 (17.0) MB, 4.3 / 0.0 ms allocation failure [20872:0x7f26f24c70d0] 35 ms: Scavenge 9.6 (17.0) -> 9.6 (28.0) MB, 6.9 / 0.0 ms allocation failure [20872:0x7f26f24c70d0] 49 ms: Scavenge 16.6 (28.5) -> 16.4 (29.0) MB, 8.2 / 0.0 ms allocation failure [20872:0x7f26f24c70d0] 65 ms: Scavenge 17.5 (29.0) -> 17.5 (52.0) MB, 15.3 / 0.0 ms allocation failure [20872:0x7f26f24c70d0] 93 ms: Scavenge 32.3 (52.5) -> 32.0 (53.5) MB, 17.6 / 0.0 ms allocation failure [20872:0x7f26f24c70d0] 126 ms: Scavenge 33.4 (53.5) -> 33.3 (68.0) MB, 31.5 / 0.0 ms allocation failure [20872:0x7f26f24c70d0] 151 ms: Scavenge 47.9 (68.0) -> 47.6 (69.5) MB, 15.8 / 0.0 ms allocation failure [20872:0x7f26f24c70d0] 183 ms: Scavenge 49.2 (69.5) -> 49.2 (84.0) MB, 30.9 / 0.0 ms allocation failure [20872:0x7f26f24c70d0] 210 ms: Scavenge 63.5 (84.0) -> 62.4 (85.0) MB, 14.8 / 0.0 ms allocation failure [20872:0x7f26f24c70d0] 241 ms: Scavenge 64.7 (85.0) -> 64.6 (99.0) MB, 28.8 / 0.0 ms allocation failure [20872:0x7f26f24c70d0] 268 ms: Scavenge 78.2 (99.0) -> 77.6 (101.0) MB, 16.1 / 0.0 ms allocation failure [20872:0x7f26f24c70d0] 298 ms: Scavenge 80.4 (101.0) -> 80.3 (114.5) MB, 28.2 / 0.0 ms allocation failure [20872:0x7f26f24c70d0] 324 ms: Scavenge 93.5 (114.5) -> 92.9 (117.0) MB, 16.4 / 0.0 ms allocation failure [20872:0x7f26f24c70d0] 354 ms: Scavenge 96.2 (117.0) -> 96.0 (130.0) MB, 27.6 / 0.0 ms allocation failure [20872:0x7f26f24c70d0] 383 ms: Scavenge 108.8 (130.0) -> 108.2 (133.0) MB, 16.8 / 0.0 ms allocation failure [20872:0x7f26f24c70d0] 413 ms: Scavenge 111.9 (133.0) -> 111.7 (145.5) MB, 27.8 / 0.0 ms allocation failure [20872:0x7f26f24c70d0] 440 ms: Scavenge 124.1 (145.5) -> 123.5 (149.0) MB, 17.4 / 0.0 ms allocation failure [20872:0x7f26f24c70d0] 473 ms: Scavenge 127.6 (149.0) -> 127.4 (161.0) MB, 29.5 / 0.0 ms allocation failure [20872:0x7f26f24c70d0] 502 ms: Scavenge 139.4 (161.0) -> 138.8 (165.0) MB, 18.7 / 0.0 ms allocation failure [20872:0x7f26f24c70d0] 534 ms: Scavenge 143.3 (165.0) -> 143.1 (176.5) MB, 28.5 / 0.0 ms allocation failure [20872:0x7f26f24c70d0] 561 ms: Scavenge 154.7 (176.5) -> 154.2 (181.0) MB, 19.0 / 0.0 ms allocation failure [20872:0x7f26f24c70d0] 594 ms: Scavenge 158.9 (181.0) -> 158.7 (192.0) MB, 29.2 / 0.0 ms allocation failure [20872:0x7f26f24c70d0] 622 ms: Scavenge 170.0 (192.5) -> 169.5 (197.0) MB, 19.5 / 0.0 ms allocation failure [20872:0x7f26f24c70d0] 655 ms: Scavenge 174.6 (197.0) -> 174.3 (208.0) MB, 28.7 / 0.0 ms allocation failure [20872:0x7f26f24c70d0] 683 ms: Scavenge 185.4 (208.0) -> 184.9 (212.5) MB, 19.4 / 0.0 ms allocation failure [20872:0x7f26f24c70d0] 715 ms: Scavenge 190.2 (213.0) -> 190.0 (223.5) MB, 27.7 / 0.0 ms allocation failure [20872:0x7f26f24c70d0] 743 ms: Scavenge 200.7 (223.5) -> 200.3 (228.5) MB, 19.7 / 0.0 ms allocation failure [20872:0x7f26f24c70d0] 774 ms: Scavenge 205.8 (228.5) -> 205.6 (239.0) MB, 27.1 / 0.0 ms allocation failure [20872:0x7f26f24c70d0] 802 ms: Scavenge 216.1 (239.0) -> 215.7 (244.5) MB, 19.8 / 0.0 ms allocation failure [20872:0x7f26f24c70d0] 833 ms: Scavenge 221.4 (244.5) -> 221.2 (254.5) MB, 26.2 / 0.0 ms allocation failure [20872:0x7f26f24c70d0] 861 ms: Scavenge 231.5 (255.0) -> 231.1 (260.5) MB, 19.9 / 0.0 ms allocation failure [20872:0x7f26f24c70d0] 892 ms: Scavenge 237.0 (260.5) -> 236.7 (270.5) MB, 26.3 / 0.0 ms allocation failure [20872:0x7f26f24c70d0] 920 ms: Scavenge 246.9 (270.5) -> 246.5 (276.0) MB, 20.1 / 0.0 ms allocation failure [20872:0x7f26f24c70d0] 951 ms: Scavenge 252.6 (276.0) -> 252.3 (286.0) MB, 25.8 / 0.0 ms allocation failure [20872:0x7f26f24c70d0] 979 ms: Scavenge 262.3 (286.0) -> 261.9 (292.0) MB, 20.3 / 0.0 ms allocation failure [20872:0x7f26f24c70d0] 1014 ms: Scavenge 268.2 (292.0) -> 267.9 (301.5) MB, 29.8 / 0.0 ms allocation failure [20872:0x7f26f24c70d0] 1046 ms: Scavenge 277.7 (302.0) -> 277.3 (308.0) MB, 22.4 / 0.0 ms allocation failure [20872:0x7f26f24c70d0] 1077 ms: Scavenge 283.8 (308.0) -> 283.5 (317.5) MB, 25.1 / 0.0 ms allocation failure [20872:0x7f26f24c70d0] 1105 ms: Scavenge 293.1 (317.5) -> 292.7 (323.5) MB, 20.7 / 0.0 ms allocation failure [20872:0x7f26f24c70d0] 1135 ms: Scavenge 299.3 (323.5) -> 299.0 (333.0) MB, 24.9 / 0.0 ms allocation failure [20872:0x7f26f24c70d0] 1164 ms: Scavenge 308.6 (333.0) -> 308.1 (339.5) MB, 20.9 / 0.0 ms allocation failure [20872:0x7f26f24c70d0] 1194 ms: Scavenge 314.9 (339.5) -> 314.6 (349.0) MB, 25.0 / 0.0 ms allocation failure [20872:0x7f26f24c70d0] 1222 ms: Scavenge 324.0 (349.0) -> 323.6 (355.5) MB, 21.1 / 0.0 ms allocation failure [20872:0x7f26f24c70d0] 1253 ms: Scavenge 330.4 (355.5) -> 330.1 (364.5) MB, 25.1 / 0.0 ms allocation failure [20872:0x7f26f24c70d0] 1282 ms: Scavenge 339.4 (364.5) -> 339.0 (371.0) MB, 22.2 / 0.0 ms allocation failure [20872:0x7f26f24c70d0] 1315 ms: Scavenge 346.0 (371.0) -> 345.6 (380.0) MB, 25.8 / 0.0 ms allocation failure [20872:0x7f26f24c70d0] 1413 ms: Mark-sweep 349.9 (380.0) -> 54.2 (305.0) MB, 5.8 / 0.0 ms (+ 87.5 ms in 73 steps since start of marking, biggest step 8.2 ms, walltime since start of marking 131 ms) finalize incremental marking via stack guard GC in old space requested [20872:0x7f26f24c70d0] 1457 ms: Scavenge 65.8 (305.0) -> 65.1 (305.0) MB, 31.0 / 0.0 ms allocation failure [20872:0x7f26f24c70d0] 1489 ms: Scavenge 69.9 (305.0) -> 69.7 (305.0) MB, 27.1 / 0.0 ms allocation failure [20872:0x7f26f24c70d0] 1523 ms: Scavenge 80.9 (305.0) -> 80.4 (305.0) MB, 22.9 / 0.0 ms allocation failure [20872:0x7f26f24c70d0] 1553 ms: Scavenge 85.5 (305.0) -> 85.3 (305.0) MB, 24.2 / 0.0 ms allocation failure [20872:0x7f26f24c70d0] 1581 ms: Scavenge 96.3 (305.0) -> 95.7 (305.0) MB, 18.8 / 0.0 ms allocation failure [20872:0x7f26f24c70d0] 1616 ms: Scavenge 101.1 (305.0) -> 100.9 (305.0) MB, 29.2 / 0.0 ms allocation failure [20872:0x7f26f24c70d0] 1648 ms: Scavenge 111.6 (305.0) -> 111.1 (305.0) MB, 22.5 / 0.0 ms allocation failure [20872:0x7f26f24c70d0] 1678 ms: Scavenge 116.7 (305.0) -> 116.5 (305.0) MB, 25.0 / 0.0 ms allocation failure [20872:0x7f26f24c70d0] 1709 ms: Scavenge 127.0 (305.0) -> 126.5 (305.0) MB, 20.7 / 0.0 ms allocation failure [20872:0x7f26f24c70d0] 1738 ms: Scavenge 132.3 (305.0) -> 132.1 (305.0) MB, 23.9 / 0.0 ms allocation failure [20872:0x7f26f24c70d0] 1767 ms: Scavenge 142.4 (305.0) -> 141.9 (305.0) MB, 19.6 / 0.0 ms allocation failure [20872:0x7f26f24c70d0] 1796 ms: Scavenge 147.9 (305.0) -> 147.7 (305.0) MB, 23.8 / 0.0 ms allocation failure [20872:0x7f26f24c70d0] 1825 ms: Scavenge 157.8 (305.0) -> 157.3 (305.0) MB, 19.9 / 0.0 ms allocation failure [20872:0x7f26f24c70d0] 1853 ms: Scavenge 163.5 (305.0) -> 163.2 (305.0) MB, 22.2 / 0.0 ms allocation failure [20872:0x7f26f24c70d0] 1881 ms: Scavenge 173.2 (305.0) -> 172.7 (305.0) MB, 19.1 / 0.0 ms allocation failure [20872:0x7f26f24c70d0] 1910 ms: Scavenge 179.1 (305.0) -> 178.8 (305.0) MB, 23.0 / 0.0 ms allocation failure [20872:0x7f26f24c70d0] 1944 ms: Scavenge 188.6 (305.0) -> 188.1 (305.0) MB, 25.1 / 0.0 ms allocation failure [20872:0x7f26f24c70d0] 1979 ms: Scavenge 194.7 (305.0) -> 194.4 (305.0) MB, 28.4 / 0.0 ms allocation failure [20872:0x7f26f24c70d0] 2011 ms: Scavenge 204.0 (305.0) -> 203.6 (305.0) MB, 23.4 / 0.0 ms allocation failure [20872:0x7f26f24c70d0] 2041 ms: Scavenge 210.2 (305.0) -> 209.9 (305.0) MB, 23.8 / 0.0 ms allocation failure [20872:0x7f26f24c70d0] 2074 ms: Scavenge 219.4 (305.0) -> 219.0 (305.0) MB, 24.5 / 0.0 ms allocation failure [20872:0x7f26f24c70d0] 2105 ms: Scavenge 225.8 (305.0) -> 225.4 (305.0) MB, 24.7 / 0.0 ms allocation failure [20872:0x7f26f24c70d0] 2138 ms: Scavenge 234.8 (305.0) -> 234.4 (305.0) MB, 23.1 / 0.0 ms allocation failure [...SNIP...] $ : ( ). , allocation site pretenuring . (allocation sites), , . , — pretenure .
$ out/Release/d8 --trace-gc octane-splay.js [20885:0x7ff4d7c220a0] 8 ms: Scavenge 2.7 (6.0) -> 2.6 (7.0) MB, 1.2 / 0.0 ms allocation failure [20885:0x7ff4d7c220a0] 10 ms: Scavenge 2.7 (7.0) -> 2.7 (8.0) MB, 1.6 / 0.0 ms allocation failure [20885:0x7ff4d7c220a0] 11 ms: Scavenge 3.6 (8.0) -> 3.6 (10.0) MB, 0.9 / 0.0 ms allocation failure [20885:0x7ff4d7c220a0] 17 ms: Scavenge 4.8 (10.5) -> 4.7 (11.0) MB, 2.9 / 0.0 ms allocation failure [20885:0x7ff4d7c220a0] 20 ms: Scavenge 5.6 (11.0) -> 5.6 (16.0) MB, 2.8 / 0.0 ms allocation failure [20885:0x7ff4d7c220a0] 26 ms: Scavenge 8.7 (16.0) -> 8.6 (17.0) MB, 4.5 / 0.0 ms allocation failure [20885:0x7ff4d7c220a0] 34 ms: Scavenge 9.6 (17.0) -> 9.5 (28.0) MB, 6.8 / 0.0 ms allocation failure [20885:0x7ff4d7c220a0] 48 ms: Scavenge 16.6 (28.5) -> 16.4 (29.0) MB, 8.6 / 0.0 ms allocation failure [20885:0x7ff4d7c220a0] 64 ms: Scavenge 17.5 (29.0) -> 17.5 (52.0) MB, 15.2 / 0.0 ms allocation failure [20885:0x7ff4d7c220a0] 96 ms: Scavenge 32.3 (52.5) -> 32.0 (53.5) MB, 19.6 / 0.0 ms allocation failure [20885:0x7ff4d7c220a0] 153 ms: Scavenge 61.3 (81.5) -> 57.4 (93.5) MB, 27.9 / 0.0 ms allocation failure [20885:0x7ff4d7c220a0] 432 ms: Scavenge 339.3 (364.5) -> 326.6 (364.5) MB, 12.7 / 0.0 ms allocation failure [20885:0x7ff4d7c220a0] 666 ms: Scavenge 563.7 (592.5) -> 553.3 (595.5) MB, 20.5 / 0.0 ms allocation failure [20885:0x7ff4d7c220a0] 825 ms: Mark-sweep 603.9 (644.0) -> 96.0 (528.0) MB, 4.0 / 0.0 ms (+ 92.5 ms in 51 steps since start of marking, biggest step 4.6 ms, walltime since start of marking 160 ms) finalize incremental marking via stack guard GC in old space requested [20885:0x7ff4d7c220a0] 1068 ms: Scavenge 374.8 (528.0) -> 362.6 (528.0) MB, 19.1 / 0.0 ms allocation failure [20885:0x7ff4d7c220a0] 1304 ms: Mark-sweep 460.1 (528.0) -> 102.5 (444.5) MB, 10.3 / 0.0 ms (+ 117.1 ms in 59 steps since start of marking, biggest step 7.3 ms, walltime since start of marking 200 ms) finalize incremental marking via stack guard GC in old space requested [20885:0x7ff4d7c220a0] 1587 ms: Scavenge 374.2 (444.5) -> 361.6 (444.5) MB, 13.6 / 0.0 ms allocation failure [20885:0x7ff4d7c220a0] 1828 ms: Mark-sweep 485.2 (520.0) -> 101.5 (519.5) MB, 3.4 / 0.0 ms (+ 102.8 ms in 58 steps since start of marking, biggest step 4.5 ms, walltime since start of marking 183 ms) finalize incremental marking via stack guard GC in old space requested [20885:0x7ff4d7c220a0] 2028 ms: Scavenge 371.4 (519.5) -> 358.5 (519.5) MB, 12.1 / 0.0 ms allocation failure [...SNIP...] $ SplayLatency 250 %!
: arewefastyet.com .
SIGPLAN , , allocation site pretenuring . , . ( 1 , 2 , 3 ), allocation site pretenuring . , Ember.js (, - allocation site pretenuring).
allocation site pretenuring, , — , ( - , ). , , , (-) (-) (allocation site) tenured , . - , , , (incremental marking).
. , , Orinoco . (unified heap), , . : , , . , SplayLatency , . . (concurrent marking) , (throughput).
Conclusion
, , , - . , , , ! , . , , .

: 2016-: Chrome vs. Firefox vs. Edge, venturebeat.com .
, — . , JavaScript . , , . , Node.js ( V8, ChakraCore)!

: JavaScript- . , . JavaScript , . Chrome , . , , Speedometer , - .
Thank!
Source: https://habr.com/ru/post/318282/
All Articles