Smart, easy and cross-platform C ++ code profiler
Hello. A few months ago, we, together with victorzs, decided to make a simple and convenient c ++ code profiler (that is, profiling of the execution time of code sections and functions).
Screenshot profiling example from the CryEngine SDK
The existing solutions did not suit us for a number of reasons. We needed a quality profiler that could do the following:
')
As a result of careful study, a profiler was born that knows how to do all of the above, and more!
If you want to know how long your code works, and to have at the same time objective evidence, I ask you for the cat, where I will show you how to use the profiler.
The added blocks in the statistics collection mode take the smallest possible time (as we achieved this - in future articles on technical implementation). On a machine with a Core i7-5930K 3.5GHz processor, 16 Gb RAM, Win7 Pro in an application with 12 threads, the average "cost" of one block is about 10-15 nanoseconds! A similar result was achieved on Fedora 22 . Here is a measurement chart (on the x axis - the number of blocks, on y - nanoseconds per block):
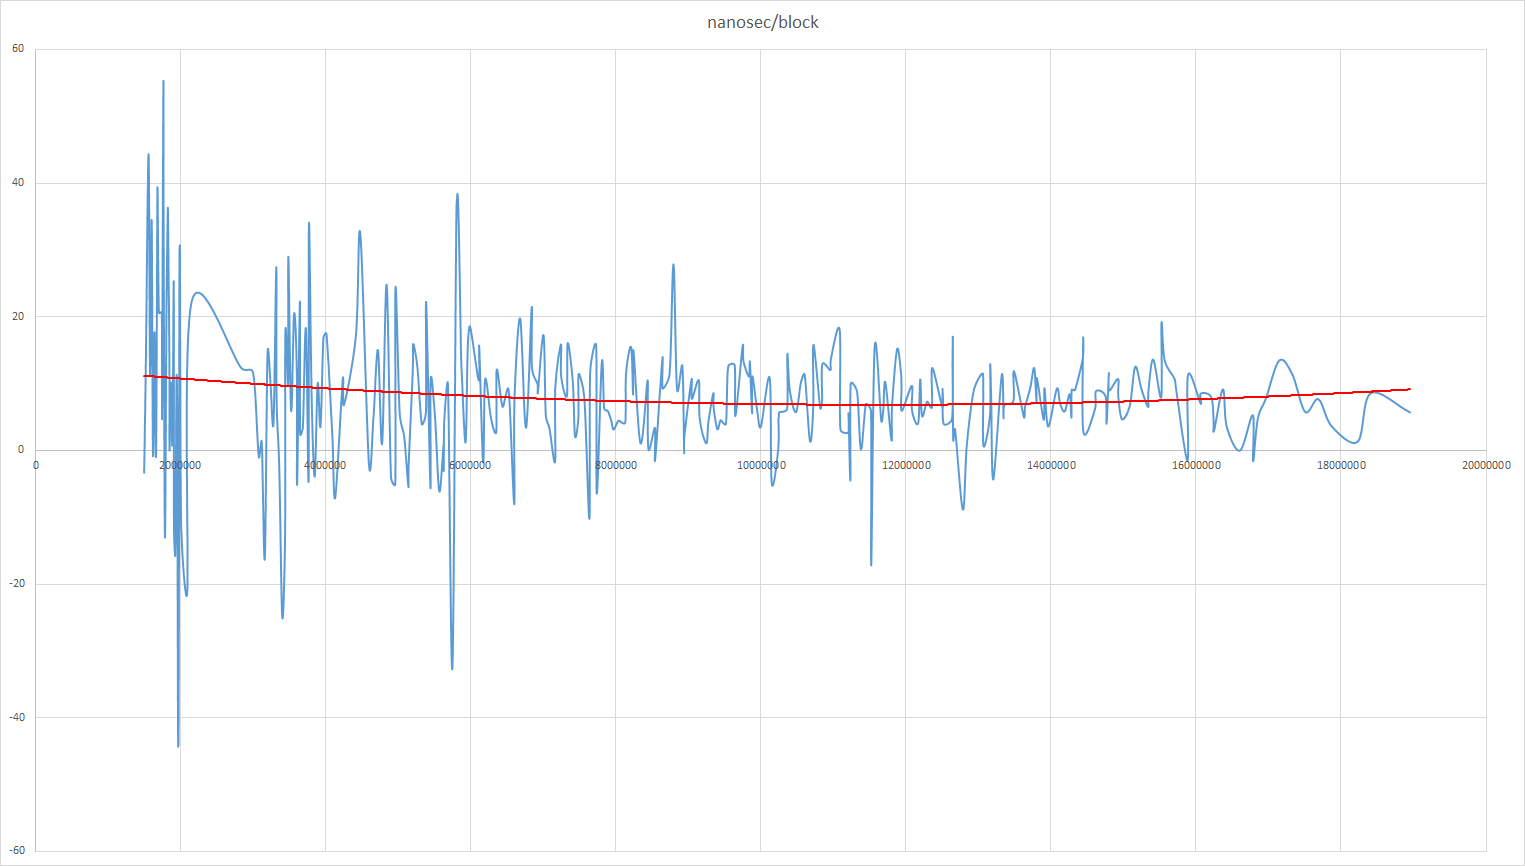
In addition, it can be seen that the dependence is linear - the number of blocks does not affect the temporal characteristic.
Obtaining and analyzing the results occurs in the program with the straightforward name profiler_gui (in the bin directory). The profiler can be initialized in two ways:
To get information about context switching in Windows, you need to run a profiled application with administrator rights. In linux, the situation is a bit more complicated: you need to run the script in the
Where
To demonstrate the capabilities of the results analyzer, we will profile a simple example from CryEngine. There are several profilers in CryEngine itself and for their organization there are macros into which it is easy to embed any profiler.
After compilation, we launch a test example, run the program profiler_gui , connect to the application (icon: , next to it, you can enter the ip-address or the name of the host on which the profiled application is running). After a successful connection (the icon turns green a bit:
  ) you can run a session profiling. After pressing the button
  will begin collecting statistics in the profiled application. To complete the profiling session, close the window that appears.
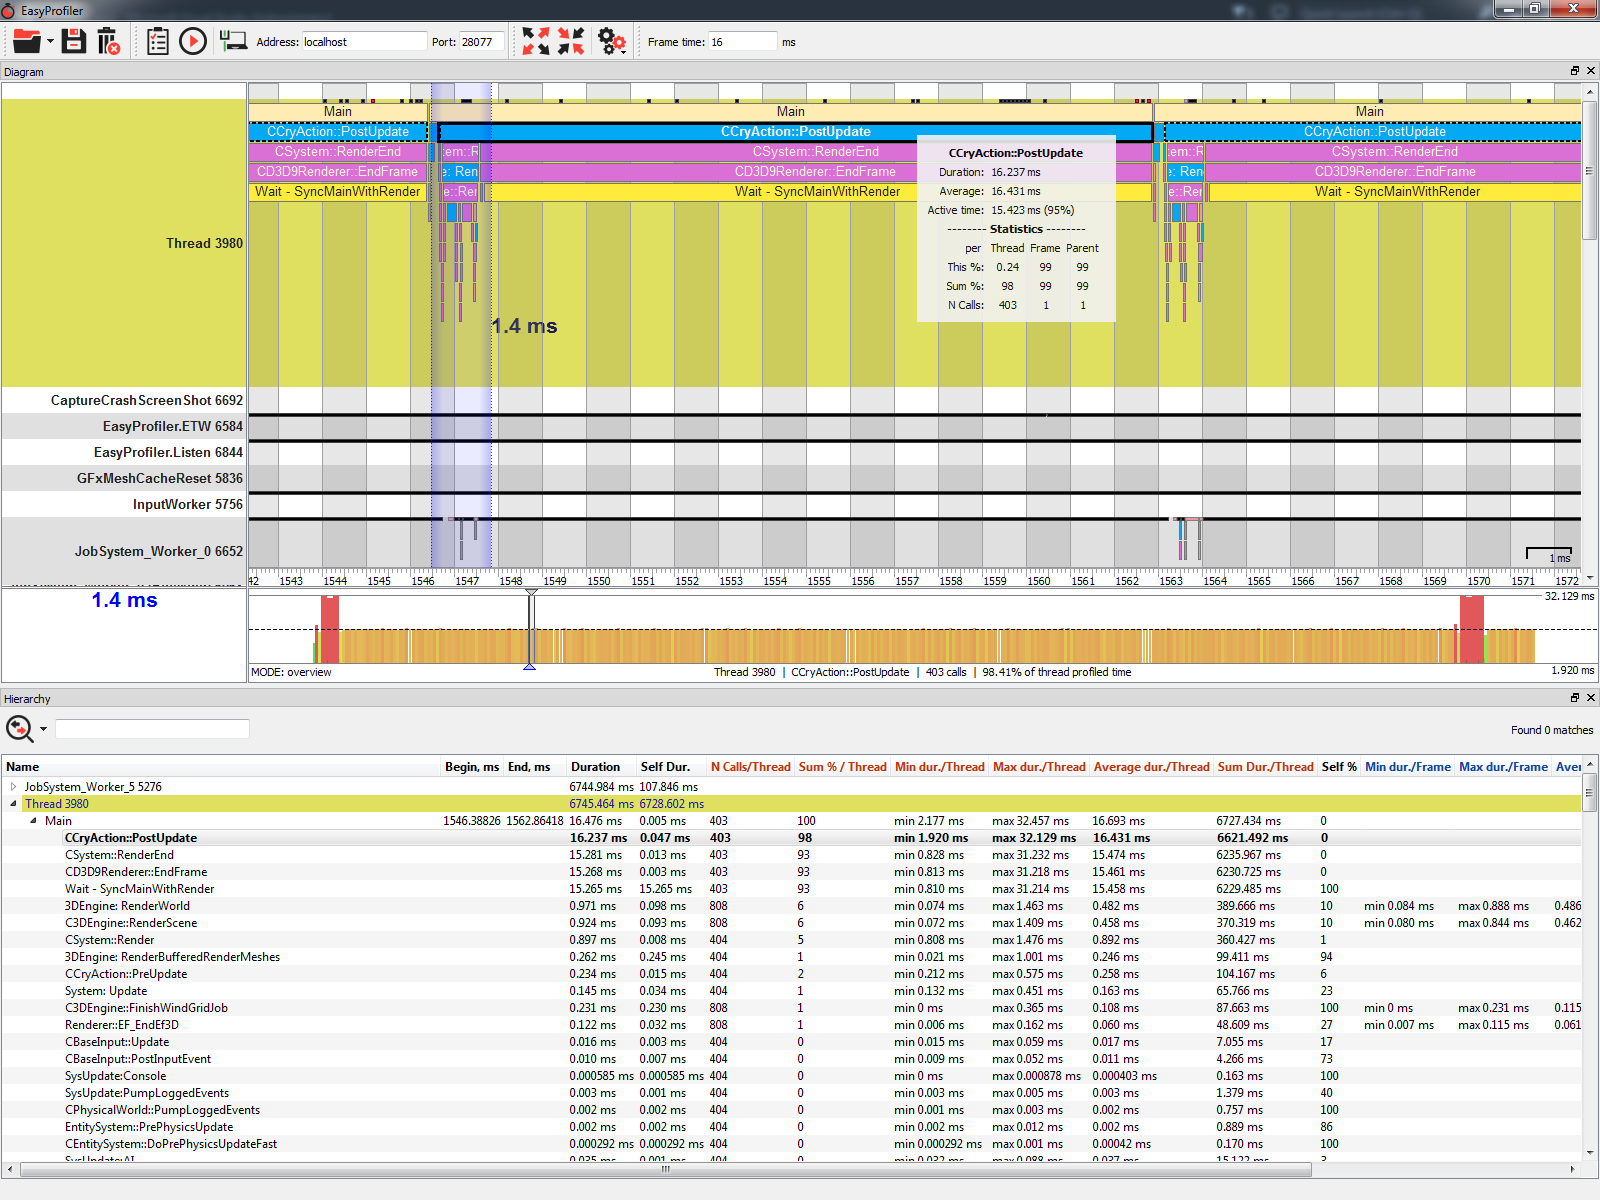
The screenshot shows the general view of the program with the result
In the upper part of the window there are running threads and saved blocks, the duration of which can be estimated on a horizontal scale. Vertically within each block its hierarchy is shown.
In the central part there is a diagram of the times of either the flow or the selected block. Here, the block execution time is estimated vertically, horizontally, the program execution time, i.e. You can watch the bursts of the duration of the blocks and, if necessary, assess the problem in more detail.
In the lower part, the block execution tree for the selected area is presented with detailed statistics. Here you can sort by duration, search for the longest blocks, estimate the number of calls of a particular block. The selection of a site is carried out in the upper part of the screen by pressing the right mouse button and highlighting the desired piece.
Brief statistics on the block can be viewed at the top of the screen. After hovering the cursor over the block, a pop-up window appears with a brief summary:

In this summary, information on the total duration of the total of all blocks of this type and how much this amount is per cent of the frame (the topmost parent for the given block), of the total flow time, and of its parent. In many cases this is exhaustive information.
Another very convenient feature is the dynamic on / off blocks. To do this, open a dialog (icon ) and in the window that appears, enable or disable the desired blocks. At the next profiling session these settings will be taken into account.
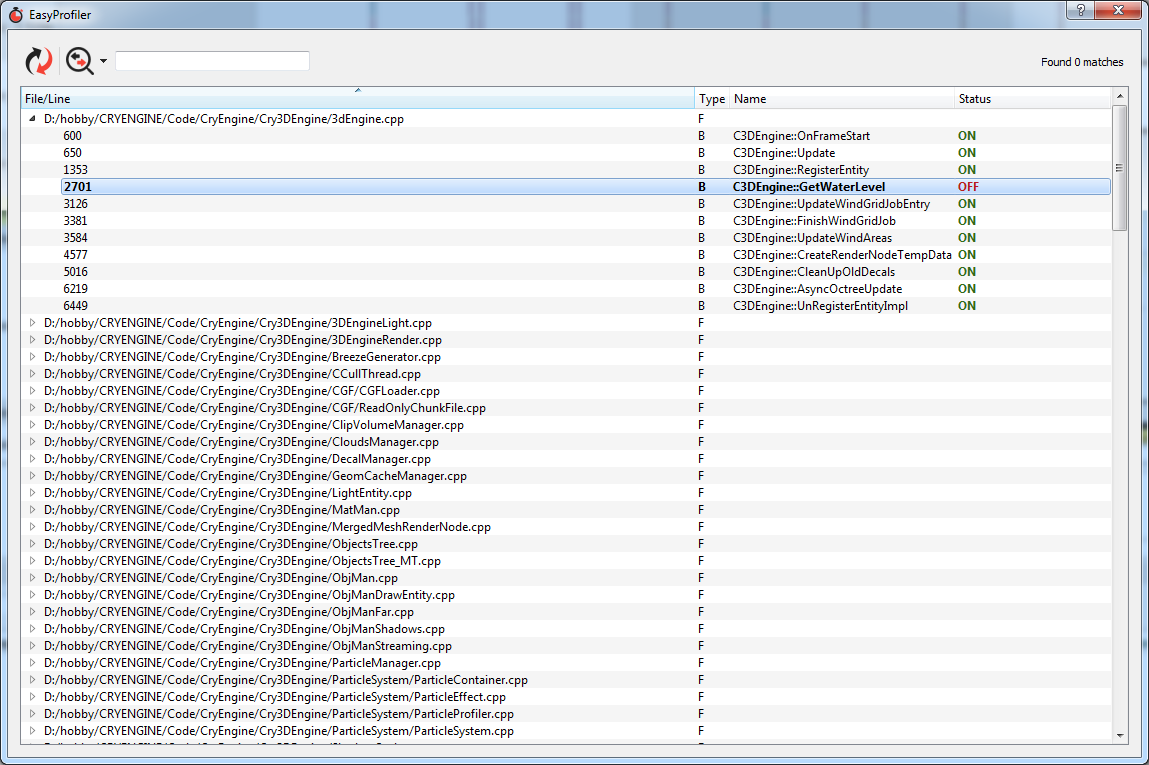
Turning off the collection of information for the function
So, the advantages of the profiler:
- Work speed
- Minimum memory cost
- Cross platform
- Convenient and functional graphical presentation
The only limitation of use is the need to build a profiled application with a compiler that supports the c ++ 11 standard.
This profiler will be useful both for developers of game engines (both AI and 3D), as well as for those who use ready-made engines, and for everyone who cares about the performance of their application. This profiler is used by us in the development of a visualization system for aviation and tactical simulators.
The license is either Apache 2.0 or GPL v.3 - both for libin and for gui. Use any of these licenses.
Thanks for attention! We look forward to receiving feedback (questions, suggestions,bugs , github stars, pull requests). During the development process, some non-standard problems were solved, about which I would like to write separate articles.
Screenshot profiling example from the CryEngine SDK
The existing solutions did not suit us for a number of reasons. We needed a quality profiler that could do the following:
')
- Profile selected code points
- Work on multiple platforms
- Consider context switching
- Require minimal memory overhead during profiling
- Do not impose additional time limits during the execution of the application. Agree, if the profiler will work longer than the profile-breaking piece of code, you can make incorrect conclusions.
As a result of careful study, a profiler was born that knows how to do all of the above, and more!
If you want to know how long your code works, and to have at the same time objective evidence, I ask you for the cat, where I will show you how to use the profiler.
Code integration
- Download and unpack the latest release from here: https://github.com/yse/easy_profiler/releases
- If you use
CMaketo build, then- Determine the variable
CMAKE_PREFIX_PATHthat points to the<easy_profiler_release_dir>/cmake/easy_profilerfrom the release - Use
find_package(easy_profiler REQUIRED)andtarget_link_libraries(... easy_profiler)
Otherwise:- Writing the compiler directory to search for header files:
<easy_profiler_release_dir>/include - Register the directory for searching libraries for the linker:
<easy_profiler_release_dir>/bin
- Determine the variable
BUILD_WITH_EASY_PROFILERdefinition to the compiler:BUILD_WITH_EASY_PROFILER- We add blocks in those places of the code which we want to measure. For example:
#include <easy/profiler.h> void foo() { EASY_FUNCTION(profiler::colors::Magenta);// , EASY_BLOCK("Calculating sum");// int sum = 0; for (int i = 0; i < 10; ++i) { EASY_BLOCK("Addition", profiler::colors::Red);// sum += i; } EASY_END_BLOCK; // ( "Calculating sum" EASY_BLOCK("Calculating multiplication", profiler::colors::Blue500); int mul = 1; for (int i = 1; i < 11; ++i) mul *= i; // . , "Calculating multiplication" "foo" } - Do not forget to put the easy_profiler library ( * .dll or * .so ) next to the assembled application. Or we write the
<easy_profiler_release_dir>/bindirectory in the system variablePATH(in Linux is enough inLD_LIBRARY_PATH)
The added blocks in the statistics collection mode take the smallest possible time (as we achieved this - in future articles on technical implementation). On a machine with a Core i7-5930K 3.5GHz processor, 16 Gb RAM, Win7 Pro in an application with 12 threads, the average "cost" of one block is about 10-15 nanoseconds! A similar result was achieved on Fedora 22 . Here is a measurement chart (on the x axis - the number of blocks, on y - nanoseconds per block):
In addition, it can be seen that the dependence is linear - the number of blocks does not affect the temporal characteristic.
Profiling
Obtaining and analyzing the results occurs in the program with the straightforward name profiler_gui (in the bin directory). The profiler can be initialized in two ways:
- Connecting by socket application profiler_gui . To do this, you need to initialize the listening of the socket in the profiled application. This is done simply:
profiler::startListen();
This function starts a stream that listens on port28077(the port can be changed by a parameter in the functionprofiler::startListen(portNumber)) of the control command. You can stop listening by calling a function (although this is not necessary at all):profiler::stopListen();
The collection of blocks begins after the profiler_gui connection to the profiled application and pressing the “Capture” button on the toolbar. After the profiling is stopped (click on “Stop” ), the collected information is transmitted through the socket from the profiled application in profiler_gui and immediately saved to disk in the easy_profiler.cache file. You can also save all the information to a separate file (this simply moves the easy_profiler.cache file). - Saving the result to a file. To do this, you first need to initialize the profiler, and then save the file when necessary. This is done as follows:
int main() { EASY_PROFILER_ENABLE; /* do work*/ profiler::dumpBlocksToFile("test_profile.prof"); }
After that, the saved files can be opened in the program profiler_gui
To get information about context switching in Windows, you need to run a profiled application with administrator rights. In linux, the situation is a bit more complicated: you need to run the script in the
scripts/context_switch_logger.stp with parameters with root privileges. This script is interpreted by the systemtap program. In Fedora, run the command: #stap -o /tmp/cs_profiling_info.log scripts/context_switch_logger.stp name APPLICATION_NAME Where
APPLICATION_NAME is the name of the application to be profiled, /tmp/cs_profiling_info.log is the file where information about context switches is recorded. Superuser privileges are necessary because context switching information can only be obtained in kernel space.Results analysis
To demonstrate the capabilities of the results analyzer, we will profile a simple example from CryEngine. There are several profilers in CryEngine itself and for their organization there are macros into which it is easy to embed any profiler.
After compilation, we launch a test example, run the program profiler_gui , connect to the application (icon:
, next to it, you can enter the ip-address or the name of the host on which the profiled application is running). After a successful connection (the icon turns green a bit: ) you can run a session profiling. After pressing the button will begin collecting statistics in the profiled application. To complete the profiling session, close the window that appears.The screenshot shows the general view of the program with the result
In the upper part of the window there are running threads and saved blocks, the duration of which can be estimated on a horizontal scale. Vertically within each block its hierarchy is shown.
In the central part there is a diagram of the times of either the flow or the selected block. Here, the block execution time is estimated vertically, horizontally, the program execution time, i.e. You can watch the bursts of the duration of the blocks and, if necessary, assess the problem in more detail.
In the lower part, the block execution tree for the selected area is presented with detailed statistics. Here you can sort by duration, search for the longest blocks, estimate the number of calls of a particular block. The selection of a site is carried out in the upper part of the screen by pressing the right mouse button and highlighting the desired piece.
Brief statistics on the block can be viewed at the top of the screen. After hovering the cursor over the block, a pop-up window appears with a brief summary:
In this summary, information on the total duration of the total of all blocks of this type and how much this amount is per cent of the frame (the topmost parent for the given block), of the total flow time, and of its parent. In many cases this is exhaustive information.
Another very convenient feature is the dynamic on / off blocks. To do this, open a dialog (icon
) and in the window that appears, enable or disable the desired blocks. At the next profiling session these settings will be taken into account.Turning off the collection of information for the function
C3DEngine::GetWaterLevelSo, the advantages of the profiler:
- Work speed
- Minimum memory cost
- Cross platform
- Convenient and functional graphical presentation
The only limitation of use is the need to build a profiled application with a compiler that supports the c ++ 11 standard.
This profiler will be useful both for developers of game engines (both AI and 3D), as well as for those who use ready-made engines, and for everyone who cares about the performance of their application. This profiler is used by us in the development of a visualization system for aviation and tactical simulators.
The license is either Apache 2.0 or GPL v.3 - both for libin and for gui. Use any of these licenses.
Thanks for attention! We look forward to receiving feedback (questions, suggestions,
Source: https://habr.com/ru/post/318142/
All Articles