Convert data presentation form using Excel + PowerQuery

In our managerial work there is a lot of good and not so much. But nothing spoils our life as many echelki, in which we constantly need something to do, to sum up, to sum up, and to do other routine operations, which take a lot of time and effort. There is a tool that allows, if not to remove, then minimize the routine wherever there are data patterns. So, your attention is invited to a little deeper immersion in the principles of PowerQuery.
Immediately I want to give guidance about what is already on Habré on this topic:
- https://habrahabr.ru/post/271019/ - An excellent overview of the PowerQuery features for beginners. Gives an idea of the tool with examples. If you have never used PowerQuery, then you should probably start with this article. The author will bring up to date.
- https://habrahabr.ru/post/311600/ - Immersion in the function of the language "M" on the example of localization of the list of months. The author briefly touched upon the powerful function List.Accumulate, the description of which deserves a separate material on Habré. As a teaser for such a publication, I can say that List.Accumulate accepts absolutely any type of argument as input.
') - https://habrahabr.ru/post/274615/ - A brief overview of PowerQuery’s ability to retrieve data from SQL databases. For newbies
What is Power Query (PQ)
In order not to repeat what has already been said in the materials referenced above, I will be brief: Power Query is a tool for transforming the presentation form of any logically organized data. That is, any porridge can be at the entrance, but in which there is at least some logic. And at the exit - the table. According to some experts , PQ is an ETL tool. That is, it serves for Extract - Extract, Transform - Transform and Load - Data Upload. By experience, this work takes up to 60% of the working time, for example, a contextual advertising manager and up to 90% of the analyst time. An important feature of this work is that, as a rule, it must be repeated from day to day, week by week. Infinitely transfer data, copy-paste, calculate. For especially difficult cases, programmers write a solution in which all this is done automatically. The problem is that solutions are expensive, and programmers are almost always busy with more pressing issues than automating manager’s routine operations. PQ solves these difficulties:
- Automatically pull data from almost anywhere
- Convert data in accordance with a previously created model, without having to repeat the same actions manually again.
- Present the data in the form (s) that are needed
Immediately let's differentiate Power Query and the Power BI tool, which is very similar to it. So, Power Query is used to convert data, as a rule, into a convenient tabular view with which we work further in Excel. Power BI is designed to convert data and translate it into a form of graphs and other generalized views (for example, summary tables). Power BI and Power Query use the same “M” language for data conversion. That is, the “M” language code can be almost literally transferred by copy-paste from PQ to Power BI and back. Almost, because in PQ there may be specific constructions for accessing the Excel workbook, or named ranges of cells, which, of course, is not applicable to Power BI.
To date, Power Query is available only for MS Excel, running under Windows. Prior to Excel 2013, inclusive, distributed as a plug-in . Starting with Excel 2016 has become embedded.
Methods of data conversion "buttons" are discussed in detail in the articles mentioned above, especially in the first one. Further, the article will be somewhat complicated for beginners, since we are sorting out the background, and specifically what can be seen when clicking on the Advanced Editor button in the query editor.
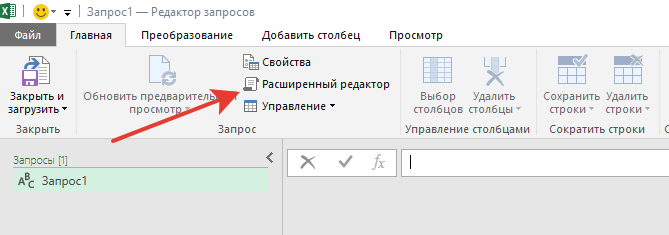
Advanced Editor Button
How is the language «M»
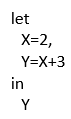
It is important to always keep in mind that the let construction ... in ... is just “ syntactic sugar ”. let in fact is a record with a set of pairs of the form “name = value”, and in is just a link to some value in this record (and not necessarily the last one). It's hard. But let's try to figure it out. The language "M" has the following types of values:
- Primitive types (Null, Logical, Number, Text, Date, Time, DateTime, DateTimeZone, Duration): “string”, 14, false, #date (2013,3,8), etc.
- List (List) - a sequence of values: Source = {1,2,3, "hi"}
- Record - a pair (or set of pairs) of the form: [a = 1, b = {1,2,3}, c = true]
- Table (Table) is a construction that includes a list of columns and a list of records: #table ({"Col1", "Col2"}, {{1, 2}, {3, 4}})
- Function (Function) - construction of the form:
MyFunction = (x, y, optional z) =>
if z = null then x+y
else (x+y) / z - Type (Type) - for classifying other values. For details on this type, see the “M” language specification.
- Binary : #binary ({0x68, 0x65, 0x6C})
Thus, the following construction:
Absolutely identical to this:
[X=2,Y=X+3][Y]Calculations are based on the values obtained as a result of previous actions. Something like this Excel formula chain:
A1=A2+A3
A2=A3+2
A3=5
In the case of PQ, the reference is not to cells, but to values. Expressions that are included in the record or list are calculated by the method of "lazy" calculations. That is, until we directly refer to the value resulting from the execution of some expression, it will not be executed.
Short sections
PQ uses the concept of sections. Section - creates a scope. This is something like the $ scope in Angular. There is an internal #sections variable that returns all available sections. All actions that are performed in the document belong to one single section: Section1. It is not possible to create another section, for example, Section2. However, we can refer to the elements of other sections using the #shared variable. This variable addresses the record containing all the elements that we can see: created by us, as well as the types, constants, and functions available to us. Thus, we do not need to crawl into the “M” language guide every time in order to recall the name of one or another function. Just access the #shared variable. When clicking on an empty field around the name of each function, we can see its description at the bottom of the screen.

The value of the #shared variable. You can see the quick reference on the built-in function.
In conclusion, I would like to remind you that any, even the most complex constructions of the language “M” are inherently composed of the types indicated above. In the overwhelming majority of cases, these are records and lists, plus some built-in functions for conversions. To make it easier to navigate the variety of available functionality, here are some useful links that I use regularly.
useful links
- Power Query Formula Language Specification (August 2015) .pdf
- Power Query (informally known as "M") Formula reference
- Power Query Training is a resource with a bunch of free samples and tricks. There are both free and paid lessons.
- Language file Notepad ++ to highlight the syntax of the language "M"
- The repository of Max Zelensky's Power Query guru on Github with a bunch of ready-made functions in the “M” language - Max developed an algorithm that loads the functions you need to work. See Readme.md
Source: https://habr.com/ru/post/318058/
All Articles