December release of ReSharper Ultimate 2016.3
Hi, Habr!
For more than a year, we have not shared news about releases in the ReSharper Ultimate family of tools here. This does not mean that the work got up, on the contrary: it was a lot.
Readers of our English-language blog already know that in ReSharper 2016.3 there was initial support for Visual Studio 2017, C # 7, VB.NET 15 and the ability to run and debug .NET Core unit tests. Under the cat you will find an overview of these and other updates in .NET products and in ReSharper C ++.
')

All the tools in ReSharper Ultimate can be installed in Visual Studio 2017 RC. There are several new Visual Studio features that we are working on supporting and will present fixes in the next updates. Now, ReSharper does not support the mode of incremental loading of solutions ( Lightweight Solution Load ) and .NET Core unit tests. To work with ReSharper C ++, disable the Enable Faster Projects Load option in the Visual Studio text editor settings.
ReSharper recognizes C # 7 local functions and provides many code inspections in their context, such as Possible System.NullReferenceException , Access to disposed closure, and Access to modified closure .
In C # 7, the out variables are supported and the pattern matching for the
Binary literals in C # 7 and VB.NET 15 are recognized, and they can be converted to hexadecimal system, as well as to add a separator.
We improved the Generate (Alt + Ins) mechanism for C # and VB.NET and supplemented it with three new actions for generating the Relational members, Relational comparer and Dispose template.
Generate relational members overload comparison operators (>, <, ≥, ≤) and implements the
Checking parameters for null is now available for the Generate constructor generator. When the Check parameters for null option is selected, a security code is created that throws an
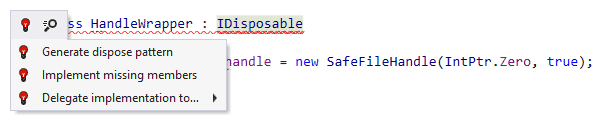
Use the Generate Dispose pattern to implement the
Let me remind you that the Generate menu is caused by the Alt + Ins key combination. Actions that implement the
In ReSharper 2016.3, a quick fix (quick-fix) appeared, with which fields and properties are created for unused arguments. Previously, this action was performed for only one argument, but now the fields and auto-properties are generated immediately for all arguments. You can set the type of property to be generated by selecting the corresponding value in the Configure default menu.

A new context action has appeared for fields of type

New refactoring Transform Parameters replaced the other two: Transform Out Parameters and Extract Class from Parameters. It rewrites the parameters of the method, changing the input parameters to a new class or tuple. You can create a new class for the return value or any output parameter. As always, Transform Parameters refactoring is called from the Refactor This menu (Ctrl + Shift + R).

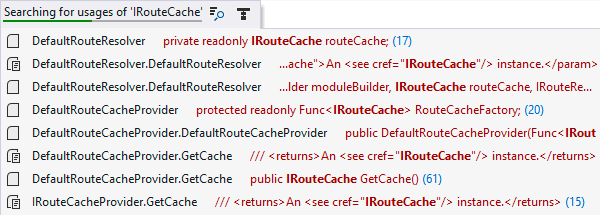
We updated the search engine for occurrences, making it easier to find references to frequently used characters. The Show in Find Results button has been added to the Search for usages (Shift + Alt + F12) popup window. If the search takes a long time, click this button (or + on the digital block) and continue working on the project while the search is being performed in the Find Results window . This window is now also filled asynchronously, allowing you to work with partial search results.
We also worked on presenting information in the Recent Files and Recent Edits windows . Now they show the file path to avoid confusion in the case of identical names. In Recent Files, you can delete entries using the Delete key. In Recent Edits, several changes in the same method are combined into one record.
Go to Text has added support for new file formats: .less, .hbs, .coffee, .scss, .dart, .as, .styl.
ReSharper has a new option, Remember last search . If you enable it and perform a search, its results will be displayed in the window the next time you call Go to Everything , Go to Text and other search commands. This is useful if the first search result that you clicked did not match, and you want to look like other results.
Using ReSharper Build allows you to reduce the time to build a solution, because rebuilt only projects in which there were changes. The build results are now displayed in a separate window, Build Results , which provides a number of options for easily viewing warnings and errors. You can show or hide warnings, display the error code in the preview window, and group the results by various criteria.

ReSharper Build has got its own NuGet (NuGet Restore) package recovery mechanism. Previously, you had to use NuGet integration in Visual Studio, but this worked only in version 2015. Now the recovery mechanism works in all versions of Visual Studio, provided that you have .NET Framework 4.5 or higher installed.
Minor changes appeared in the ReSharper Build options. Of the most interesting is the output of the error log in the Output Visual Studio window or the writing of a log to a file.
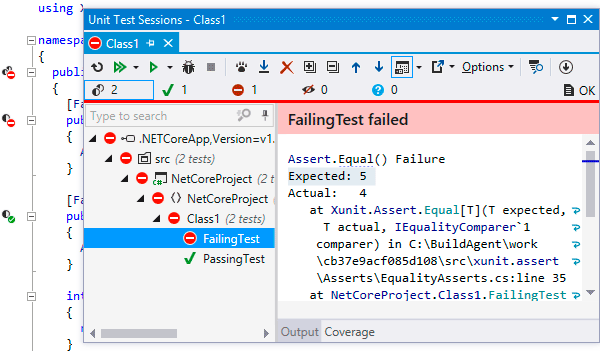
We have improved .NET Core support in all ReSharper Ultimate tools. ReSharper now allows you to run xUnit and NUnit unit tests in .NET Core and ASP.NET Core 1.0.x projects in Visual Studio 2015. Everything you used to do with tests for the .NET Framework — run, debug, organize by session — Now available in .NET Core projects.
dotCover is now able to measure code coverage with unit tests in .NET Core projects.
In dotTrace and dotMemory, you can profile performance and memory consumption in .NET Core applications. To do this, select the type of profiling .NET Core Application and specify the path to the application.

In TypeScript, code completion for string literals appeared . If we have a method with a certain set of parameters, then code completion will show them. This also works for numbers.
Go to Implementation (Ctrl + F12) works for TypeScript types. Pass from basic type to any of its implementations, having passed the intermediate steps in a chain of inheritance. Structural Navigation using the Tab or Shift + Tab keys works in JavaScript, TypeScript and JSON.
New quick fix Surround with type guard generates a type check of variables. In the example below, we added type protection for padding to eliminate the error if the variable contains a number.
We also added support for CSS, JSON, and JavaScript code in string literals . In C #, TypeScript, or JavaScript, you can assign a specific language to a string literal to access ReSharper's code analysis and autocompletion functions. You can do this in two ways: using the Alt + Enter keyboard shortcut, invoke the context action Mark as or add a comment with the following syntax:
ReSharper automatically recognizes code in literals for well-known scripts, such as inserting JavaScript code into AngularJS or CSS templates into
Finally, in ReSharper, there is a new option to customize the work with third-party code. On the Third-Party Code page, you can mark JavaScript, TypeScript or JSON files as “Skipped code” or “Library code”, thus excluding third-party code from indexing and inspections of ReSharper.

In the ReSharper Assembly Explorer window, you can now open the assembly by downloading it directly from nuget.org or another package repository.

After downloading the selected package, you can explore its assemblies, namespaces, and types.
Offline dotPeek now displays .NET metadata of assemblies: tables, blobs, rows, etc. The Assembly Explorer window allows you to automatically find and display occurrences of table metadata elements, decode and display BLOB values, examine the headers of a PE file. And, of course, you can see the decompiled code for any metadata item.

In dotCover, the code highlighting mechanism has changed. Previously, test-covered lines of code were highlighted in green, and uncovered - in red. Instead, colored markers appeared in the text editor that show both the status of the code coverage and the status of the unit tests covering them. A green marker next to the line means that all instructions on this line are covered and tests pass. Red - tests related to the current instruction do not work. A gray marker indicates that the instruction is not covered by tests.

In Timeline mode, there is a new option Collect native allocations , which can be selected before starting the profiler. Then, when analyzing the profiling data, you can filter the events for accessing native memory (Native Memory Allocation) to identify places in the code with possible memory leaks, problems using unmanaged components in your managed code, etc.

Timeline viewer now contains subsystems (Subsystems) - one of the best features of the Performance Viewer. The mechanics of subsystems is simple: in most cases, each subsystem groups calls made in a specific namespace or assembly. This information is useful for quickly assessing the distribution of time in a particular subtree of a call among various components: user and system code, WPF, LINQ, collections, strings, etc.
If you use third-party frameworks in your solution, add the appropriate subsystems to dotTrace. Even a quick glance at the subsystems in the call tree will allow you to understand how much time in this tree is spent on one or another framework.
The Call Stack window has received a whole bunch of improvements. We have returned the Show system functions option, useful for analyzing the runtime of methods. The list of methods in addition to the time of each method shows the total time of the subtree of the call. Click on method time or total time to apply a filter on the corresponding method or method and its subtree.
In dotTrace 2016.3, we added a new Events window, in which all events are visible during profiling: file operations, JIT, SQL queries, etc.

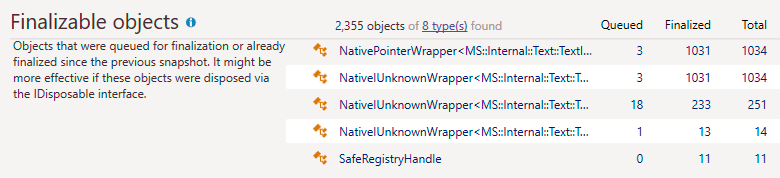
dotMemory provides a series of automated inspections to diagnose memory leaks. In addition to detecting duplicate rows, sparse arrays and other problems, dotMemory now allows you to check the application for completed objects and objects in the queue for completion. These objects, sorted by type, are shown in the Finalizable objects section, and are candidates for implementation of the
Postfix autocompletions and patterns - one of the most interesting updates coming from ReSharper, will allow you to focus entirely on data, rather than syntax. When you add a period (.) Or an arrow (->) after an expression, ReSharper C ++ offers free functions that can accept this expression as the first parameter. Postfix patterns help save time when you need to change an expression. Wrap your expression using if, else, while, do, return, switch, and foreach patterns, adding the appropriate postfix.

We added new typedef refactorings . Introduce typedef quickly determines the type for the selected data type and replaces this type and all its entries with a new typedef. Inline typedef does the opposite: replaces an existing typedef with an actual data type.
Back in ReSharper C ++, there was support for the Catch test framework, the ability to analyze code from the command line, and much more. In the video review, our technical evangelist Phil Nash told in detail about all the updates in ReSharper C ++:
This article describes the most notable updates ReSharper Ultimate. More details can be found on the What's New page. There you can download products .
As always, we welcome your comments. Be sure to write about your experience using the tools, suggestions and problems encountered here or in our bug tracker .
Thank you for your attention and to new releases;)
For more than a year, we have not shared news about releases in the ReSharper Ultimate family of tools here. This does not mean that the work got up, on the contrary: it was a lot.
Readers of our English-language blog already know that in ReSharper 2016.3 there was initial support for Visual Studio 2017, C # 7, VB.NET 15 and the ability to run and debug .NET Core unit tests. Under the cat you will find an overview of these and other updates in .NET products and in ReSharper C ++.
')
Compatible with Visual Studio 2017 RC
All the tools in ReSharper Ultimate can be installed in Visual Studio 2017 RC. There are several new Visual Studio features that we are working on supporting and will present fixes in the next updates. Now, ReSharper does not support the mode of incremental loading of solutions ( Lightweight Solution Load ) and .NET Core unit tests. To work with ReSharper C ++, disable the Enable Faster Projects Load option in the Visual Studio text editor settings.
Initial support for C # 7 and VB.NET 15
ReSharper recognizes C # 7 local functions and provides many code inspections in their context, such as Possible System.NullReferenceException , Access to disposed closure, and Access to modified closure .
In C # 7, the out variables are supported and the pattern matching for the
is and case constructs in the switch .Binary literals in C # 7 and VB.NET 15 are recognized, and they can be converted to hexadecimal system, as well as to add a separator.
More code generators
We improved the Generate (Alt + Ins) mechanism for C # and VB.NET and supplemented it with three new actions for generating the Relational members, Relational comparer and Dispose template.
Generate relational members overload comparison operators (>, <, ≥, ≤) and implements the
IComparable and IComparable<T> interfaces using the selected fields and properties. Generate relational comparer creates a class for comparing selected objects inherited from Comparer<T> . ReSharper also defines the field types: if the class contains string fields, you can select an option to compare strings and turn on null checking.Checking parameters for null is now available for the Generate constructor generator. When the Check parameters for null option is selected, a security code is created that throws an
ArgumentNullException exception in the constructor.Use the Generate Dispose pattern to implement the
IDisposable interface with additional null checks and a destructor for unmanaged resources.Let me remind you that the Generate menu is caused by the Alt + Ins key combination. Actions that implement the
IDisposable , IEquatable<T> and IComparable<T> interfaces are available by Alt + Enter on the highlighted code snippet.New contextual actions, quick fixes and refactoring
In ReSharper 2016.3, a quick fix (quick-fix) appeared, with which fields and properties are created for unused arguments. Previously, this action was performed for only one argument, but now the fields and auto-properties are generated immediately for all arguments. You can set the type of property to be generated by selecting the corresponding value in the Configure default menu.
A new context action has appeared for fields of type
Lazy<T> , which creates a property to encapsulate fieldname.Value .New refactoring Transform Parameters replaced the other two: Transform Out Parameters and Extract Class from Parameters. It rewrites the parameters of the method, changing the input parameters to a new class or tuple. You can create a new class for the return value or any output parameter. As always, Transform Parameters refactoring is called from the Refactor This menu (Ctrl + Shift + R).
Navigation and search have become more convenient.
We updated the search engine for occurrences, making it easier to find references to frequently used characters. The Show in Find Results button has been added to the Search for usages (Shift + Alt + F12) popup window. If the search takes a long time, click this button (or + on the digital block) and continue working on the project while the search is being performed in the Find Results window . This window is now also filled asynchronously, allowing you to work with partial search results.
We also worked on presenting information in the Recent Files and Recent Edits windows . Now they show the file path to avoid confusion in the case of identical names. In Recent Files, you can delete entries using the Delete key. In Recent Edits, several changes in the same method are combined into one record.
Go to Text has added support for new file formats: .less, .hbs, .coffee, .scss, .dart, .as, .styl.
ReSharper has a new option, Remember last search . If you enable it and perform a search, its results will be displayed in the window the next time you call Go to Everything , Go to Text and other search commands. This is useful if the first search result that you clicked did not match, and you want to look like other results.
ReSharper Build
Using ReSharper Build allows you to reduce the time to build a solution, because rebuilt only projects in which there were changes. The build results are now displayed in a separate window, Build Results , which provides a number of options for easily viewing warnings and errors. You can show or hide warnings, display the error code in the preview window, and group the results by various criteria.
ReSharper Build has got its own NuGet (NuGet Restore) package recovery mechanism. Previously, you had to use NuGet integration in Visual Studio, but this worked only in version 2015. Now the recovery mechanism works in all versions of Visual Studio, provided that you have .NET Framework 4.5 or higher installed.
Minor changes appeared in the ReSharper Build options. Of the most interesting is the output of the error log in the Output Visual Studio window or the writing of a log to a file.
.NET Core support
We have improved .NET Core support in all ReSharper Ultimate tools. ReSharper now allows you to run xUnit and NUnit unit tests in .NET Core and ASP.NET Core 1.0.x projects in Visual Studio 2015. Everything you used to do with tests for the .NET Framework — run, debug, organize by session — Now available in .NET Core projects.
dotCover is now able to measure code coverage with unit tests in .NET Core projects.
In dotTrace and dotMemory, you can profile performance and memory consumption in .NET Core applications. To do this, select the type of profiling .NET Core Application and specify the path to the application.
Improved TypeScript, JavaScript and JSON support in ReSharper
In TypeScript, code completion for string literals appeared . If we have a method with a certain set of parameters, then code completion will show them. This also works for numbers.
Go to Implementation (Ctrl + F12) works for TypeScript types. Pass from basic type to any of its implementations, having passed the intermediate steps in a chain of inheritance. Structural Navigation using the Tab or Shift + Tab keys works in JavaScript, TypeScript and JSON.
New quick fix Surround with type guard generates a type check of variables. In the example below, we added type protection for padding to eliminate the error if the variable contains a number.
We also added support for CSS, JSON, and JavaScript code in string literals . In C #, TypeScript, or JavaScript, you can assign a specific language to a string literal to access ReSharper's code analysis and autocompletion functions. You can do this in two ways: using the Alt + Enter keyboard shortcut, invoke the context action Mark as or add a comment with the following syntax:
//language=javascript|html|regexp|jsregexp|json|cssReSharper automatically recognizes code in literals for well-known scripts, such as inserting JavaScript code into AngularJS or CSS templates into
$[] jQuery indexers. You can enable or disable automatic code support in string literals in ReSharper options: Options | Code Editing | Language Injections .Finally, in ReSharper, there is a new option to customize the work with third-party code. On the Third-Party Code page, you can mark JavaScript, TypeScript or JSON files as “Skipped code” or “Library code”, thus excluding third-party code from indexing and inspections of ReSharper.
Decompiler in ReSharper and dotPeek
In the ReSharper Assembly Explorer window, you can now open the assembly by downloading it directly from nuget.org or another package repository.
After downloading the selected package, you can explore its assemblies, namespaces, and types.
Offline dotPeek now displays .NET metadata of assemblies: tables, blobs, rows, etc. The Assembly Explorer window allows you to automatically find and display occurrences of table metadata elements, decode and display BLOB values, examine the headers of a PE file. And, of course, you can see the decompiled code for any metadata item.
New highlight code in dotCover
In dotCover, the code highlighting mechanism has changed. Previously, test-covered lines of code were highlighted in green, and uncovered - in red. Instead, colored markers appeared in the text editor that show both the status of the code coverage and the status of the unit tests covering them. A green marker next to the line means that all instructions on this line are covered and tests pass. Red - tests related to the current instruction do not work. A gray marker indicates that the instruction is not covered by tests.
dotTrace: modified Timeline view
In Timeline mode, there is a new option Collect native allocations , which can be selected before starting the profiler. Then, when analyzing the profiling data, you can filter the events for accessing native memory (Native Memory Allocation) to identify places in the code with possible memory leaks, problems using unmanaged components in your managed code, etc.
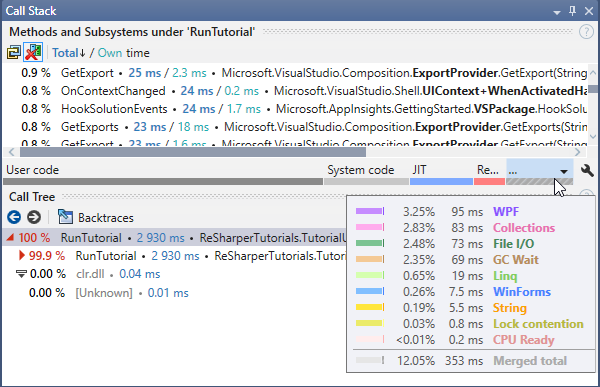
Timeline viewer now contains subsystems (Subsystems) - one of the best features of the Performance Viewer. The mechanics of subsystems is simple: in most cases, each subsystem groups calls made in a specific namespace or assembly. This information is useful for quickly assessing the distribution of time in a particular subtree of a call among various components: user and system code, WPF, LINQ, collections, strings, etc.
If you use third-party frameworks in your solution, add the appropriate subsystems to dotTrace. Even a quick glance at the subsystems in the call tree will allow you to understand how much time in this tree is spent on one or another framework.
The Call Stack window has received a whole bunch of improvements. We have returned the Show system functions option, useful for analyzing the runtime of methods. The list of methods in addition to the time of each method shows the total time of the subtree of the call. Click on method time or total time to apply a filter on the corresponding method or method and its subtree.
In dotTrace 2016.3, we added a new Events window, in which all events are visible during profiling: file operations, JIT, SQL queries, etc.
New traffic inspection in dotMemory
dotMemory provides a series of automated inspections to diagnose memory leaks. In addition to detecting duplicate rows, sparse arrays and other problems, dotMemory now allows you to check the application for completed objects and objects in the queue for completion. These objects, sorted by type, are shown in the Finalizable objects section, and are candidates for implementation of the
iDisposable interface in their classes.ReSharper C ++
Postfix autocompletions and patterns - one of the most interesting updates coming from ReSharper, will allow you to focus entirely on data, rather than syntax. When you add a period (.) Or an arrow (->) after an expression, ReSharper C ++ offers free functions that can accept this expression as the first parameter. Postfix patterns help save time when you need to change an expression. Wrap your expression using if, else, while, do, return, switch, and foreach patterns, adding the appropriate postfix.
We added new typedef refactorings . Introduce typedef quickly determines the type for the selected data type and replaces this type and all its entries with a new typedef. Inline typedef does the opposite: replaces an existing typedef with an actual data type.
Back in ReSharper C ++, there was support for the Catch test framework, the ability to analyze code from the command line, and much more. In the video review, our technical evangelist Phil Nash told in detail about all the updates in ReSharper C ++:
Try the tools at work and share your opinion.
This article describes the most notable updates ReSharper Ultimate. More details can be found on the What's New page. There you can download products .
As always, we welcome your comments. Be sure to write about your experience using the tools, suggestions and problems encountered here or in our bug tracker .
Thank you for your attention and to new releases;)
Source: https://habr.com/ru/post/317936/
All Articles