Instructions: How to choose the right indicators for monitoring and optimization, so that IT businesses grow faster

In any profitable project you can find a couple of thousand metrics for monitoring, but that's why. Complete instructions on the choice of working metrics from the service for managing marketing tasks based on data - hopox.
Let's try to create a dashboard from the project’s metrics that allow you to make the right marketing decisions based on the data.
Such a remote control can be created in Google Analytics, Dasheroo, Klipfolio, etc. but more effective in hopox, because only here it is possible not only to admire the metrics, but also to manage, tying real actions and growth hypotheses to them.
So, we need to choose from a thousand metrics a few dozen indicators that will be:
')
- always at hand
- determine whether we are moving toward a goal or not,
- show where the team’s efforts should be made to ensure the growth of the entire business.
Consider a few ways:
1 / Upload raw data
For a start, you can connect various marketing tools and upload the data they give. For example, data on Google Analyics: All users, New users, Achievements by goal, Conversion of goal. As well as the statistics of the transitions by channels: Paid advertising, Social Networks, Organic transitions, Transitions with letters. You can then connect, for example, Facebook Ads and upload Coverage, Clicks, Impressions, Unique Impressions, Spent Amount, Cost per Click, etc. We can also upload raw data from Yandex Direct, Google Adwords and so on.
Often this is enough to understand what is happening and to begin to make decisions based on data. Seeing analytical data in one place is much better than not seeing them at all. However, soon there will be a desire to somehow systematize all this.
2 / Grouping by funnel AAARRRR
The AAARRRR funnel tracks every significant step in a customer’s life, namely Information, Attraction, Activation, Hold, Virality, Yield, and Resurrection.

Ideally, each channel should be represented in the form of this funnel and try as far as possible to analyze the behavior of users as part of the funnel.
To do this, you have to cross several data sources, for example, Informing on Facebook Ads is Coverage, Attracting is Clicks, then you can use UTM tags to catch conversions in Google Analytics and count Lida, which is AAARRRR - Activation.
If desired, you can continue to extend the funnel and calculate the income using Google Analytics For Ecommerce, virality with the help of Sequences.
This method is well suited when a business knows how to make money and is pumping up channels of money.
3 / Development of Measurement Plan
The development of a Measurement Plan is important for the development of already successful projects for which the attraction channels have already passed a stage. I recommend to present its structure in the form of a pyramid.
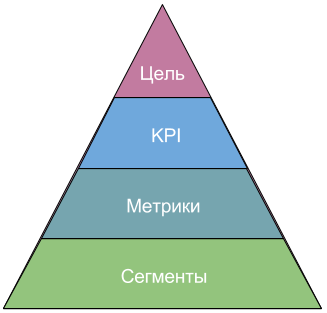
Led by - the goal of the business, then go the key indicators to achieve the goal, below, the metrics that can affect the key indicators, then the division into user segments. Let's use the example of an online store to create a measurement plan.
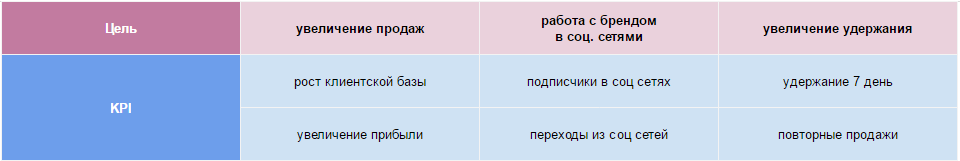
So what goals can an online store pursue? First, this is an increase in sales, then, for example, working with a brand in the social. networking and improved retention. Let's write them in the table.

We have identified three business goals that we will work on. Now you need to set the KPI for each direction. For growth, this may be a growing customer base and an increase in profits. To work with the brand with social. networks, the number of subscribers and transitions from social networks. And to increase retention: retention 7 days and repeat sales.
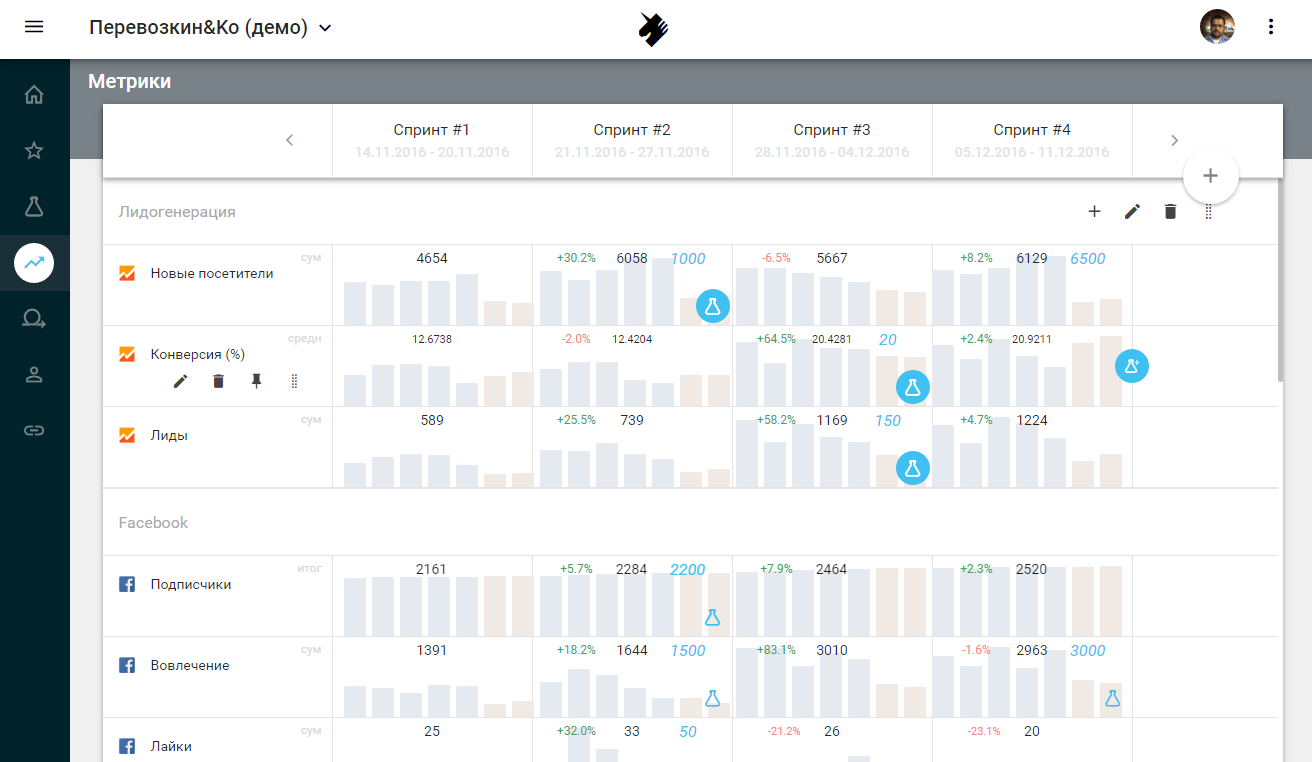
These indicators will determine whether we are approaching the goal or not. Next you need to add all the metrics on which key performance indicators may depend.

There can be a couple of dozen such metrics for each goal. And the last level of performance: user segments. It is very important to segment the audience and work with each segment separately. What can be user segments in our case? We write in the table.

Such a matrix of indicators will provide the entire team with relevant information: where the project is heading and where are the weak points now to work on.
A minute of advertising: hopox will help bring order to marketing , collect project indicators in one place and link team actions with indicators. Register and everything described in the article will become a reality.
Source: https://habr.com/ru/post/317722/
All Articles