Yandex used a neural network and learned how to predict precipitation to the nearest minute.
Today I would like to talk to you again about the weather. Again, because almost a year ago we were talking about it: I told about our Meteum forecasting technology based on meteo-modeling and machine learning. Now I want to talk not about the weather that will be tomorrow, next week or on New Year's Eve - but about the one that has already been established outside the window, and about the one that will come in the next few hours.
Under the cut, I will talk about what naukisting and how we worked on it.
Current weather affects a huge amount of our daily decisions. If there is heavy snow outside the window, we reflect on how we can go to work - by car or by public transport. Looking out the window, we decide whether to take an umbrella with us and whether we need a waterproof jacket. Even standing at the exit of the subway in the pouring rain, we wonder when it will end. If in five minutes you can wait and come to the meeting in a dry suit, and if in half an hour you will have to get wet or be late. For all these small but important decisions, we need the most accurate information about what the weather is now and how it will change in the near future. You must have come across a situation when the sun is shining in one area of the city, and in the other it is pouring torrential rain with a thunderstorm.
')
Since the current weather is important to our users, it is about this parameter of the service that people most often write in reviews, including negative ones. It would seem that you just need to look out the window and show the correct weather on the service. But to describe the situation outside the window anywhere in the country or the world is not an easy task.
Firstly, the meteorological stations are located far from each other and measure the parameters in strictly defined periods of time. Kazan, for example, is a huge city, and there are only two meteorological stations: in the center and at the airport. Temperature and other indicators in these points and in neighboring areas may differ drastically.
Secondly, due to errors in the initial conditions, forecast models also cannot serve as a reliable source of information about the actual situation on the street.
Yes, and the requirements for short-term forecast are much higher: you can always look out the door and check whether meteorologists are right.
Let me remind you once again that Yandex.Podog uses Meteum technology based on meteorological models and machine learning. Built on the basis of Matrixnet and trained on large data arrays, our formula optimally combines the input factors. As a result, the forecast turns out to be much more accurate.
And in order to show the current weather on the service, we (in addition to predictions from mathematical models) mix in the formula measurements recently obtained at the nearest weather stations. This approach is significantly better than other solutions to the problem. The accuracy of determining the weather in the coming hours greatly increases, and this is not surprising, since we take into account the most timely and accurate information. Our metrics have increased significantly in comparison with our own forecasts, which were built before we started mixing up fresh data from weather stations. In May of this year, immediately after their addition, we expanded the zone of Meteum to the whole of Russia, and in November-December - to Ukraine, Belarus and Kazakhstan.
But even a combined approach from models and data glued together with Matrixnet does not provide the desired accuracy. This is especially true of precipitation - one of the most important parameters for the user. The main reason for this imperfection is lack of data. Weather stations, as already mentioned, are located far from each other. Using the data taken from the stations, you cannot tell the user that he should wait 10 minutes in the underpass and the torrential rain on the street will be replaced by variable cloudiness. Where can I get more data on the state of the atmosphere?
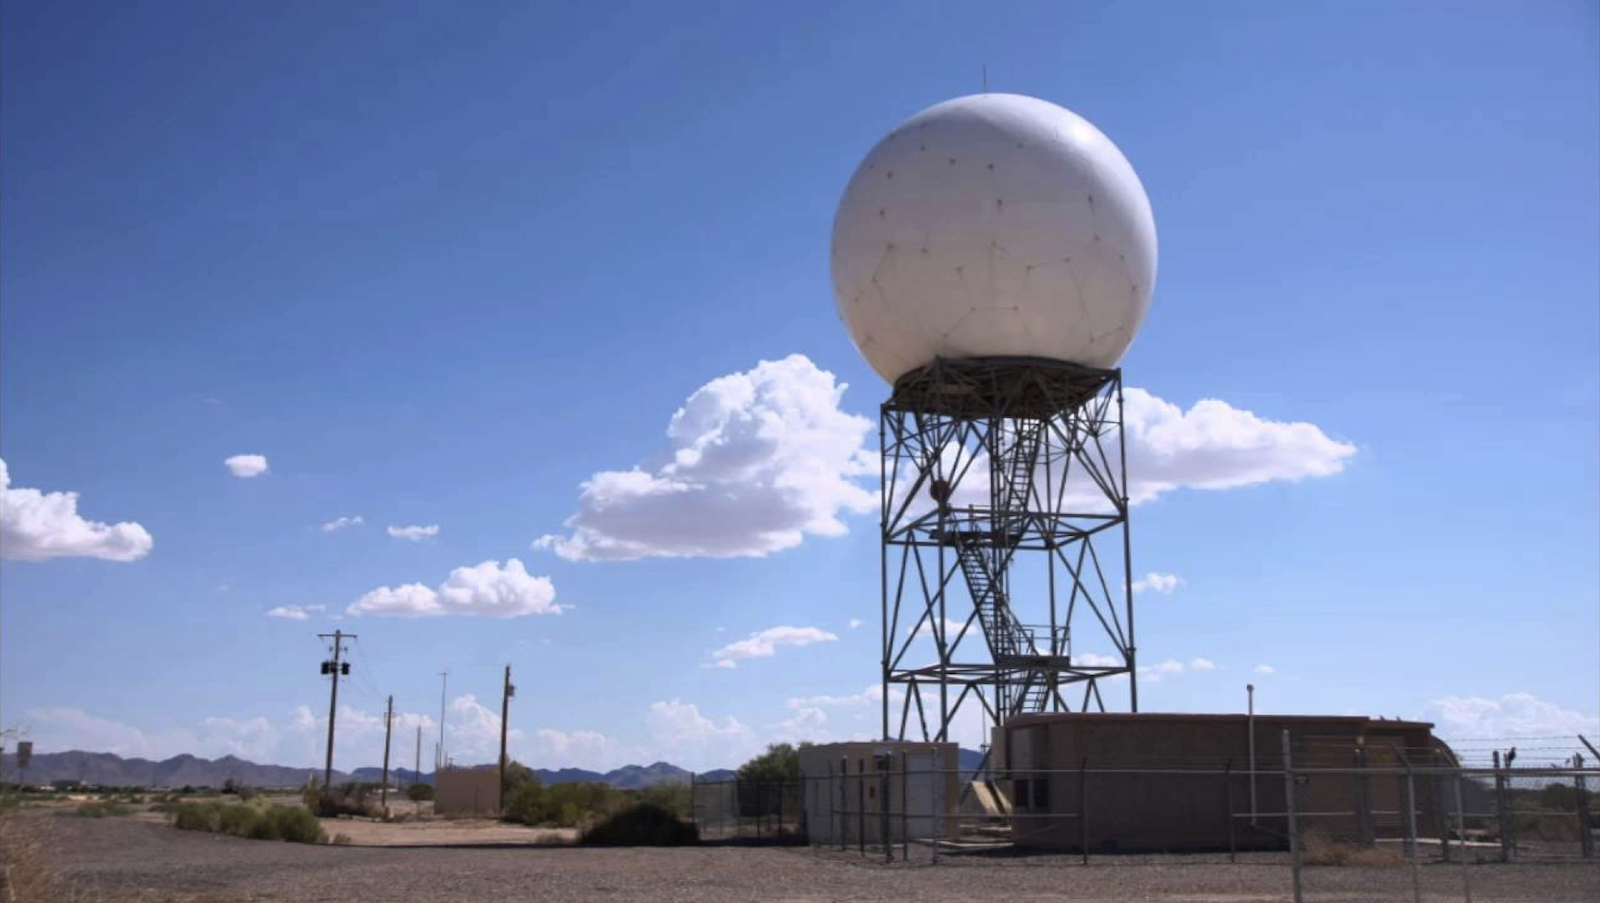
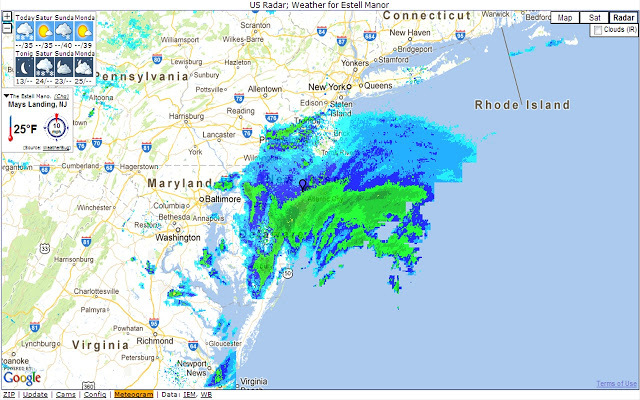
The most recent achievement of science and technology in monitoring precipitation is meteorological radar. About once every 10 minutes, he builds a three-dimensional snapshot of the atmosphere within a radius of 200 kilometers from his location horizontally and up to 10 kilometers vertically. According to the principle of operation, the radar is very similar to aviation radar, only in the picture are visible not airplanes, but areas of the atmosphere where there are water droplets larger than 50 micrometers. If such drops really exist, then, most likely, precipitation falls out of the cloud in which they are located. Here is the radar itself and the results of its work:
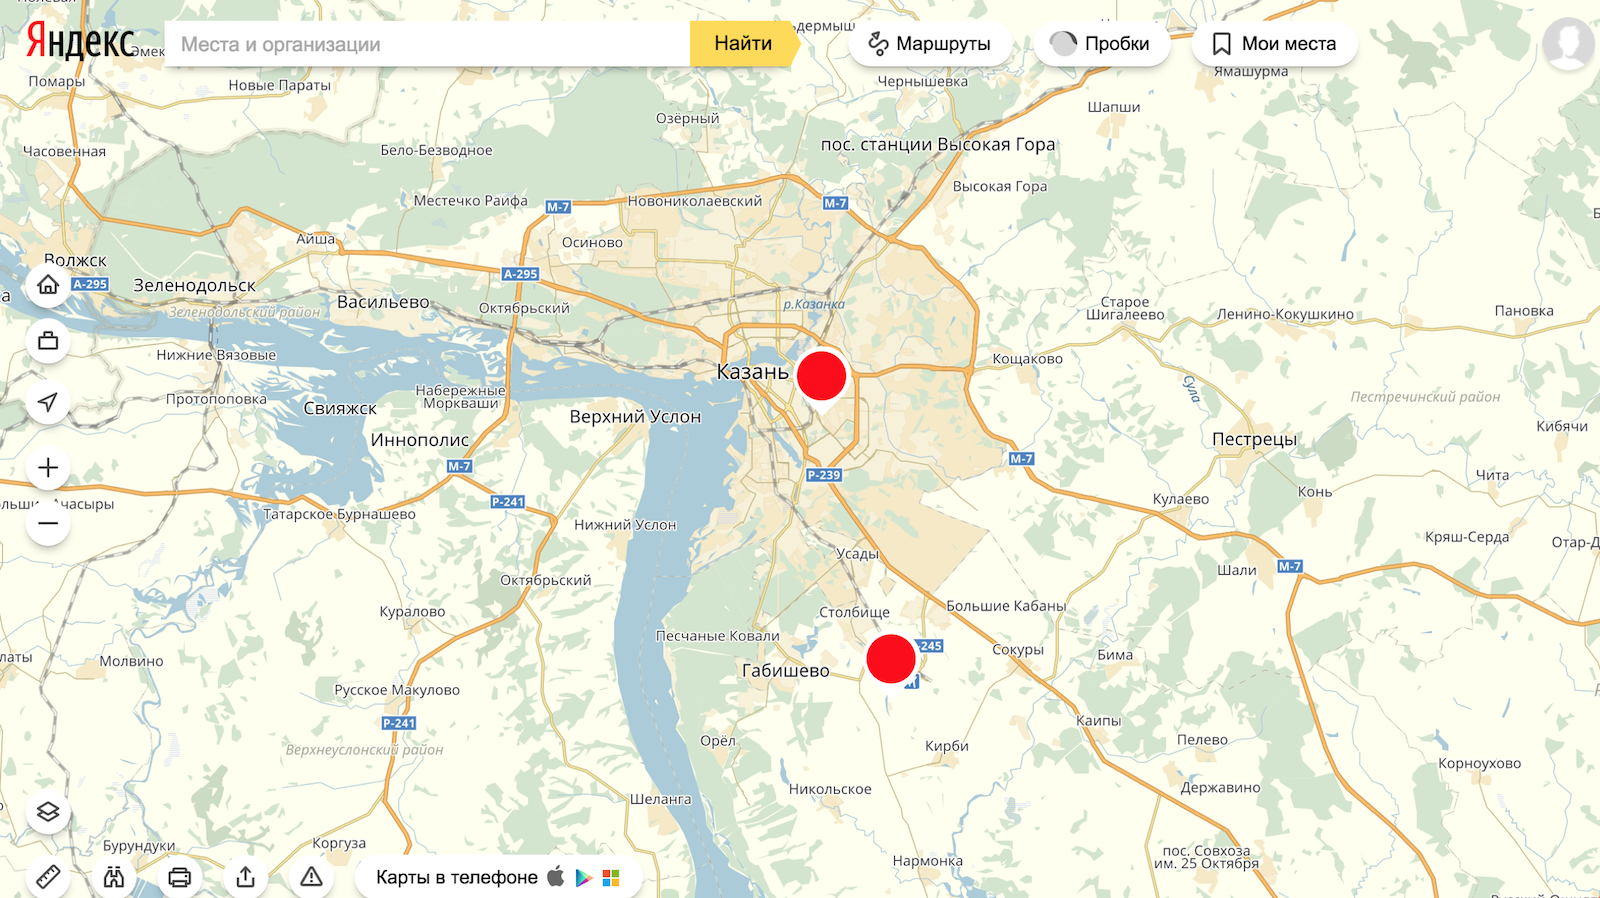
In Russia, there is already a network of meteorological radars of sufficiently high quality. They are installed in the most populated and meteorologically interesting regions. The radar coverage area is shown on the map:
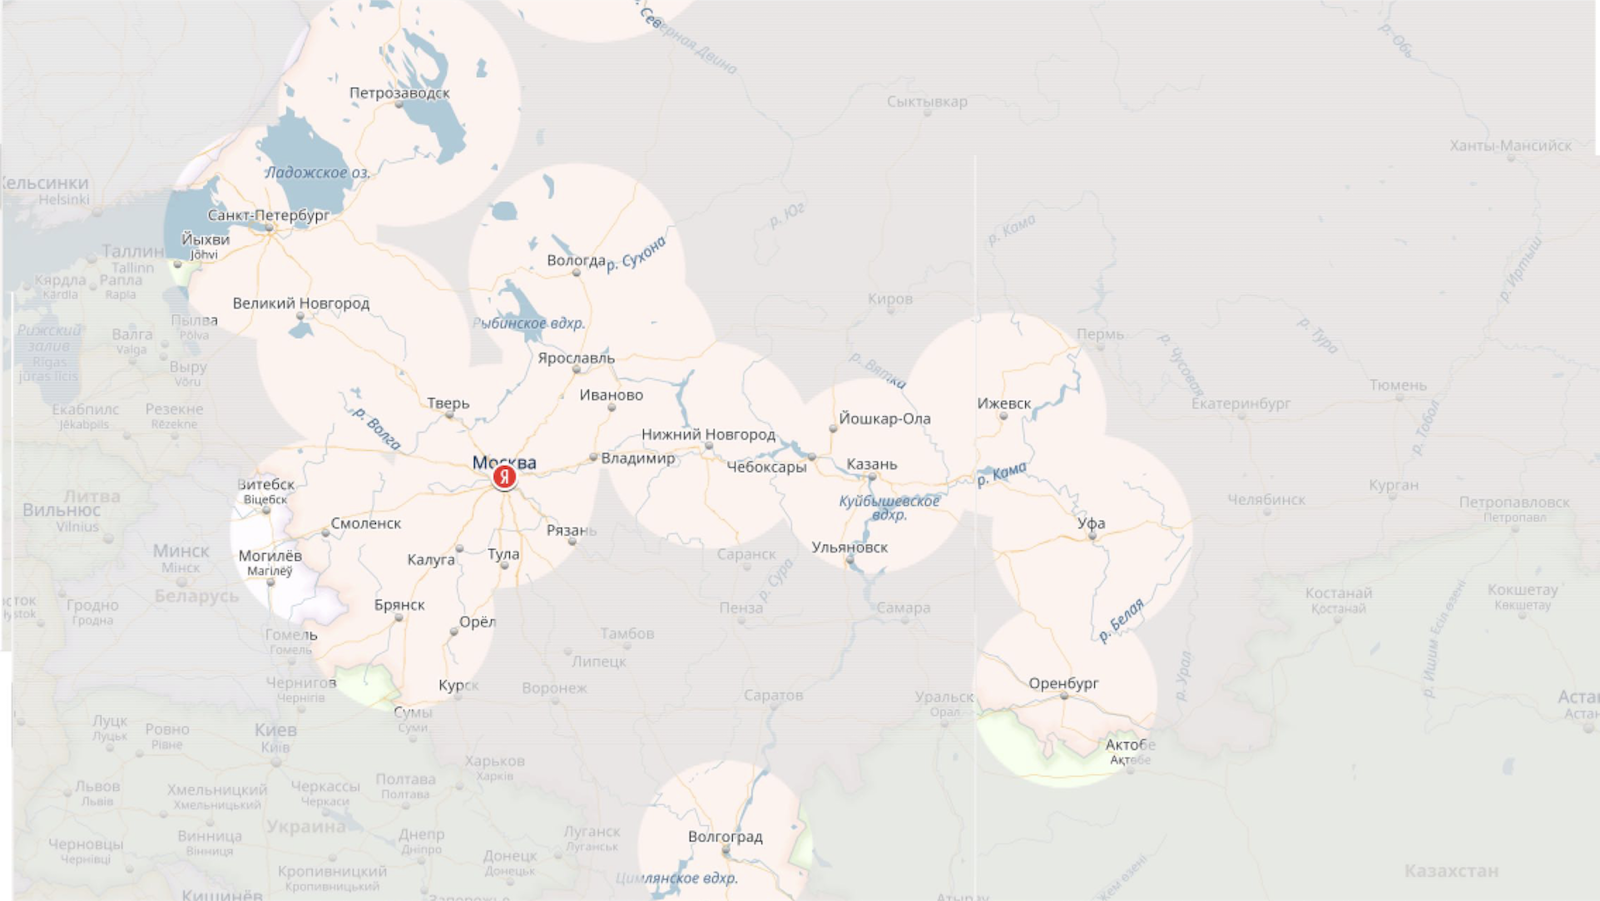
By the way, more than 40 percent of the population of Russia lives in an open area. The radar data has a spatial resolution of 2 km by 2 kilometers per pixel, which makes it possible to describe the current weather with an accuracy of a small microdistrict.
This year, Yandex has received official access to measurements that are conducted on the Roshydromet radar network. Since then, we have worked hard to add this data to our products.
Today, we are ready to present the technology of naughting - a short-term hyper-local precipitation forecast. Nauk is the word that came to us from the English language, composed of two words: now and forecasting, that is, literally "forecast for now." But in fact, through the products of Yandex you can now find out about the distribution of precipitation in the time interval from two hours ago to two hours in advance.
Our new product is based on convolutional neural networks. From the point of view of mathematics, the problem is formulated as follows: it is necessary to predict future precipitation maps with a time resolution of 10 minutes, 2 hours ahead, from a sequence of radar images and relevant meteorological information.
To solve this problem, we chose a convolution network of a certain architecture. Each convolutional network layer is a sequential set of filters that automatically extract features from the data set supplied to the input. The combination of such layers allows you to select a large number of signs, which can be judged on what will happen to precipitation in a selected area. Will they begin or, on the contrary, will they end? Or will their intensity simply increase? All this can be determined.
To configure the filters of the convolutional network and the weights between them, we form a training sample of a sufficiently large volume - now it consists of more than 800,000 frames from each radar that have undergone preliminary processing. Learning neural network occurs on a cluster of GPU.
This is what this network looks like:

In general, the movement of precipitation can be divided into two components: the transfer of the area with precipitation in the direction of the wind and the change in the shape of the area. Separate branches of the neural network are responsible for each of the components, which allows flexible selection of optimization parameters.
As for the data flow, this is how the author, nes8bit , simplifies it :
We estimate the accuracy of the product and configure our neural network weather forecast using several types of metrics.
First, it is important to us how correctly we predicted each next frame of our forecast. We use the f-score frame-by-frame metric, which can be defined as the “current picture prediction accuracy”.
Secondly, we are interested in metrics for those points in space where in the near future there will be a change in weather conditions. Through them, we learn the most important thing: how precisely the time of the beginning or end of the rain is determined and, accordingly, how well the scenario works, in which the user waits for the end of precipitation. We find the necessary points and fix the correspondences and discrepancies between the forecast and the reality at each moment of time.
Here is the f-measure for the first metric depending on the horizon:
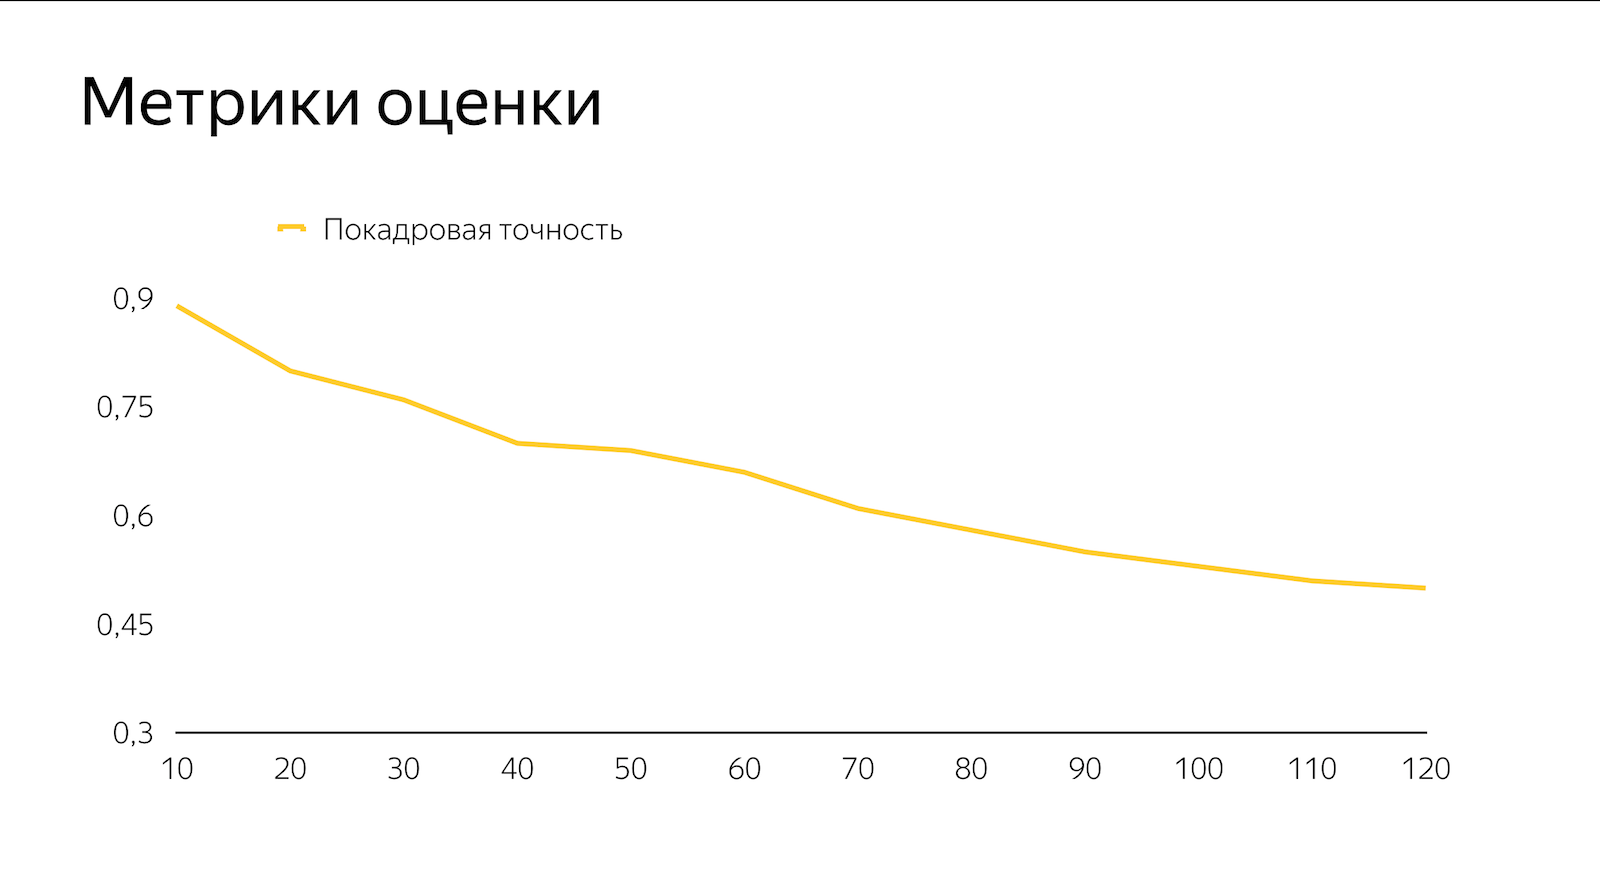
I must say that if you calculate the same strict metrics for a regular forecast of any provider, the values will be no more than 0.1, and more often they will be very close to zero. This is due both to differences in the method of forecasting itself and to the lack of a large and important source of data.
We chose the types of metrics, focusing on how the new data will be presented in the product. On the main page of Yandex. Weather now there is a message about precipitation in the next two hours. From this block you can find out that the precipitation will run out from minute to minute or will begin within half an hour. By clicking on the message, you will see how areas with precipitation are distributed in your area. All other areas in the radar zones are also marked on the same map.

I will say a few words about what I said at the very beginning. The technology that we have presented today has been designed specifically to make our users' lives a little more comfortable. Hyper-local short-term precipitation forecast will help people make decisions based on information from a fundamentally new source - a network of meteorological radars. Data on heavy snowfall with details to areas of your city will help to know about the amount of snow on the roads, and a warning of heavy rain will help you not catch a cold in spring.
Now it may seem incredible, but summer will soon come and we will all ride bikes, roller skates, walk in parks, relax in nature. And from today you can make plans for the near future, looking not at the low or high flight of the swallows, but at the Yandex.Pogoda page and applications. One familiar character to you all already does.
Under the cut, I will talk about what naukisting and how we worked on it.
Current weather affects a huge amount of our daily decisions. If there is heavy snow outside the window, we reflect on how we can go to work - by car or by public transport. Looking out the window, we decide whether to take an umbrella with us and whether we need a waterproof jacket. Even standing at the exit of the subway in the pouring rain, we wonder when it will end. If in five minutes you can wait and come to the meeting in a dry suit, and if in half an hour you will have to get wet or be late. For all these small but important decisions, we need the most accurate information about what the weather is now and how it will change in the near future. You must have come across a situation when the sun is shining in one area of the city, and in the other it is pouring torrential rain with a thunderstorm.
')
As it was done before
Since the current weather is important to our users, it is about this parameter of the service that people most often write in reviews, including negative ones. It would seem that you just need to look out the window and show the correct weather on the service. But to describe the situation outside the window anywhere in the country or the world is not an easy task.
Firstly, the meteorological stations are located far from each other and measure the parameters in strictly defined periods of time. Kazan, for example, is a huge city, and there are only two meteorological stations: in the center and at the airport. Temperature and other indicators in these points and in neighboring areas may differ drastically.
Secondly, due to errors in the initial conditions, forecast models also cannot serve as a reliable source of information about the actual situation on the street.
Yes, and the requirements for short-term forecast are much higher: you can always look out the door and check whether meteorologists are right.
Let me remind you once again that Yandex.Podog uses Meteum technology based on meteorological models and machine learning. Built on the basis of Matrixnet and trained on large data arrays, our formula optimally combines the input factors. As a result, the forecast turns out to be much more accurate.
And in order to show the current weather on the service, we (in addition to predictions from mathematical models) mix in the formula measurements recently obtained at the nearest weather stations. This approach is significantly better than other solutions to the problem. The accuracy of determining the weather in the coming hours greatly increases, and this is not surprising, since we take into account the most timely and accurate information. Our metrics have increased significantly in comparison with our own forecasts, which were built before we started mixing up fresh data from weather stations. In May of this year, immediately after their addition, we expanded the zone of Meteum to the whole of Russia, and in November-December - to Ukraine, Belarus and Kazakhstan.
But even a combined approach from models and data glued together with Matrixnet does not provide the desired accuracy. This is especially true of precipitation - one of the most important parameters for the user. The main reason for this imperfection is lack of data. Weather stations, as already mentioned, are located far from each other. Using the data taken from the stations, you cannot tell the user that he should wait 10 minutes in the underpass and the torrential rain on the street will be replaced by variable cloudiness. Where can I get more data on the state of the atmosphere?
Need more data
The most recent achievement of science and technology in monitoring precipitation is meteorological radar. About once every 10 minutes, he builds a three-dimensional snapshot of the atmosphere within a radius of 200 kilometers from his location horizontally and up to 10 kilometers vertically. According to the principle of operation, the radar is very similar to aviation radar, only in the picture are visible not airplanes, but areas of the atmosphere where there are water droplets larger than 50 micrometers. If such drops really exist, then, most likely, precipitation falls out of the cloud in which they are located. Here is the radar itself and the results of its work:
In Russia, there is already a network of meteorological radars of sufficiently high quality. They are installed in the most populated and meteorologically interesting regions. The radar coverage area is shown on the map:
By the way, more than 40 percent of the population of Russia lives in an open area. The radar data has a spatial resolution of 2 km by 2 kilometers per pixel, which makes it possible to describe the current weather with an accuracy of a small microdistrict.
This year, Yandex has received official access to measurements that are conducted on the Roshydromet radar network. Since then, we have worked hard to add this data to our products.
Today, we are ready to present the technology of naughting - a short-term hyper-local precipitation forecast. Nauk is the word that came to us from the English language, composed of two words: now and forecasting, that is, literally "forecast for now." But in fact, through the products of Yandex you can now find out about the distribution of precipitation in the time interval from two hours ago to two hours in advance.
Our new product is based on convolutional neural networks. From the point of view of mathematics, the problem is formulated as follows: it is necessary to predict future precipitation maps with a time resolution of 10 minutes, 2 hours ahead, from a sequence of radar images and relevant meteorological information.
To solve this problem, we chose a convolution network of a certain architecture. Each convolutional network layer is a sequential set of filters that automatically extract features from the data set supplied to the input. The combination of such layers allows you to select a large number of signs, which can be judged on what will happen to precipitation in a selected area. Will they begin or, on the contrary, will they end? Or will their intensity simply increase? All this can be determined.
To configure the filters of the convolutional network and the weights between them, we form a training sample of a sufficiently large volume - now it consists of more than 800,000 frames from each radar that have undergone preliminary processing. Learning neural network occurs on a cluster of GPU.
This is what this network looks like:
Network architecture
In general, the movement of precipitation can be divided into two components: the transfer of the area with precipitation in the direction of the wind and the change in the shape of the area. Separate branches of the neural network are responsible for each of the components, which allows flexible selection of optimization parameters.
As for the data flow, this is how the author, nes8bit , simplifies it :
Radar and science data, which are transmitted to the weather backend, are first interpolated from the azimuthal projection, the center of which is the radar, to a regular latitudinal-longitude. Then, contours are constructed on the resulting grid, which describe the areas of precipitation depending on the intensity and type. Contours are stored as polygons in PostgreSQL. Part of the data, for example, with a description of clouds, is stored in a raster form in the same PostgreSQL: this allows you to quickly respond to the values of certain variables in a particular coordinate, while maintaining consistency with the vectorized representation in the form of polygons.
Metrics
We estimate the accuracy of the product and configure our neural network weather forecast using several types of metrics.
First, it is important to us how correctly we predicted each next frame of our forecast. We use the f-score frame-by-frame metric, which can be defined as the “current picture prediction accuracy”.
Secondly, we are interested in metrics for those points in space where in the near future there will be a change in weather conditions. Through them, we learn the most important thing: how precisely the time of the beginning or end of the rain is determined and, accordingly, how well the scenario works, in which the user waits for the end of precipitation. We find the necessary points and fix the correspondences and discrepancies between the forecast and the reality at each moment of time.
Here is the f-measure for the first metric depending on the horizon:
I must say that if you calculate the same strict metrics for a regular forecast of any provider, the values will be no more than 0.1, and more often they will be very close to zero. This is due both to differences in the method of forecasting itself and to the lack of a large and important source of data.
We chose the types of metrics, focusing on how the new data will be presented in the product. On the main page of Yandex. Weather now there is a message about precipitation in the next two hours. From this block you can find out that the precipitation will run out from minute to minute or will begin within half an hour. By clicking on the message, you will see how areas with precipitation are distributed in your area. All other areas in the radar zones are also marked on the same map.
Instead of an afterword
I will say a few words about what I said at the very beginning. The technology that we have presented today has been designed specifically to make our users' lives a little more comfortable. Hyper-local short-term precipitation forecast will help people make decisions based on information from a fundamentally new source - a network of meteorological radars. Data on heavy snowfall with details to areas of your city will help to know about the amount of snow on the roads, and a warning of heavy rain will help you not catch a cold in spring.
Now it may seem incredible, but summer will soon come and we will all ride bikes, roller skates, walk in parks, relax in nature. And from today you can make plans for the near future, looking not at the low or high flight of the swallows, but at the Yandex.Pogoda page and applications. One familiar character to you all already does.
Source: https://habr.com/ru/post/317626/
All Articles