How well to submit the results of qualitative research: the method of thematic networks (+ analysis of ATS as an example)

Most articles and speeches about qualitative research are devoted to methods of collecting information. But the charm of qualitative methods in marketing and UX research disappears at the stage of analysis and presentation of results. Researchers solve this difficult task in different ways. Sometimes for the sake of a quick result, or unknowingly, they violate the methodology of qualitative research, which makes the work unprofessional and not credible.
In the article we will consider one of the methods of qualitative analysis - the Method of thematic networks:
- we will discuss the frequent mistakes of qualitative research and recall the "underwear gnomes";The article will be interesting:
- we will analyze the step-by-step algorithm of the method and its possible traps;
- apply the method to the analysis of the IT product and draw a thematic map.
- researchers;The article continues the topic of user research. This time, we digress from the questionnaire study ( article 1 and article 2 ), let us return to the analysis of user needs ( article 3 ) and discuss qualitative methods for processing the results of the study.
- product managers and marketers;
- those who use the results of research;
- those who have long been looking for a convenient method of structuring non-digital information.
')
Why do researchers like quality methods? For optional representativeness of the sample, lack of statistics and other freedom of action. Freedom in fact turns out to be imaginary, but this can be noticed only if you take the methodology of qualitative research seriously. And without such an attitude and under the influence of a well-established orientation towards positivism, qualitative methods in business research become “lazy” quantitative, which they were supposed to “not be so strict”.
Most often, errors appear at the stage of choosing a methodology and at the stage of processing and presenting results. I plan to devote separate articles to the selection of research methodology. And here are two main errors in processing the results of qualitative research:
1. The results of qualitative research are presented as in the presentation of the “Underwear Gnomes” from the “South Park”. The first stage is substantiated in detail - a qualitative method of data collection, and then, bypassing the discussion of the results, conclusions and recommendations are made. Such reports do not contain intermediate aggregated data, and the researchers' calculations remain for the customer in the “black box”. Customers save time and, with a great deal of trust in researchers, we are happy to receive only final conclusions. But if you look at how much information is lost and distorted with such intuitive processing, both customers and researchers will not be happy with the results.
2. Researchers refer to the statements and actions of research participants, distribute the results to all users and try to predict their behavior (this is permissible only for quantitative methods). Sometimes statistics are used: descriptive (counting frequencies and averages, contingency tables) and inductive (correlation, factor analysis, etc.). Indeed, these methods can be used in the processing of qualitative data in social sciences, but in marketing research they cannot save the researcher and customer from shifting attention from qualitative data to quantitative results, from understanding to prediction.
Even in the reports of experienced UX-researchers there is this easy transition from qualitative methods of collecting information to their quantitative interpretation. With this presentation of results, the reader intuitively summarizes the conclusions, or calculates the percentages: “Out of 6 participants in the UX testing, 3 could not find the order button - I see. Half of our users do not reach us! ”,“ 60% of users (3 people out of 5) chose the green button. “We need to change the palette of the site, since most people like green.” The result is ridiculous results.
“Not everything that is important can be measured, not everything that can be measured is important” (A. Einstein).
The main task of qualitative research remains the description of the phenomenology of decision-making by users and an understanding of their emotions, motives and ways of reasoning (cognitions, prejudices, stereotypes, etc.), rather than counting the actions of individual participants in the experiment. Hence, the method of analyzing the results of a qualitative research will be more useful if it focuses on understanding, conveying meanings and describing options for assessing the situation by the user, rather than on counting the operations performed by him.
The Thematic Networks Method is a method of organizing the results of qualitative research. The main objective of the thematic analysis is the selection of the main topics contained in the qualitative data, their grouping and display, which is easy for the researcher and the reader (the research customer) to understand. The result of such groupings becomes a spiderlike network, which reflects all selected topics and links between them.

This is the classic structure of the thematic network.
It is impossible to unambiguously track the separation of the thematic analysis as an independent method, since the stages, principles and general structure are guessed in other qualitative methods (for example, the method of a valid theory, qualitative analysis and others). So, the method of thematic networks is not fundamentally new. But its use is justified, convenient and easy to automate in programs for qualitative research, the so-called Computer Assisted / Aided Qualitative Data AnalysiS (CAQDAS). For example, in the ATLAS.ti program.
It is important that the purpose of thematic analysis does not include the definition of the reasons for the argument. The analysis of thematic networks does not imply the calculation of the frequency of occurrence of different topics, or their combinatorics. Although the frequent occurrence of a topic in texts is considered a positive circumstance, even with the mere mention of a topic in one text, it is included in the analysis on general rights. The main task of the thematic analysis is the splitting of texts into meaningful segments and the allocation of "rationalizations" in them (cognitive schemes, interpretations, justifications, objections, etc.). In other words, all found topics, regardless of the frequency of their appearance in the texts and authorship, are equally important for analysis.
The method of thematic networks is suitable for working with a variety of data:
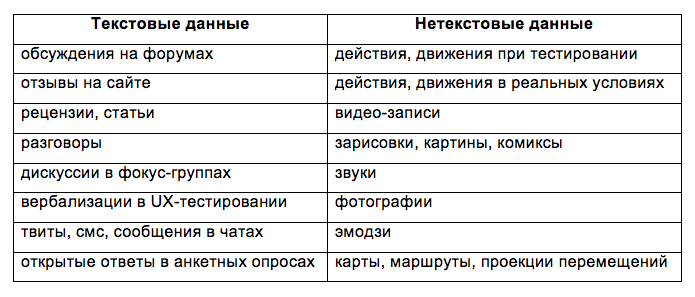
The method of thematic networks is well manifested when the researcher encounters unexpected or hidden patterns of thinking (unconscious prejudices, secret desires, etc.). In such an analysis, it is possible not only to identify the main “cognitive players”, but also to give them an interpretation and even describe their typical masks in everyday speech, or user behavior.
In normal product testing, when user reactions are mostly predictable and expected , the thematic network method does not bring new discoveries, but it helps to prove and structure the main topics qualitatively, so that then they can identify specific actions to refine or promote the product based on them.
The reliability of the thematic network method is under the constant attention of critics, since it largely depends on the experience and the chosen strategy of the coder performing the analysis. In order to increase the reliability of the method, it is recommended to process data in parallel to several encoders. If this cannot be achieved, the researcher is recommended to regularly return to the original texts and compare them with the selected codes and themes.
For convenience, consider the use of the method on the example of text analysis. Similarly, it can be applied to other types of data.
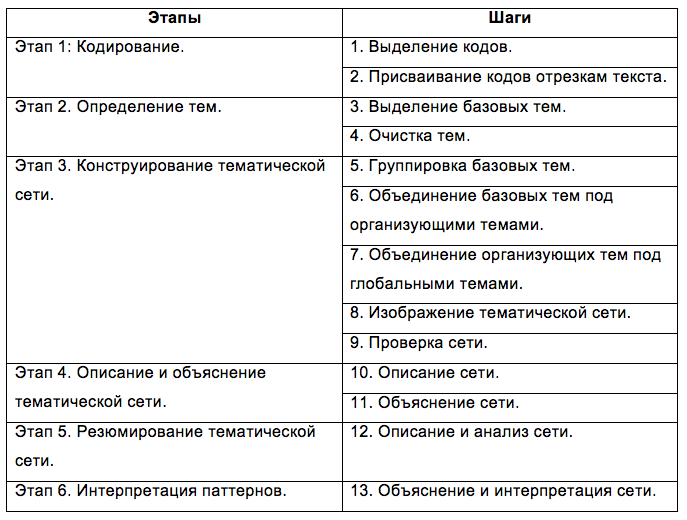
Stages of thematic networks application
Stage 1: Encoding.
At this stage, meaningful text fragments are highlighted in the text. Each of them is encoded.
What do we have to do
Step 1. The researcher looks through the texts and writes in a separate document the names of the codes and their decoding. Later this coding system will be applied to word processing.
How codes are selected
Encoding methods, in general, boil down to the following:
⎯ the system of codes is selected on the basis of predetermined theoretical assumptions (deductive way, “theory-driven” research);Selected codes can be given concepts, taken from research hypotheses, fragments of everyday speech of research participants, neologisms, or slang.
⎯ the system of codes is selected on the basis of significant topics appearing in the text (inductive path, "data-driven" study);
⎯ combines both approaches.
Step 2. The researcher breaks the text into meaningful sections (paragraphs, sentences, phrases, words) and assigns codes to them.
As a result of this work, all texts are divided into codes. When using automation services at this stage, each selected piece of text is replaced by a code. This stage allows you to check whether all the topics in the original texts are covered by codes, and whether all the codes exactly fit the replaced segments of the text.
Where can I go wrong
At this stage, the principle of “necessity and sufficiency” is important. On the one hand, codes must be clearly defined in order to avoid confusion of concepts and the intersection of the range of values of several codes. On the other hand, the number of codes should be limited and reasonable so that the researcher would not be tempted to assign a code to each new sentence.
Also do not forget to write down for each code decoding. At first it seems that all the codes can be kept in memory, but later there can be some funny situations when you have to redo the work.
Stage 2. Definition of topics.
At this stage, the texts highlighted basic topics.
What do we have to do
Step 3. The researcher reviews the codes and highlights among them the most significant, unifying, or outstanding topics. Related codes are grouped into topics.
Step 4. The researcher looks at the topics and “clears” them to avoid repetitions and make the topics wide enough to include several codes. As a result, each topic should be rather narrow in order to accurately convey a specific idea and not intersect with other topics, but also wide enough to summarize different expressions and formulations in this semantic area.
It is convenient to work if the initial analysis level is not more than 16. At the same time, it is good if there are not very few of them: with 2-3 topics, the thematic map will not turn out interesting and informative.
Where can I go wrong
This is a stage of generalization of information, but this does not mean that it is necessary to group all the codes on it. If the text highlighted codes that can not be grouped, and which are of relevance to the study, such codes are assigned their own topics. However, in practice it is usually possible to group and summarize several codes into topics.
Stage 3. Construction of a thematic network.
At this stage the thematic network is drawn - the graphic basis of the method.
What do we have to do
Step 5. The researcher groups and organizes basic topics according to their meaning. The order is defined by the content, or by the preliminary theoretical foundations of the study. Topics can be renamed to represent homogeneous and easily readable elements within one group.
Step 6. The researcher organizes basic topics that are close in meaning and summarizes them under one common “organizing” topic. The title of this topic contains a generalization for the whole group of its topics. It must be sufficiently spoken and readable at first sight.
Step 7. The researcher integrates related organizing topics under common “global” topics. Global topics usually include 2-3 organizing topics and become the final synthesis part of a thematic network. Therefore, their names are usually metaphorical, they convey the general meaning of the topics they combine.
The number of codes, basic, organizing and global themes is not prescribed by the rules. It is determined by the variety of material collected and the analytical work of the researcher. But usually in the works there are up to 3 global themes (usually 1-2), 2-3 organizing topics for each global and 2-3 basic topics for each organizing topic.
Step 8. Once all the generalizations have occurred and the topics have been “talking” names, it is time to visualize. It is done simply, with the observance of 2 important principles: 1) in the center of the network is placed a global theme, from which organizing ones depart and - further - basic themes; 2) the arrangement of the themes of one group should not be hierarchical, they are all arranged as homogeneous equivalent elements of the network.
Step 9. When the network is drawn, the explorer returns to checking and updating it. At this stage, the researcher opens the raw texts and makes sure that every significant aspect touched in the text has found an adequate representation in the network and has not been distorted in the process of generalization. It also checks if there is an equivalent for each topic on the network in raw data, from which you can illustrate the topic if necessary.
Where can I go wrong
Choosing titles for organizing and global topics is a rather difficult task. Names should be spoken, not distort the meaning of the combined topics and find correspondences in the raw data. At the stage of generalization, there is a great danger of shifting accents and adding personal meanings from the researcher. Therefore, it is recommended to perform this work by several researchers independently and then compare the results, or one researcher should double-check the selected topics.
Stage 4. Description and explanation of the thematic network.
Creating thematic networks is only an analysis tool, but not an analysis in essence. In order to make a qualitative analysis and advance in the understanding of the texts, the researcher explains the selected topics and determines the thinking patterns of the research participants who are hidden behind these topics.
What do we have to do
Step 10. Network description. Once the network is built, the researcher returns to the raw materials and describes the content of the network using quotes from the original texts.
Step 11. Explanation of the network. When examples of texts are proposed for parts of the network, the researcher proceeds to discuss and interpret them.
He returns to reading the original texts, but this time he does not read them linearly, but uses the framework of a thematic network. Now he can give explanations to texts from the point of view of selected basic, organizing and global topics. Thus, the researcher and his reader have a tool for understanding, summarizing and illustrating the content of original materials.
In the analytical report, the analysis results appear in the form of a text block, where topics are discussed, sections of the original texts are given and their explanations are given.
Where can I go wrong
When describing and explaining the network, it is recommended to use literal quotations from the original texts, which most clearly characterize the topic, with a brief reference to the research participant, or the source in which the quotation was taken.
If the researcher is sure that the topics are hidden in the data, but he cannot find examples for them, such material cannot be included in the report. It is necessary either to conduct additional research or to change the methodology of data interpretation.
Use the rule of qualitative analysis: “Not everything that is in the data should be included in the analysis. But everything that is included in the analysis must be confirmed in the original data. ”
Stage 5. Summarizing the thematic network.
At this stage, the results are summarized, the main topics are highlighted and discussed.
What do we have to do
Step 12. The researcher describes and analyzes the selected topics. In the final report, the analysis is presented in the form of a free description.
Where can I go wrong
The value of this part of the report is in the reasoning of the researcher and the depth of immersion in the analysis. The style of these arguments is given by the accepted communication in the company. The analysis should not be cumbersome, but should take into account the basic requirement of qualitative research - a deep, “three-dimensional” immersion into the problem.
Stage 6. Interpretation of patterns.
The final analytical stage.
What do we have to do
Step 13. The researcher returns to the original tasks, compares the hypotheses with the results, gives explanations, offers interpretations, complements the initial theoretical constructs.
In the final report, the analysis is presented in the form of a conclusion.
Where can I go wrong
The conclusions of qualitative research often leave the researchers and customers a feeling: “I already knew that!”. After the study, hands may fall, the work will seem like a waste of time. However, the activity of the researcher is to prove the hypotheses. Obvious knowledge (which only seems obvious) cannot be taken into work without sound evidence, if your company adopts a scientific approach and uses research. Do not forget also about the well-known cognitive distortion of the “retroactive knowledge effect”, in which information appears to people only after they recognize it.
Finally, new discoveries, or unconfirmed particular hypotheses, which were mistakenly considered obvious, may lie behind the seemingly obvious information.
That's all. 13 steps, and building thematic networks completed. Now we will discuss an example of using the method in researching users of an IT product.
An example of using thematic networks in the study of IT product user reviews
We use the method of thematic networks to illustrate the attitude of users to the cloud recruiting automation system “HRP”. Our company is a co-owner of this system, we participated in its development from the very beginning. It is more difficult to investigate your products, but we will try to present an abbreviated example of the analysis to illustrate the application of the thematic network method without violating the nondisclosure agreement.
Qualitative user experience research did not involve the analysis of deep-seated impulses and unconscious prejudices (which can occur, for example, in studying the experience of computer games players), so the analysis turned out to be simple and obvious. But quite appropriate to the task of demonstrating the method.
Given: The system exists on the market for about 2 years. She is well known in the field of recruiting automation services, applications for test access are received regularly and in the desired quantity. However, many users are lost in the transition from free testing to buying paid access. The price of monthly use is low (lower than most competitors), so the hypothesis of price objections from customers for this study is discarded.
Relevant users leave applications: company executives, recruiters, recruitment managers and automation managers. The hypothesis that an irrelevant flow of bids influences poor conversion is also discarded.
Objective: find out what kind of cognitions (thoughts, rationalizations) arise from users when testing the recruitment automation system.
Qualitative research material: User feedback was collected unstructured, mainly from feedback letters and telephone conversations. The base of the study included: reviews, questions and objections, written (spoken) by users after becoming acquainted with the system. The region of the collection of reviews: Russia, Belarus, Ukraine, Kazakhstan, Lithuania. Number of texts involved in the analysis: 40 records.
Recall that when applying qualitative research methods, the number of respondents, the representativeness of the sample, and the ratio of covered and responded users come to the fore. In such studies, only the topics (patterns of thinking, rationalization, ideas, objections, etc.) that occur to the user when they become familiar with the product are important. Therefore, opinions collected from 8 users and processed by qualitative analysis methods are just as important as opinions collected from 200 users. Especially, subject to the achievement of "saturation" of the results in the early stages of collecting information. (The term “saturation” in research implies that research can be stopped when topics begin to repeat, and each subsequent participant does not bring new data).
Stage 1. Definition of codes.
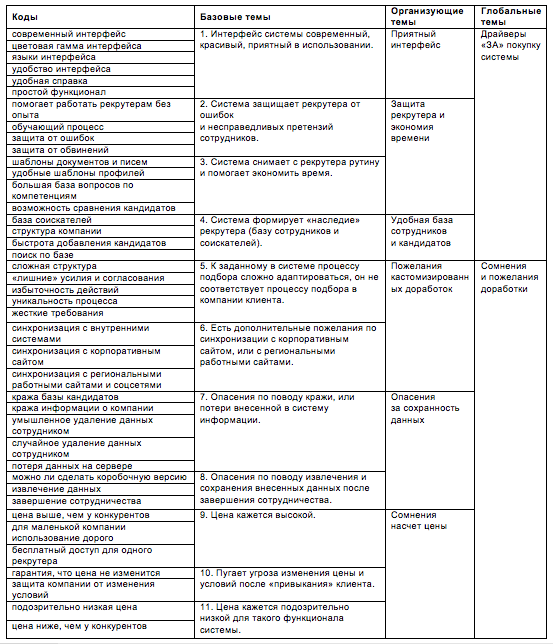
At this stage, we reviewed all the records and identified codes that convey the issues raised in the texts in a succinct way. We got 42 codes (see table below). Usually for the codes are selected schematic, monosyllabic names that are understandable to the encoder. But for the sake of clarity, we will keep the expanded names in the example in order not to additionally give their detailed transcripts.
Stage 2. Definition of topics.
The codes were combined into 11 basic themes, and those in 6 organizational themes. As a result of the final generalization, we got 2 global themes: “Drivers“ FOR ”the purchase of the system” and “Doubts and wishes for improvement”.
These global themes corresponded to the objectives of our study. For other tasks, other global themes could be highlighted. For example, “Actions for marketing” and “Actions for development”. This is the convenience of the method of thematic networks: it is quite flexible and allows you to structure the results at the right angle, so that later it would be convenient to work with them on the next stages of product development.
It turned out the following results:
Stage 3. Construction of a thematic network.
For each global theme, a separate thematic network should be built. For example, let's build a network for the first topic: “Drivers“ FOR ”the purchase of a system”.
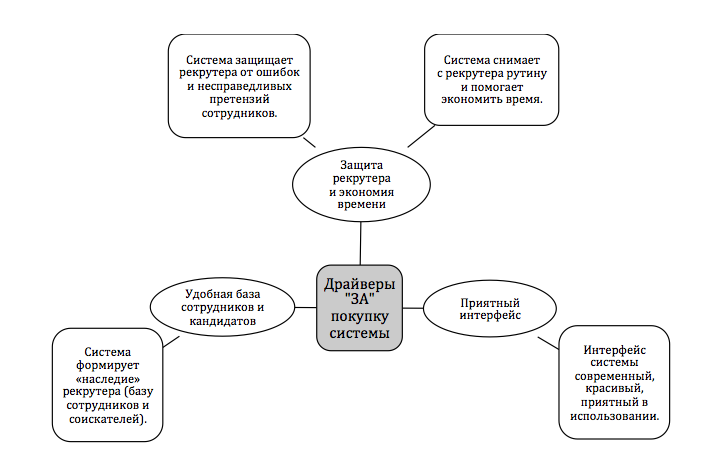
An example of a thematic network of ATS user reviews.
Stage 4. Description and explanation of the thematic network.
(At this stage, the selected topics are discussed and verbatim quotes from the original texts are given. For example, we restrict ourselves to the analysis of several topics).
(...)
Theme: "The system interface is modern, beautiful, pleasant to use."
The theme of "pleasantness" and modern interface was one of the leading users in the reviews. Often, the system interface was selected by users who conducted a comparative analysis of several recruitment automation systems. They mentioned that the system looks more modern and more pleasant than other programs with which they had to work. The interface impresses with "simplicity" and "purity", the absence of unnecessary parts and decorations.
Evgenia , head of recruitment, media holding:
“Your program is really good, namely:
- simplicity of functionality
- there is no reward of unnecessary features.
“The interface just needs to get used to.”
At the same time, when the interface was considered by users from the position of not a general perception, but a quick fulfillment of a task (to make an application, appoint a performer, attach a candidate, etc.), the complexity, “unnecessary movements” and inconveniences were mentioned. These reviews concerned the selection process incorporated into the system and formed the basis of the next topic.
Subject: “It is difficult to adapt to the selection process specified in the system, it does not correspond to the selection process in the client’s company”.
Users noted the difficulty of adapting to the selection process laid down in the system (approval of the application, appointment of performers, obligatory stages of considering candidates and submitting feedback). Often, users wanted to adapt the process to the practice of the company, or advocated a flexible system that allows you to skip some steps.
Oleg , technical director, IT company: “The reason is redundancy of actions and information that does not participate in our recruiting processes, plus the uniqueness of our internal actions that are not provided for by the system.”
Marina , HR-manager, production holding: "Constantly there are complaints from customers in the divisions that the procedure for filling out an application for the selection of personnel in the system is excessively complicated."
Subject: "Concerns about theft, or loss of information entered into the system."
Questions and doubts about the theft or loss of data were encountered both in the written comments about the system and in the user's primary questions when they got acquainted with the system. Usually, the threat was perceived in five possible scenarios: 1) the candidate database was stolen by the service provider (that is, us), 2) hacking the system and the candidate database was stolen by competitors, 3) information was lost due to customer error, 4) information was lost due to technical problems and 5) loss of information due to termination of paid access to the system.
Evgenia , head of recruitment, media holding:
“In our case, it is important for us to have all the information in our company and to minimize the risk of data loss.
We wish you to flourish and develop, but we will not be happy if access to your resource for one reason or another will be terminated and we risk losing our entire base.
When choosing a program for the work did not think this story. "
And although we immediately provided guarantees for the preservation of information (quoted fragments of the contract, guaranteed daily storage of information, referred to world experience in using cloud services, etc.), many users still expressed concerns about possible data loss.
(...)
Stage 5. Summarizing the thematic network.
(At this stage, all the topics are summarized, a general interpretation is given to the analysis results. We will skip this stage, since it is defined by the research logic and the accepted communication style in the research group and does not need clarity).
Stage 6. Interpretation of patterns.
(At this stage, the topics are compared with the hypotheses of the study, additions are made to theoretical constructs, it is discussed how well the opinions of users correspond to the ideas of developers and owners of the product. We give a fragment of such an analysis).
(...)
The review analysis revealed three particularly interesting circumstances:
1. Analytics.
The system has an analytics service that allows you to receive a report in the form of graphs and charts for various indicators of selection. Reports are automatically generated in a separate tab: plan fulfillment and adherence to job closing standards, selection funnel (job seeker conversion at each selection stage), analysis of the effectiveness of channels for attracting candidates and - in the long term - analyzing the relationship of candidates' indicators at an interview with their success indicators in the workplace (prolonged analytics to conduct global research about the company).
For a recruiter, such a service means receiving a “one click” job report, and for a manager, the ability to quickly view analytics and make a decision. Not to mention the increasingly popular topic of HR analysts, HR Big Data, etc., with the analytics service, you can conduct a variety of research in the company.
But our study showed that the topic of analytics never appeared in user reviews. People testing the system showed no need for research, or for quick control of the recruiting process. We considered this function to be very important and spent a lot of development and design resources on it, mentioned in all promotional materials, and focused on sales. But it turned out that users were interested in it on a residual basis. At least, in their reviews, the analyst did not appear.
Having obtained the results, we made a decision to pay more attention to the presentation of analytics in test access to the system and to conduct additional research on users' needs for analytics.
2. Hard process.
Conceiving the concept of the system, we focused on the automation of the best selection practices. Our company has formed recruitment services in different companies for many years, and we decided to digitize this experience. The process in the system taught and led, contained “protection against a fool”, did not allow to make standard mistakes in the process of approval of applications and consideration of candidates, defended recruiters from unfair accusations. This we considered the most important function of the system. In essence, we built the first sales just on the basis of selling the best experience, an automated process.
But communication with customers in the process of these sales gave rise to a hypothesis, which the research later confirmed: customers are not ready to buy a hard process and are not ready to change under it.
It turned out that the function that we considered to be the strongest asset of the system became its main disadvantage. In almost every review, we met requests to make the process more flexible, to remove “unnecessary” steps, to “facilitate” the system. This finding now requires new solutions in the field of development and marketing from us.
3. Assessment of competencies and comparison of candidates.
Another interesting fact was manifested in relation to the third trump of the system - the service of evaluation and comparison of candidates.
The library contains 500 questions for assessing the personal qualities and professional competencies of candidates. Each question is offered with 6 answers. After the interview, the system offers a table comparison of candidates for compliance with the position profile with scoring.
This feature of the system is its unique selling proposition. Our analysis of the market showed that there is no evaluation question with any answers in any other ATS. We spent a lot of effort on adding this function: professional psychologists and recruiters worked on creating unique questions. But the study showed that in this case, the "trump card" of the system is perceived by users ambiguously.
The competency assessment system was selectively ignored by users. Those who needed only a recruiting management system did not need a base of 500 appraisal questions. Such users compared the terms of service with the simplest competitors and expected a lower price. Our price (including the competency assessment service) seemed overpriced.
And users who understood the value of the base of evaluation questions and already got acquainted with other IT products on competency assessment, on the contrary, doubted about a suspiciously low price. And these doubts about the low price paralyzed the purchase, just as dissatisfaction with the high price of the first group of users.
After receiving such data, we made a decision to finalize the system and adapt the sales model.
A brief summary of the article
1. The methodology of qualitative research includes not only qualitative methods of collecting information, but also qualitative methods of analysis.
2. In marketing and UX research, the stage of qualitative analysis is often violated: data is processed intuitively, without using special methods, or quantitative methods are used.
3. The use of qualitative methodology does not imply the counting of individual user actions, but the search for the causes of these actions and the accompanying emotions and reflections. The goal of qualitative methods is not a prediction, but an explanation.
4. An important requirement of qualitative analysis: “Not everything that is in the data should be included in the analysis. But everything that is included in the analysis must be confirmed in the original data. ”
5. The results of the analysis of qualitative data rarely contain unexpected conclusions. But even information that seems obvious needs to be proved.
6. The method of thematic networks is a convenient method of qualitative analysis. It allows you to analyze different types of data that are difficult to other methods of analysis.
7. The method of thematic networks consists of 13 analysis steps: research data is divided into thematic fragments and sequentially grouped into topics of a higher order. The result of the analysis is a visual thematic network.
8. With the help of a thematic network it is easy to visualize the research results in presentations and reports. The network is convenient to use as the basis for a decision tree or product development plans.
Method algorithm
You can additionally read (full texts of articles are in the public domain):
1. Attride-Stirling, J. Thematic networks: an analytic tool for qualitative research / J. Attride-Stirling // Qualitative Research. - 2001. - vol. 1 no. 3. - p. 385-405.
The history of the emergence of the method of thematic networks, a description of the stages of conducting, as well as a detailed analysis of the application using the example of the study of cultural representations of sexuality.
2. Voyskunsky, A.E. Qualitative data analysis / A.E. Voyskunsky, C.V. Skripkin // Bulletin of Moscow University. Ser. 14. Psychology. - №2. –2001. - P. 93–109.
Arguments about the separation of qualitative methods of collecting information and qualitative methods of analysis, the description of another method of analysis of qualitative data - Quality content analysis.
3. A Survey and Analysis Thematic Approach as Input to the Design of Mobile Music GUIs / A. Tanaka [et al.]. - 2012.
An example of thematic analysis (simplified) in the study of users of musical mobile applications.
Source: https://habr.com/ru/post/317544/
All Articles