Monitoring Microsoft SQL Server "on the knee"
When I got a new job, the first task was set before me - to find out why one of the SQL instances is very hard on the disks. And take the necessary action to eliminate this terrible problem. I have not yet said that the disk pool was only one, and that under the load on the disks all copies of the sequel suffered? So that was it. What is most important, as it turned out, monitoring in the face of Zabbix did not collect the necessary metrics, and it was necessary to make an application and wait for the addition of these. Wait and watch the disk array “burn”. Or…
It was decided to send a request on a journey through the gears of the bureaucratic mechanism and make its own, temporary monitoring.
To begin with, let's create a database and objects necessary for collecting metrics of SQL server performance.
For simplicity, I did not specify the database creation options in the script:
')
Performance counters will be taken from the sys.dm_os_performance_counters system view. The script describes the most popular and vital counters, of course, the list can be expanded. I would like to clarify about CASE'ov. Counters that are measured in “something” / second are incremental. Those. SQL Server every second adds the current value of the counter to the existing one. To get the average current value, the value in the view should be divided by the server uptime in seconds. You can learn uptime by request:
Those. find the difference between the current moment and the time of creating tempdb, which, as you know, is created when the server starts.
Metric Granted Workspace Memory (KB) immediately translate into megabytes.
The collection process will be in the form of a procedure:
Next, we will create a procedure that will select data from our log table. The parameters end and start set the time interval for which we want to see the values. If the parameters are not set, display information in the last 3 hours.
Wrap sp_insert_perf_counters in the SQL Agent job. With start frequency - once a minute.
I will skip the creation script to not clutter up the text. At the end lay out all in the form of a single script.
Looking ahead, I’ll say that it was also because of the banal lack of RAM, so I’ll immediately give you a script that allows you to see the “fight” of the database for the buffer pool. Create a label where we will add the data:
Let's create a procedure that will output the use of the buffer pool with each separate database:
Dirty pages = modified pages. This procedure is wrapped in a jobb. I set to run once every three minutes. And create a procedure for select:
Great, data is collected, the historical base is accumulating, it remains to come up with a convenient way to view. And here good old Excel comes to the rescue.
I will give an example for performance counters, and for using the buffer pool it can be configured by analogy.
Open Excel, go to “Data” - “From other sources” - “From Microsoft Query”.
We create a new data source: driver - SQL Server or ODBC for SQL Server or SQL Server native Client, click “link” and set up our server, select our database in the parameters, in step 4 select any table (we will not need it).
Click on our created data source, click "Cancel" and the question "Continue to change the query in Microsoft Query?" Click "Yes."
Close the "Add Table" dialog. Next, go to "File" → "Run a query to SQL." We write
Choose where to put the results. I recommend leaving two lines on top for the parameters.
Go to "Data" - "Connections", go to the properties of our connection. Go to the tab “Definition” and where the text of the command is written exec sp_select_perf_counters?,? ..
Click OK and Excel prompts us to choose from which cells to take these parameters. We indicate to him these cells, put the checkboxes “to use the default” and “automatically update when the cell changes”. Personally, I filled these cells with the formulas:
Next, click on our table and go to the "Insert" - "Pivot Table" - "Pivot Chart".
Customize the pivot table:
Voila! We get graphs of performance metrics. I recommend changing the chart type to “Graph”. There are still a couple of shtrishkov. Go to the page with our data, again go to the properties of the connection and set the value to “Update every X minutes” at will. I think it is logical to set the frequency equal to the frequency of the job on the SQL server.
Now the data in the table is updated automatically. It remains to make the schedule updated. Go to the tab "developer" - "Visual Basic".
Left click on the sheet with the source data and enter the following code:
Where,
"Summary" - the name of the sheet with a pivot table. The name that is shown in brackets in the VB editor.
Summary Table1 is the name of the pivot table. You can see by clicking on the pivot table and go to the "Parameters" section.
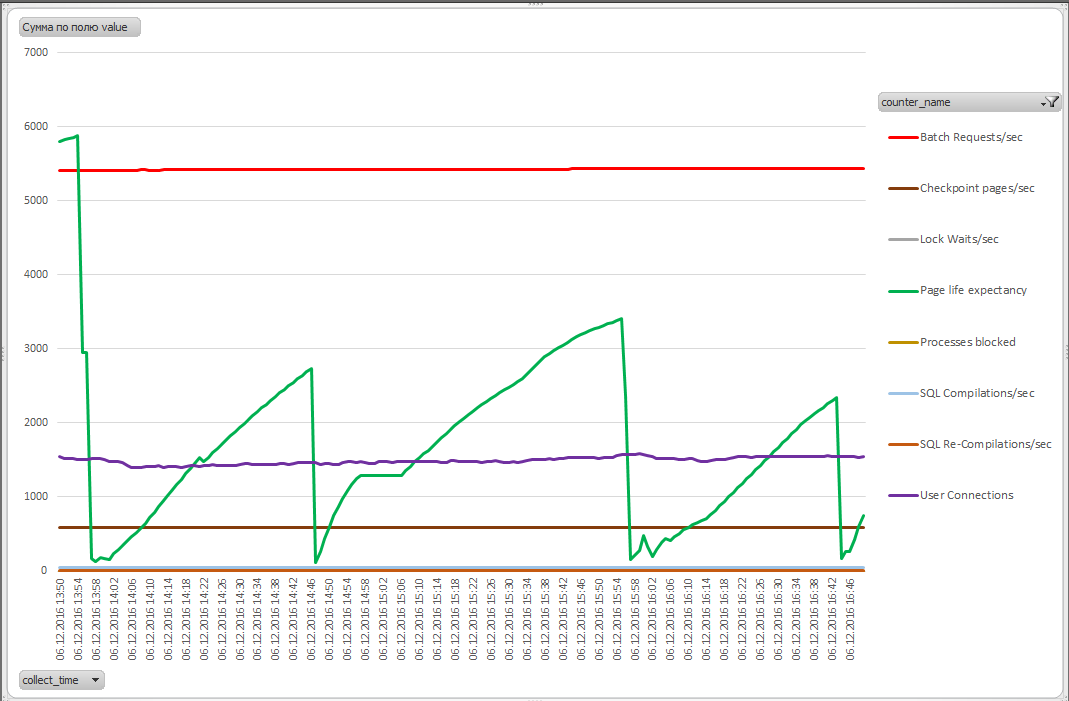
Now our schedule will be updated each time the source table is updated. An example of such a schedule:
To clone a file, it is enough to change the connection string in the properties of our connection in Excel by entering the new server name.
Regarding the “fight” of databases for the buffer pool and the calculation of the recommended amount of RAM, you can use the following script to minimize this fight. Calculates the maximum use of RAM in each database, as well as the average percentage of the size of the buffer pool relative to the total size of RAM allocated to the server and, based on this data, calculates the “ideal” size of RAM required by the server:
It is worth noting that these calculations make sense only if you are sure that the queries running on the server are optimized and do not do a full table scan at every convenient (and not so) case. You should also make sure that you monitor the Maximum Granted Workspace metric that you do not have requests on the server that eat off part of the buffer pool for sorting and hash operations.
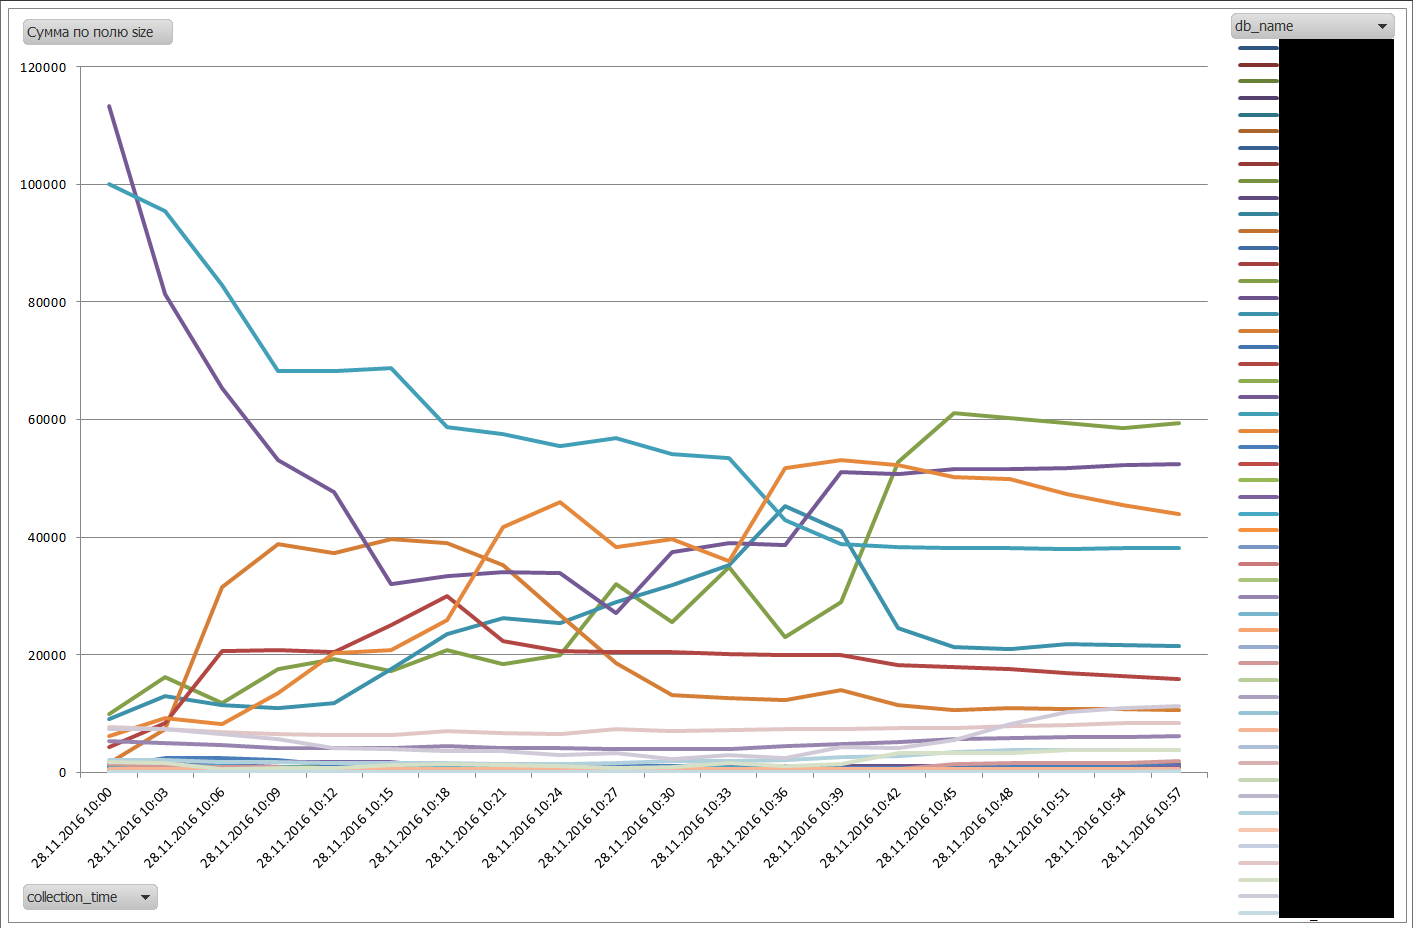
An example of a database war for buffer cache (names smeared):
By the way, it turned out that this method works much faster than our zabbiks, so I kept it in service.
As promised, the whole T-sql in one script:
Articles used:
SQL Server Memory Buffer Pools: Understand the Basics
» How to execute stored procedure in excel with parameters
It was decided to send a request on a journey through the gears of the bureaucratic mechanism and make its own, temporary monitoring.
To begin with, let's create a database and objects necessary for collecting metrics of SQL server performance.
For simplicity, I did not specify the database creation options in the script:
')
create database monitor -- GO use monitor GO create table perf_counters -- , ( collect_time datetime, counter_name nvarchar(128), value bigint ) GO CREATE CLUSTERED INDEX cidx_collect_time -- , select ON perf_counters ( collect_time ) GO Performance counters will be taken from the sys.dm_os_performance_counters system view. The script describes the most popular and vital counters, of course, the list can be expanded. I would like to clarify about CASE'ov. Counters that are measured in “something” / second are incremental. Those. SQL Server every second adds the current value of the counter to the existing one. To get the average current value, the value in the view should be divided by the server uptime in seconds. You can learn uptime by request:
select DATEDIFF(SS, (select create_date from sys.databases where name = 'tempdb'), getdate()) Those. find the difference between the current moment and the time of creating tempdb, which, as you know, is created when the server starts.
Metric Granted Workspace Memory (KB) immediately translate into megabytes.
The collection process will be in the form of a procedure:
CREATE procedure sp_insert_perf_counters AS insert into perf_counters select getdate() as Collect_time, Counter = CASE WHEN counter_name = 'Granted Workspace Memory (KB)' then 'Granted Workspace Memory (MB)' ELSE rtrim(counter_name) END, Value = CASE WHEN counter_name like '%/sec%' then cntr_value/DATEDIFF(SS, (select create_date from sys.databases where name = 'tempdb'), getdate()) WHEN counter_name like 'Granted Workspace Memory (KB)%' then cntr_value/1024 ELSE cntr_value END from sys.dm_os_performance_counters where counter_name = N'Checkpoint Pages/sec' or counter_name = N'Processes Blocked' or (counter_name = N'Lock Waits/sec' and instance_name = '_Total') or counter_name = N'User Connections' or counter_name = N'SQL Re-Compilations/sec' or counter_name = N'SQL Compilations/sec' or counter_name = 'Batch Requests/sec' or (counter_name = 'Page life expectancy' and object_name like '%Buffer Manager%') or counter_name = 'Granted Workspace Memory (KB)' GO Next, we will create a procedure that will select data from our log table. The parameters end and start set the time interval for which we want to see the values. If the parameters are not set, display information in the last 3 hours.
create procedure sp_select_perf_counters @start datetime = NULL, @end datetime = NULL as if @start is NULL set @start = dateadd(HH, -3, getdate()) if @end is NULL set @end = getdate() select collect_time, counter_name, value from monitor..perf_counters where collect_time >= @start and collect_time <= @end go Wrap sp_insert_perf_counters in the SQL Agent job. With start frequency - once a minute.
I will skip the creation script to not clutter up the text. At the end lay out all in the form of a single script.
Looking ahead, I’ll say that it was also because of the banal lack of RAM, so I’ll immediately give you a script that allows you to see the “fight” of the database for the buffer pool. Create a label where we will add the data:
CREATE TABLE BufferPoolLog( [collection_time] [datetime], [db_name] [nvarchar](128), [Size] [numeric](18, 6), [dirty_pages_size] [numeric](18, 6) ) Let's create a procedure that will output the use of the buffer pool with each separate database:
CREATE procedure sp_insert_buffer_pool_log AS insert into Monitor.dbo.BufferPoolLog SELECT getdate() as collection_time, CASE WHEN database_id = 32767 THEN 'ResourceDB' ELSE DB_NAME(database_id) END as [db_name], (COUNT(*) * 8.0) / 1024 as Size, Sum(CASE WHEN (is_modified = 1) THEN 1 ELSE 0 END) * 8 / 1024 AS dirty_pages_size FROM sys.dm_os_buffer_descriptors GROUP BY database_id Dirty pages = modified pages. This procedure is wrapped in a jobb. I set to run once every three minutes. And create a procedure for select:
CREATE procedure sp_select_buffer_pool_log @start datetime = NULL, @end datetime = NULL AS if @start is NULL set @start = dateadd(HH, -3, getdate()) if @end is NULL set @end = getdate() SELECT collection_time AS 'collection_time', db_name, Size AS 'size' FROM BufferPoolLog WHERE (collection_time>= @start And collection_time<= @end) ORDER BY collection_time, db_name Great, data is collected, the historical base is accumulating, it remains to come up with a convenient way to view. And here good old Excel comes to the rescue.
I will give an example for performance counters, and for using the buffer pool it can be configured by analogy.
Open Excel, go to “Data” - “From other sources” - “From Microsoft Query”.
We create a new data source: driver - SQL Server or ODBC for SQL Server or SQL Server native Client, click “link” and set up our server, select our database in the parameters, in step 4 select any table (we will not need it).
Click on our created data source, click "Cancel" and the question "Continue to change the query in Microsoft Query?" Click "Yes."
Close the "Add Table" dialog. Next, go to "File" → "Run a query to SQL." We write
exec sp_select_perf_counters . Click OK, go to “File” - “return data to Microsoft Excel”.Choose where to put the results. I recommend leaving two lines on top for the parameters.
Go to "Data" - "Connections", go to the properties of our connection. Go to the tab “Definition” and where the text of the command is written exec sp_select_perf_counters?,? ..
Click OK and Excel prompts us to choose from which cells to take these parameters. We indicate to him these cells, put the checkboxes “to use the default” and “automatically update when the cell changes”. Personally, I filled these cells with the formulas:
Parameter1 = TDA () - 3/24 (current date and time minus 3 hours)
Parameter2 = TDA () (current date and time)
Next, click on our table and go to the "Insert" - "Pivot Table" - "Pivot Chart".
Customize the pivot table:
Fields of legend - counter_name,
Axis fields are collect_time,
Values - value.
Voila! We get graphs of performance metrics. I recommend changing the chart type to “Graph”. There are still a couple of shtrishkov. Go to the page with our data, again go to the properties of the connection and set the value to “Update every X minutes” at will. I think it is logical to set the frequency equal to the frequency of the job on the SQL server.
Now the data in the table is updated automatically. It remains to make the schedule updated. Go to the tab "developer" - "Visual Basic".
Left click on the sheet with the source data and enter the following code:
Private Sub Worksheet_Change(ByVal Target As Range) Worksheets("").PivotTables("1").PivotCache.Refresh End Sub Where,
"Summary" - the name of the sheet with a pivot table. The name that is shown in brackets in the VB editor.
Summary Table1 is the name of the pivot table. You can see by clicking on the pivot table and go to the "Parameters" section.
Now our schedule will be updated each time the source table is updated. An example of such a schedule:
To clone a file, it is enough to change the connection string in the properties of our connection in Excel by entering the new server name.
Regarding the “fight” of databases for the buffer pool and the calculation of the recommended amount of RAM, you can use the following script to minimize this fight. Calculates the maximum use of RAM in each database, as well as the average percentage of the size of the buffer pool relative to the total size of RAM allocated to the server and, based on this data, calculates the “ideal” size of RAM required by the server:
DECLARE @ram INT, @avg_perc DECIMAL, @recommended_ram decimal --, SELECT @ram = CONVERT(INT,value_in_use ) FROM sys.configurations WHERE name = 'max server memory (MB)' ORDER BY name OPTION (RECOMPILE); -- Buffer Pool SELECT @avg_perc = avg(t.perc) FROM ( SELECT sum(Size)/@ram*100 AS perc FROM Monitor.dbo.BufferPoolLog GROUP BY collection_time ) t -- SELECT @recommended_ram = sum(t.maxsize)*100/@avg_perc FROM ( SELECT db_name, MAX(Size) AS maxsize FROM Monitor.dbo.BufferPoolLog GROUP BY db_name ) t select @ram as current_RAM_MB, @recommended_ram as Recommended_RAM_MB It is worth noting that these calculations make sense only if you are sure that the queries running on the server are optimized and do not do a full table scan at every convenient (and not so) case. You should also make sure that you monitor the Maximum Granted Workspace metric that you do not have requests on the server that eat off part of the buffer pool for sorting and hash operations.
An example of a database war for buffer cache (names smeared):
By the way, it turned out that this method works much faster than our zabbiks, so I kept it in service.
As promised, the whole T-sql in one script:
Script
create database monitor -- GO use monitor GO create table perf_counters -- , ( collect_time datetime, counter_name nvarchar(128), value bigint ) GO CREATE CLUSTERED INDEX cidx_collect_time -- , select ON perf_counters ( collect_time ) GO CREATE TABLE BufferPoolLog ( collection_time datetime NOT NULL, db_name nvarchar(128) NULL, Size numeric(18, 6) NULL, dirty_pages_size numeric(18, 6) ) GO CREATE CLUSTERED INDEX cidx_collection_time ON BufferPoolLog ( collection_time ) GO create procedure sp_insert_perf_counters -- , AS insert into perf_counters select getdate() as Collect_time, rtrim(counter_name) as Counter, Value = CASE WHEN counter_name like '%/sec%' --, "- " - , .. "" - . , then cntr_value/DATEDIFF(SS, (select create_date from sys.databases where name = 'tempdb'), getdate()) ELSE cntr_value END from sys.dm_os_performance_counters where counter_name = N'Checkpoint Pages/sec' or counter_name = N'Processes Blocked' or (counter_name = N'Lock Waits/sec' and instance_name = '_Total') or counter_name = N'User Connections' or counter_name = N'SQL Re-Compilations/sec' or counter_name = N'SQL Compilations/sec' or counter_name = 'Batch Requests/sec' or (counter_name = 'Page life expectancy' and object_name like '%Buffer Manager%') GO create procedure sp_select_perf_counters -- , @start datetime = NULL, @end datetime = NULL as if @start is NULL set @start = dateadd(HH, -3, getdate()) if @end is NULL set @end = getdate() select collect_time, counter_name, value from monitor..perf_counters where collect_time >= @start and collect_time <= @end go CREATE procedure sp_insert_buffer_pool_log --, AS insert into BufferPoolLog SELECT getdate() as collection_time, CASE WHEN database_id = 32767 THEN 'ResourceDB' ELSE DB_NAME(database_id) END as [db_name], (COUNT(*) * 8.0) / 1024 as Size, Sum(CASE WHEN (is_modified = 1) THEN 1 ELSE 0 END) * 8 / 1024 AS dirty_pages_size FROM sys.dm_os_buffer_descriptors GROUP BY database_id GO CREATE procedure sp_select_buffer_pool_log @start datetime = NULL, @end datetime = NULL AS if @start is NULL set @start = dateadd(HH, -3, getdate()) if @end is NULL set @end = getdate() SELECT collection_time, db_name, Size FROM BufferPoolLog WHERE (collection_time>= @start And collection_time<= @end) ORDER BY collection_time, db_name GO -- , USE [msdb] GO BEGIN TRANSACTION DECLARE @ReturnCode INT SELECT @ReturnCode = 0 IF NOT EXISTS (SELECT name FROM msdb.dbo.syscategories WHERE name=N'[Uncategorized (Local)]' AND category_class=1) BEGIN EXEC @ReturnCode = msdb.dbo.sp_add_category @class=N'JOB', @type=N'LOCAL', @name=N'[Uncategorized (Local)]' IF (@@ERROR <> 0 OR @ReturnCode <> 0) GOTO QuitWithRollback END DECLARE @jobId BINARY(16) EXEC @ReturnCode = msdb.dbo.sp_add_job @job_name=N'collect_perf_counters', @enabled=1, @notify_level_eventlog=0, @notify_level_email=0, @notify_level_netsend=0, @notify_level_page=0, @delete_level=0, @description=N'No description available.', @category_name=N'[Uncategorized (Local)]', @owner_login_name=N'sa', @job_id = @jobId OUTPUT IF (@@ERROR <> 0 OR @ReturnCode <> 0) GOTO QuitWithRollback EXEC @ReturnCode = msdb.dbo.sp_add_jobstep @job_id=@jobId, @step_name=N'sp_insert_perf_counters', @step_id=1, @cmdexec_success_code=0, @on_success_action=1, @on_success_step_id=0, @on_fail_action=2, @on_fail_step_id=0, @retry_attempts=0, @retry_interval=0, @os_run_priority=0, @subsystem=N'TSQL', @command=N'sp_insert_perf_counters', @database_name=N'monitor', @flags=0 IF (@@ERROR <> 0 OR @ReturnCode <> 0) GOTO QuitWithRollback EXEC @ReturnCode = msdb.dbo.sp_update_job @job_id = @jobId, @start_step_id = 1 IF (@@ERROR <> 0 OR @ReturnCode <> 0) GOTO QuitWithRollback EXEC @ReturnCode = msdb.dbo.sp_add_jobschedule @job_id=@jobId, @name=N'Every 1 minute', @enabled=1, @freq_type=4, @freq_interval=1, @freq_subday_type=4, @freq_subday_interval=1, @freq_relative_interval=0, @freq_recurrence_factor=0, @active_start_date=20161202, @active_end_date=99991231, @active_start_time=0, @active_end_time=235959 IF (@@ERROR <> 0 OR @ReturnCode <> 0) GOTO QuitWithRollback EXEC @ReturnCode = msdb.dbo.sp_add_jobserver @job_id = @jobId, @server_name = N'(local)' IF (@@ERROR <> 0 OR @ReturnCode <> 0) GOTO QuitWithRollback COMMIT TRANSACTION GOTO EndSave QuitWithRollback: IF (@@TRANCOUNT > 0) ROLLBACK TRANSACTION EndSave: GO -- , . BEGIN TRANSACTION DECLARE @ReturnCode INT SELECT @ReturnCode = 0 IF NOT EXISTS (SELECT name FROM msdb.dbo.syscategories WHERE name=N'[Uncategorized (Local)]' AND category_class=1) BEGIN EXEC @ReturnCode = msdb.dbo.sp_add_category @class=N'JOB', @type=N'LOCAL', @name=N'[Uncategorized (Local)]' IF (@@ERROR <> 0 OR @ReturnCode <> 0) GOTO QuitWithRollback END DECLARE @jobId BINARY(16) EXEC @ReturnCode = msdb.dbo.sp_add_job @job_name=N'BufferPoolUsage', @enabled=1, @notify_level_eventlog=0, @notify_level_email=0, @notify_level_netsend=0, @notify_level_page=0, @delete_level=0, @description=N'No description available.', @category_name=N'[Uncategorized (Local)]', @owner_login_name=N'sa', @job_id = @jobId OUTPUT IF (@@ERROR <> 0 OR @ReturnCode <> 0) GOTO QuitWithRollback EXEC @ReturnCode = msdb.dbo.sp_add_jobstep @job_id=@jobId, @step_name=N'1', @step_id=1, @cmdexec_success_code=0, @on_success_action=1, @on_success_step_id=0, @on_fail_action=2, @on_fail_step_id=0, @retry_attempts=0, @retry_interval=0, @os_run_priority=0, @subsystem=N'TSQL', @command=N'sp_insert_buffer_pool_log', @database_name=N'Monitor', @flags=0 IF (@@ERROR <> 0 OR @ReturnCode <> 0) GOTO QuitWithRollback EXEC @ReturnCode = msdb.dbo.sp_update_job @job_id = @jobId, @start_step_id = 1 IF (@@ERROR <> 0 OR @ReturnCode <> 0) GOTO QuitWithRollback EXEC @ReturnCode = msdb.dbo.sp_add_jobschedule @job_id=@jobId, @name=N'Every 3 minutes', @enabled=1, @freq_type=4, @freq_interval=1, @freq_subday_type=4, @freq_subday_interval=3, @freq_relative_interval=0, @freq_recurrence_factor=0, @active_start_date=20161117, @active_end_date=99991231, @active_start_time=0, @active_end_time=235959 IF (@@ERROR <> 0 OR @ReturnCode <> 0) GOTO QuitWithRollback EXEC @ReturnCode = msdb.dbo.sp_add_jobserver @job_id = @jobId, @server_name = N'(local)' IF (@@ERROR <> 0 OR @ReturnCode <> 0) GOTO QuitWithRollback COMMIT TRANSACTION GOTO EndSave QuitWithRollback: IF (@@TRANCOUNT > 0) ROLLBACK TRANSACTION EndSave: GO Articles used:
SQL Server Memory Buffer Pools: Understand the Basics
» How to execute stored procedure in excel with parameters
Source: https://habr.com/ru/post/317426/
All Articles