Optimize NFV performance for customers' local hardware with virtualization
In solutions aimed at virtualization of real network functions, the main factor is the ability to provide predictable and guaranteed performance and throughput for customer traffic. In many projects designed to test the concept, considerable attention was paid to increasing network bandwidth, but the amount of delays is an equally important indicator of network performance (and in some cases much more important). This article describes the test environment in the BT Adastral Park laboratories based on the Intel Open Network Platform architecture. This test environment is designed to evaluate the performance of customers' local hardware with virtualization.

Test results show a significant increase in performance in terms of reducing delays and reducing jitter when optimized using the Data Plane Development Kit. For example, the average delays were reduced by 38–74% (depending on the packet profile), and the maximum delays were reduced by 6 times. Such an analysis of performance optimization will be of particular importance for intelligent load and resource management in both existing networks and promising 5G networks.
Network Functions Virtualization Technology (NFV) is rapidly moving from lab conditions to production environments and to trial operation with real customers 1 . Work is underway on standardization: the corresponding group of sectoral technical conditions (ISG) at the European Telecommunication Standards Institute (ETSI) deals with it. The main areas of standardization are performance measurement and best practices 2 . The most important performance metric is network bandwidth, but in this article the performance problem is examined from a different angle: the issue of sensitivity to delays is discussed. In particular, we study the case of using local equipment of customers with virtualization (vCPE) in corporations, when a certain set of virtual network functions (VNF) is usually located in the customer's local IT environment. In the ETSI 3 document, this model is called the VE-CPE (Fig. 1).
')
Examples of network functions in a customer's local environment that can run as VNF on standard x86 servers with a hypervisor include, but are not limited to, routers, firewalls, session boundary controllers, and WAN accelerators. Branches usually need a not too powerful access channel to the global network (compared to central offices): often the connection capacity to the global network can be several tens or hundreds of megabits per second, that is, relatively little compared to the main channels, whose throughput can reach and exceed one gigabit per second. Therefore, in terms of performance, it is not so much the maximum throughput capacity of the vCPE implementation in the branch that is important as the ability to minimize delays and jitter (jitter).
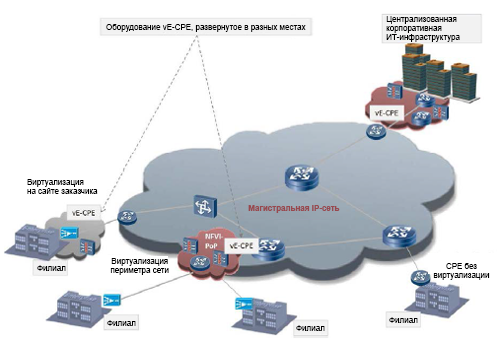
Figure 1. An example of the use of virtual corporate equipment in the customer's local environment (VE-CPE) in branches.
In most corporate networks, where branch offices are connected to the global network infrastructure, part of the traffic will come from voice over IP (VoIP). This traffic is characterized by tighter frames in terms of delays and jitter required to provide predictable and guaranteed performance. Even if the network functions related to voice transmission (for example, session boundary controllers - SBC) are implemented using physical devices without virtualization, other functions in the customer’s local environment that carry end-user traffic can be virtual: an obvious example is customer (CE). Therefore, it is important to tune the performance of the NFV infrastructure so that it provides the same level of predictability for delays and jitter. This will provide a clearer picture of the impact of NFV infrastructure components on the overall performance of latency-sensitive applications.
The second part describes the Intel Open Networking Platform (Intel ONP) and the Data Plane Development Kit (DPDK) , while the third part describes how to test the vCPE environment in terms of estimating delays and jitter. The results of the actual tests are given in the fourth part. The fifth part contains conclusions, and the sixth - recommended materials for further study.
The methods for determining and implementing NFV solutions by telecom operators for various usage scenarios, such as vCPE, depend on a number of factors, including cost, technical conditions and interaction with solutions from other vendors. The result is open-source NFV solutions, such as using kernel-based virtual machine (KVM) hypervisor technology with Open vSwitch * (OVS) , and open management tools such as OpenStack * . Intel ONP integrates a number of such components with open source and forms a modular architectural platform for NFV 4 .
One of the most important components of the Intel ONP architecture (in terms of performance) is DPDK, which can be used to increase VNF performance on the KVM hypervisor. In fig. 2 (a) shows a diagram of the usual Open vSwitch, and in fig. 2 (b) - Open vSwitch with DPDK. In the standard OVS implementation, packet forwarding between network adapters occurs along a path located in the kernel space of the virtual switch. It is a simple flow table indicating what to do with incoming packets. Only the first packets of the flow need to enter the user space of the virtual switch (along the “slow path”), since they do not match any of the entries in the simple table in the kernel data path. After the OVS user space processes the first packet in the stream, it updates the table in the kernel space and all subsequent packets no longer fall into the user space. Due to this, both the number of entries in the kernel space flow table and the number of packets that need to enter user space, the processing of which requires significant computational resources, is reduced.
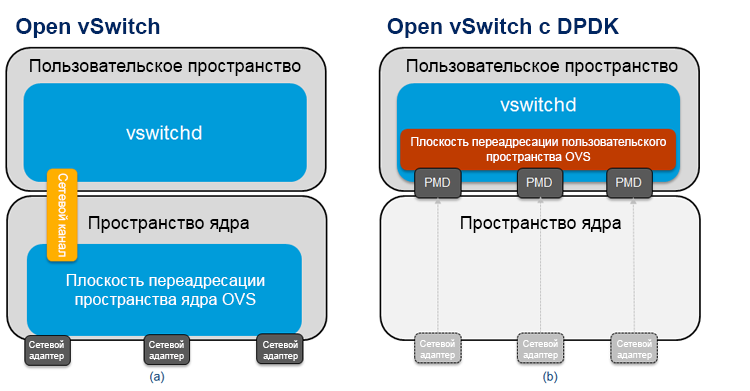
Figure 2. Scheme of (a) Open vSwitch * and (b) Data Plane Development Kit vSwitch.
In the Open vSwitch model with DPDK (Fig. 2 (b)), the main forwarding plane (sometimes called the “fast path”) is in the OVS user space and uses the DPDK. One of the main differences of this architecture is that the network adapters here are the polling mode drivers (PMD), since the incoming packets are continuously polled and not managed asynchronously with interrupts. The initial packets of the stream are sent to another module in user space along the same path as the packets in the case of the “fast path” of the kernel.
In fig. Figure 3 shows the actual traffic flows from the OVS to the guest virtual machine (VM), which in the context of this article serves as a virtual router. In the standard OVS implementation, the OVS redirection is completed in kernel space (Fig. 3 (a)), and in the OVS model with DPDK, the OVS redirection is completed in user space (Fig. 3 (b)); The virtio queues of guest virtual machines are mapped to OVS DPDK, so OVS can directly read and write data to them. The traffic path "from user space to user space" usually has a higher performance than the path through the kernel space. Please note that in both architectures, the guest VM can be either a DPDK or standard Linux * drivers. The tests described below use the VNF with DPDK drivers in a high-performance scenario.
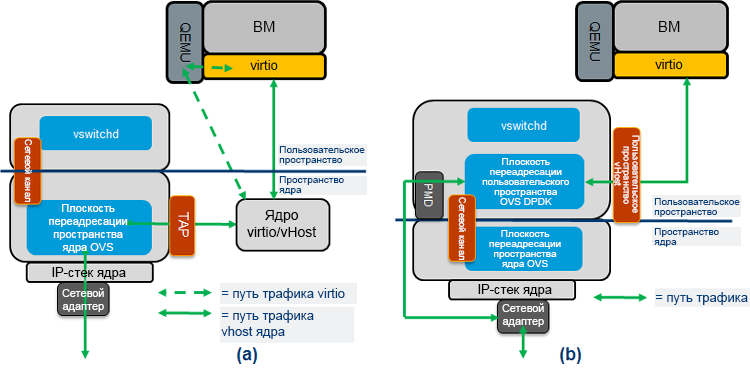
Figure 3. Traffic flow: (a) Open vSwitch * and (b) Data Plane Development Kit vSwitch.
Theoretically, the performance of Open vSwitch with DPDK should be higher than the standard OVS model. However, it is important to test this in practice using certain tests. The following section describes the test system, and then the actual results.
The main components of the test system are shown in Fig. 3
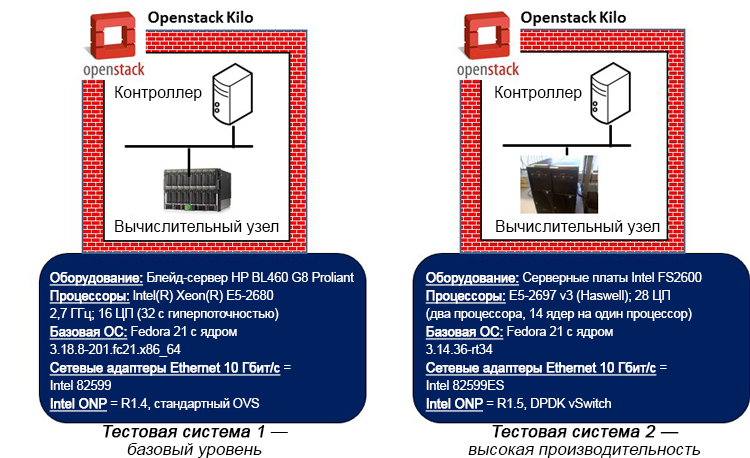
Figure 4. Base level and high performance test systems (the hardware information shown refers to the compute nodes representing the systems under test).
Two reference test systems are used to evaluate and compare the impact of a high-performance architecture, such as DPDK, on the results of delays and jitter. Each test system includes one OpenStack controller node and the corresponding compute node built using the Kilo version system. The compute node and its associated guest VNFs running on the hypervisor represent the systems under test.
The benchmark test system uses an Intel Xeon E5-2680 processor (Sandy Bridge architecture) without any optimization of the BIOS settings. The high-performance test system uses an Intel Xeon E5-2697 v3 processor (Haswell architecture) and made some BIOS settings to increase performance while reducing power consumption and turn off C and P states. The base system uses the standard data path in the kernel space, while the high-performance system uses the OVS DPDK data path. Fedora * 21 is used as the base OS in both cases, but the base-level system uses the standard non-real-time kernel (3.18), and the high-performance system uses the real-time Linux kernel (3.14) with the appropriate configuration settings (isolation vSwitch and VM cores) from the OS of the primary system, disabling the extended security of Linux, using polling when idle, and selecting the most appropriate timestamp timer). The base system uses the standard OpenStack settings regarding the installation of the VM and the assignment of network resources. In a high-performance system, the setup is more accurate: you can assign dedicated CPUs to the vSwitch and VNF. In addition, in a high-performance system, the use of VNF CPUs and memory installed on the same physical system is guaranteed, as well as the use of specific CPUs for direct connection to the interfaces of physical network adapters on the server.
In both test systems, the Brocade 5600 * R3.5 virtual router was used as the actual VNF in all tests, and the Spirent Test Center C1 * load testing device was used for a long test of traffic. In a high-performance system, the virtual router uses DPDK drivers. As shown in fig. 5, single VNF systems with dual VNF service chains were tested.
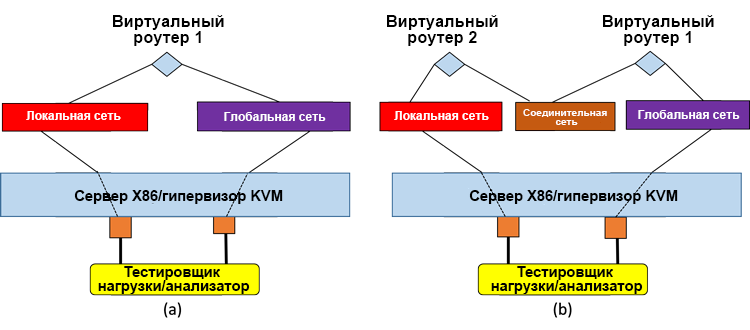
Figure 5. Systems under test: (a) a single virtual router, (b) two virtual routers in a sequential service chain.
The test systems were set up in such a way as to ensure the bandwidth sufficient for the work of the branches' offices (no more than 100 Mbit / s) at the expense of the accuracy of measurements of delays and jitter. The following package profiles were used for all tests:
The test equipment uses a time stamped signature to determine the delay between frames. The signature is located at the end of the payload next to the frame check sequence (FCS), it contains a time stamp, sequence numbers and a flow identifier. By “jitter” is meant the time difference between two incoming frames in one stream. Therefore, the difference in packet delays is measured this way. The same traffic loads were generated to the system under test in each direction, consisting of one traffic stream. The results in the next section describe the worst metrics for a particular direction (i.e., reduced delays, jitter, etc., are given only for unidirectional traffic, not for two-way transmission). It should be noted that the results shown are related to the established network operation: the initial results are reset in approximately 20 seconds, and then the test is performed within the allotted time. This solution allows to obtain reliable results that are not affected by the first packets of the flow, going along the "slow path".
The average delay of one-way traffic, measured at five-minute intervals for four different packet profiles, is shown for a single VNF in Figure 2. 6 and on the double VNF in fig. 7
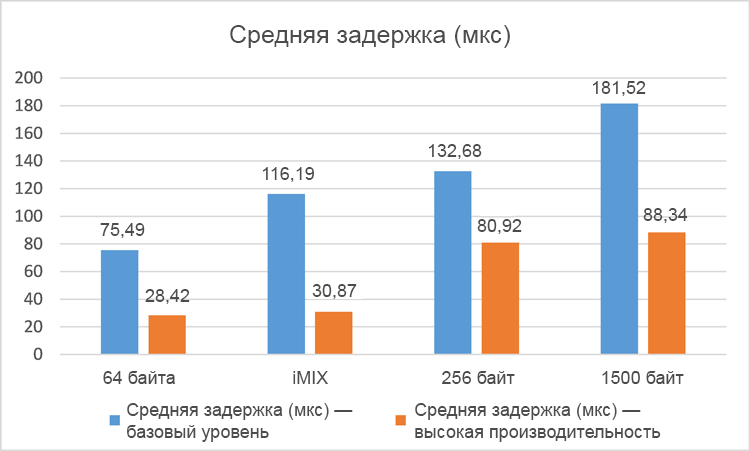
Figure 6. Average delay (in microseconds) for a single network with virtualization (the smaller, the better).
The results of average delays for different packet profiles clearly indicate a significant increase in productivity (decrease in average delays) in the high performance system compared to the base level system. In tests with a single VNF, delays were reduced by 38–74%, and in tests with a dual VNF, delays decreased by 34–66%. As expected, the total latency in the case of dual VNF was slightly higher in both test systems due to packet switching between two VNF instances and in virtual switches in the hypervisor. Please note that these tests recorded zero packet loss.
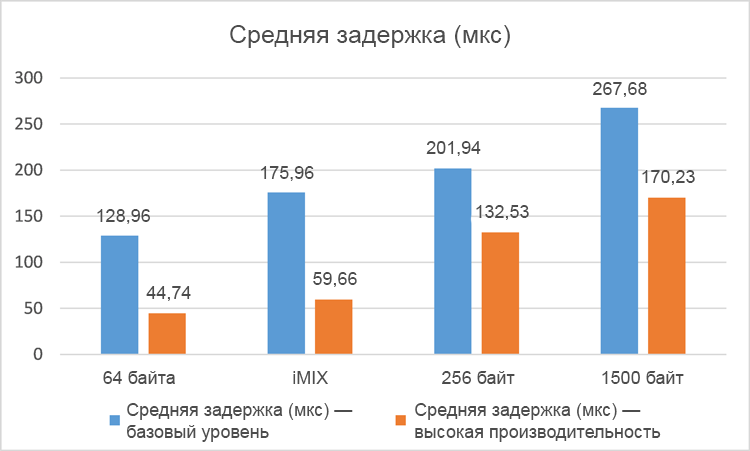
Figure 7. Average delay (in microseconds) for two networks with virtualization (the smaller, the better).
It makes sense to take a closer look at the test results with a specific package profile. For example, tests with 256-byte layouts more accurately reproduce VoIP frames generated by the RTP protocol with G.711 encoding 5 . In fig. Figure 8 shows the minimum, average, and maximum one-way traffic delays for single and double VNF using 256-byte packets.
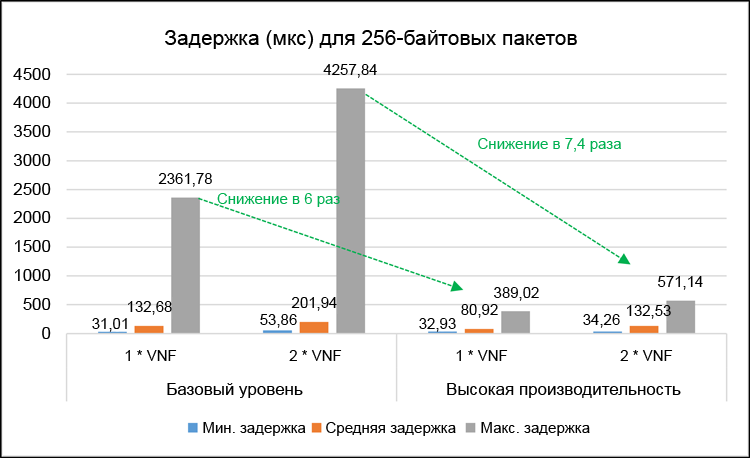
Figure 8. Detailed delay results (in microseconds) for 256-byte packets.
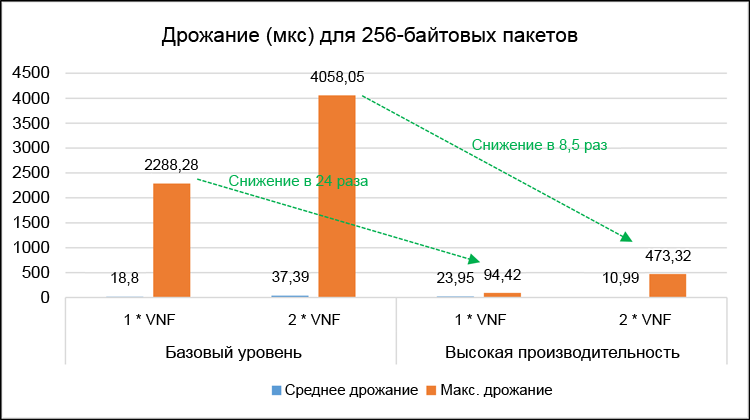
Figure 9. Detailed jitter results (in microseconds) for 256-byte packets.
In fig. 9 shows the corresponding average and maximum jitter values of one-way traffic. Maximum delay and jitter values are important for evaluating the worst performance characteristics of both test systems. In a high-performance system, the maximum delays were reduced 6 times for a single VNF and 7.4 times for a dual VNF. The maximum jitter was reduced, respectively, 24 times and 8.5 times. Please note that these tests recorded zero packet loss.
It is important not only to evaluate performance over short intervals, but also to study possible performance fluctuations over a long time. In fig. 10 shows the results of tests of maximum delays in tests lasting 5 minutes compared with tests lasting 16 hours for 256-byte packets and a single VNF. In general, the results indicate approximately the same increase in performance in an optimized system compared to the baseline system: maximum delays decreased 5 times for the 16-hour test and 6 times for the 5-minute test. It is important to note that the maximum delay values are significantly higher in the 16-hour tests. This can be explained by very rare system interruption events (i.e. maintenance tasks) that affect a very small number of test packets. Despite this, the maximum delay value for one-way traffic in 16-hour tests with 256-byte packets was only 2 ms. This is quite a suitable result, the threshold for delaying one-way voice traffic is 150 ms according to ITU-T G.114 6 . In other words, the increase in delays due to the addition of vCPT is in the worst case only 1.3% of the total allowable delays. Even in the base level system, the maximum delays of one-way traffic were 9.95 ms, which is only 6.6% of the total allowable value.
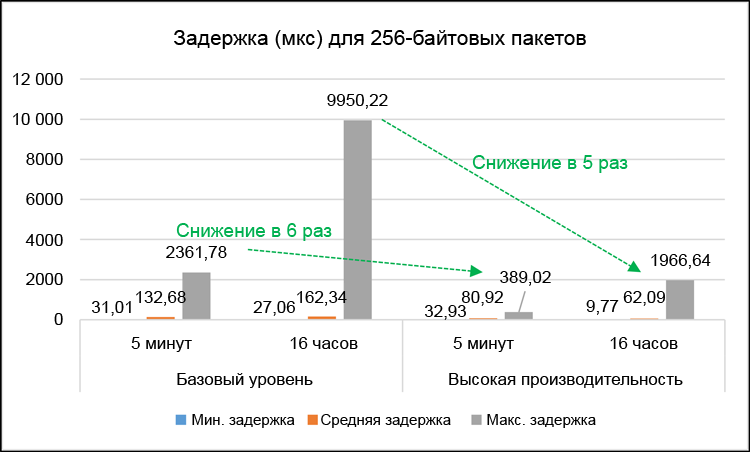
Figure 10. The results of long tests of delays in milliseconds (comparison of 16-hour and 5-minute tests).
This article describes the fine-tuning of the KVM hypervisor-based virtual platform infrastructure CPE. In particular, the use of some components of the Intel ONP architecture, such as DPDK, can contribute to a significant increase in performance compared to the basic setting (without optimization). In tests with a single VNF, delays in one-way traffic decreased by 38–74%, and in tests with a dual VNF, delays decreased by 34–66%. In tests close to VoIP traffic, where 256-byte packets were used, the maximum delays were reduced by 6 times (for a single VNF) and 7.4 times (for a dual VNF), and the maximum jitter, respectively, by 24 times and 8 ,5 times.
Based on the results of the experiments, it can be concluded that tuning the performance of the NFV infrastructure for delay-sensitive applications, such as VoIP, will provide more specific indicators of overall performance in terms of latency and jitter compared to the basic configuration (without optimization). The decision to apply optimization by the network operator will largely depend on the required set of VNF functions supported by the vCPE infrastructure, as well as on the extent to which performance metrics specified in the service level agreement (for example, delays and jitter levels) are associated with on these vnf functions. In practice, the actual service level agreements used by network operators will contain performance targets within the operator’s own backbone and transit network and will vary by region. The times of two-way transmission of IP packets in 30–40 ms for Europe, 40–50 ms for North America and up to 90 ms for transatlantic channels are typical examples and standards of average delays.
If network operators decide to use NFV optimization using components such as DPDK instead of out-of-the-box solutions with factory settings, they should evaluate the potential impact of optimization on high-level management solutions: a clearer understanding of the parameters and settings of the underlying infrastructure will be required to ensure that VNF functions are prepared and managed according to the specified performance requirements. The experiments described in this article can be considered as a basis for a more detailed understanding of how to optimize performance, their applicability to existing networks and to promising 5G infrastructures.
Possible topics for further study include the following:
It is obvious that in this area there are still many interesting problems and problems to be considered.
Test results show a significant increase in performance in terms of reducing delays and reducing jitter when optimized using the Data Plane Development Kit. For example, the average delays were reduced by 38–74% (depending on the packet profile), and the maximum delays were reduced by 6 times. Such an analysis of performance optimization will be of particular importance for intelligent load and resource management in both existing networks and promising 5G networks.
I. Introduction
Network Functions Virtualization Technology (NFV) is rapidly moving from lab conditions to production environments and to trial operation with real customers 1 . Work is underway on standardization: the corresponding group of sectoral technical conditions (ISG) at the European Telecommunication Standards Institute (ETSI) deals with it. The main areas of standardization are performance measurement and best practices 2 . The most important performance metric is network bandwidth, but in this article the performance problem is examined from a different angle: the issue of sensitivity to delays is discussed. In particular, we study the case of using local equipment of customers with virtualization (vCPE) in corporations, when a certain set of virtual network functions (VNF) is usually located in the customer's local IT environment. In the ETSI 3 document, this model is called the VE-CPE (Fig. 1).
')
Examples of network functions in a customer's local environment that can run as VNF on standard x86 servers with a hypervisor include, but are not limited to, routers, firewalls, session boundary controllers, and WAN accelerators. Branches usually need a not too powerful access channel to the global network (compared to central offices): often the connection capacity to the global network can be several tens or hundreds of megabits per second, that is, relatively little compared to the main channels, whose throughput can reach and exceed one gigabit per second. Therefore, in terms of performance, it is not so much the maximum throughput capacity of the vCPE implementation in the branch that is important as the ability to minimize delays and jitter (jitter).
Figure 1. An example of the use of virtual corporate equipment in the customer's local environment (VE-CPE) in branches.
In most corporate networks, where branch offices are connected to the global network infrastructure, part of the traffic will come from voice over IP (VoIP). This traffic is characterized by tighter frames in terms of delays and jitter required to provide predictable and guaranteed performance. Even if the network functions related to voice transmission (for example, session boundary controllers - SBC) are implemented using physical devices without virtualization, other functions in the customer’s local environment that carry end-user traffic can be virtual: an obvious example is customer (CE). Therefore, it is important to tune the performance of the NFV infrastructure so that it provides the same level of predictability for delays and jitter. This will provide a clearer picture of the impact of NFV infrastructure components on the overall performance of latency-sensitive applications.
The second part describes the Intel Open Networking Platform (Intel ONP) and the Data Plane Development Kit (DPDK) , while the third part describes how to test the vCPE environment in terms of estimating delays and jitter. The results of the actual tests are given in the fourth part. The fifth part contains conclusions, and the sixth - recommended materials for further study.
Ii. Open Network Platform and Data Plane Development Kit
The methods for determining and implementing NFV solutions by telecom operators for various usage scenarios, such as vCPE, depend on a number of factors, including cost, technical conditions and interaction with solutions from other vendors. The result is open-source NFV solutions, such as using kernel-based virtual machine (KVM) hypervisor technology with Open vSwitch * (OVS) , and open management tools such as OpenStack * . Intel ONP integrates a number of such components with open source and forms a modular architectural platform for NFV 4 .
One of the most important components of the Intel ONP architecture (in terms of performance) is DPDK, which can be used to increase VNF performance on the KVM hypervisor. In fig. 2 (a) shows a diagram of the usual Open vSwitch, and in fig. 2 (b) - Open vSwitch with DPDK. In the standard OVS implementation, packet forwarding between network adapters occurs along a path located in the kernel space of the virtual switch. It is a simple flow table indicating what to do with incoming packets. Only the first packets of the flow need to enter the user space of the virtual switch (along the “slow path”), since they do not match any of the entries in the simple table in the kernel data path. After the OVS user space processes the first packet in the stream, it updates the table in the kernel space and all subsequent packets no longer fall into the user space. Due to this, both the number of entries in the kernel space flow table and the number of packets that need to enter user space, the processing of which requires significant computational resources, is reduced.
Figure 2. Scheme of (a) Open vSwitch * and (b) Data Plane Development Kit vSwitch.
In the Open vSwitch model with DPDK (Fig. 2 (b)), the main forwarding plane (sometimes called the “fast path”) is in the OVS user space and uses the DPDK. One of the main differences of this architecture is that the network adapters here are the polling mode drivers (PMD), since the incoming packets are continuously polled and not managed asynchronously with interrupts. The initial packets of the stream are sent to another module in user space along the same path as the packets in the case of the “fast path” of the kernel.
In fig. Figure 3 shows the actual traffic flows from the OVS to the guest virtual machine (VM), which in the context of this article serves as a virtual router. In the standard OVS implementation, the OVS redirection is completed in kernel space (Fig. 3 (a)), and in the OVS model with DPDK, the OVS redirection is completed in user space (Fig. 3 (b)); The virtio queues of guest virtual machines are mapped to OVS DPDK, so OVS can directly read and write data to them. The traffic path "from user space to user space" usually has a higher performance than the path through the kernel space. Please note that in both architectures, the guest VM can be either a DPDK or standard Linux * drivers. The tests described below use the VNF with DPDK drivers in a high-performance scenario.
Figure 3. Traffic flow: (a) Open vSwitch * and (b) Data Plane Development Kit vSwitch.
Theoretically, the performance of Open vSwitch with DPDK should be higher than the standard OVS model. However, it is important to test this in practice using certain tests. The following section describes the test system, and then the actual results.
Iii. Test system description
The main components of the test system are shown in Fig. 3
Figure 4. Base level and high performance test systems (the hardware information shown refers to the compute nodes representing the systems under test).
Two reference test systems are used to evaluate and compare the impact of a high-performance architecture, such as DPDK, on the results of delays and jitter. Each test system includes one OpenStack controller node and the corresponding compute node built using the Kilo version system. The compute node and its associated guest VNFs running on the hypervisor represent the systems under test.
The benchmark test system uses an Intel Xeon E5-2680 processor (Sandy Bridge architecture) without any optimization of the BIOS settings. The high-performance test system uses an Intel Xeon E5-2697 v3 processor (Haswell architecture) and made some BIOS settings to increase performance while reducing power consumption and turn off C and P states. The base system uses the standard data path in the kernel space, while the high-performance system uses the OVS DPDK data path. Fedora * 21 is used as the base OS in both cases, but the base-level system uses the standard non-real-time kernel (3.18), and the high-performance system uses the real-time Linux kernel (3.14) with the appropriate configuration settings (isolation vSwitch and VM cores) from the OS of the primary system, disabling the extended security of Linux, using polling when idle, and selecting the most appropriate timestamp timer). The base system uses the standard OpenStack settings regarding the installation of the VM and the assignment of network resources. In a high-performance system, the setup is more accurate: you can assign dedicated CPUs to the vSwitch and VNF. In addition, in a high-performance system, the use of VNF CPUs and memory installed on the same physical system is guaranteed, as well as the use of specific CPUs for direct connection to the interfaces of physical network adapters on the server.
In both test systems, the Brocade 5600 * R3.5 virtual router was used as the actual VNF in all tests, and the Spirent Test Center C1 * load testing device was used for a long test of traffic. In a high-performance system, the virtual router uses DPDK drivers. As shown in fig. 5, single VNF systems with dual VNF service chains were tested.
Figure 5. Systems under test: (a) a single virtual router, (b) two virtual routers in a sequential service chain.
The test systems were set up in such a way as to ensure the bandwidth sufficient for the work of the branches' offices (no more than 100 Mbit / s) at the expense of the accuracy of measurements of delays and jitter. The following package profiles were used for all tests:
- 64-byte frames (25 Mbps bidirectional load)
- 256-byte frames (25 Mbit / s bidirectional load)
- Mixing iMix frames in a realistic way (50 Mbps bidirectional load)
- 1500-byte frames (100 Mbps bidirectional load)
The test equipment uses a time stamped signature to determine the delay between frames. The signature is located at the end of the payload next to the frame check sequence (FCS), it contains a time stamp, sequence numbers and a flow identifier. By “jitter” is meant the time difference between two incoming frames in one stream. Therefore, the difference in packet delays is measured this way. The same traffic loads were generated to the system under test in each direction, consisting of one traffic stream. The results in the next section describe the worst metrics for a particular direction (i.e., reduced delays, jitter, etc., are given only for unidirectional traffic, not for two-way transmission). It should be noted that the results shown are related to the established network operation: the initial results are reset in approximately 20 seconds, and then the test is performed within the allotted time. This solution allows to obtain reliable results that are not affected by the first packets of the flow, going along the "slow path".
Iv. Test results
A. Mixed Tests
The average delay of one-way traffic, measured at five-minute intervals for four different packet profiles, is shown for a single VNF in Figure 2. 6 and on the double VNF in fig. 7
Figure 6. Average delay (in microseconds) for a single network with virtualization (the smaller, the better).
The results of average delays for different packet profiles clearly indicate a significant increase in productivity (decrease in average delays) in the high performance system compared to the base level system. In tests with a single VNF, delays were reduced by 38–74%, and in tests with a dual VNF, delays decreased by 34–66%. As expected, the total latency in the case of dual VNF was slightly higher in both test systems due to packet switching between two VNF instances and in virtual switches in the hypervisor. Please note that these tests recorded zero packet loss.
Figure 7. Average delay (in microseconds) for two networks with virtualization (the smaller, the better).
B. Tests of 256-byte packets
It makes sense to take a closer look at the test results with a specific package profile. For example, tests with 256-byte layouts more accurately reproduce VoIP frames generated by the RTP protocol with G.711 encoding 5 . In fig. Figure 8 shows the minimum, average, and maximum one-way traffic delays for single and double VNF using 256-byte packets.
Figure 8. Detailed delay results (in microseconds) for 256-byte packets.
Figure 9. Detailed jitter results (in microseconds) for 256-byte packets.
In fig. 9 shows the corresponding average and maximum jitter values of one-way traffic. Maximum delay and jitter values are important for evaluating the worst performance characteristics of both test systems. In a high-performance system, the maximum delays were reduced 6 times for a single VNF and 7.4 times for a dual VNF. The maximum jitter was reduced, respectively, 24 times and 8.5 times. Please note that these tests recorded zero packet loss.
It is important not only to evaluate performance over short intervals, but also to study possible performance fluctuations over a long time. In fig. 10 shows the results of tests of maximum delays in tests lasting 5 minutes compared with tests lasting 16 hours for 256-byte packets and a single VNF. In general, the results indicate approximately the same increase in performance in an optimized system compared to the baseline system: maximum delays decreased 5 times for the 16-hour test and 6 times for the 5-minute test. It is important to note that the maximum delay values are significantly higher in the 16-hour tests. This can be explained by very rare system interruption events (i.e. maintenance tasks) that affect a very small number of test packets. Despite this, the maximum delay value for one-way traffic in 16-hour tests with 256-byte packets was only 2 ms. This is quite a suitable result, the threshold for delaying one-way voice traffic is 150 ms according to ITU-T G.114 6 . In other words, the increase in delays due to the addition of vCPT is in the worst case only 1.3% of the total allowable delays. Even in the base level system, the maximum delays of one-way traffic were 9.95 ms, which is only 6.6% of the total allowable value.
Figure 10. The results of long tests of delays in milliseconds (comparison of 16-hour and 5-minute tests).
V. Conclusion and conclusions
This article describes the fine-tuning of the KVM hypervisor-based virtual platform infrastructure CPE. In particular, the use of some components of the Intel ONP architecture, such as DPDK, can contribute to a significant increase in performance compared to the basic setting (without optimization). In tests with a single VNF, delays in one-way traffic decreased by 38–74%, and in tests with a dual VNF, delays decreased by 34–66%. In tests close to VoIP traffic, where 256-byte packets were used, the maximum delays were reduced by 6 times (for a single VNF) and 7.4 times (for a dual VNF), and the maximum jitter, respectively, by 24 times and 8 ,5 times.
Based on the results of the experiments, it can be concluded that tuning the performance of the NFV infrastructure for delay-sensitive applications, such as VoIP, will provide more specific indicators of overall performance in terms of latency and jitter compared to the basic configuration (without optimization). The decision to apply optimization by the network operator will largely depend on the required set of VNF functions supported by the vCPE infrastructure, as well as on the extent to which performance metrics specified in the service level agreement (for example, delays and jitter levels) are associated with on these vnf functions. In practice, the actual service level agreements used by network operators will contain performance targets within the operator’s own backbone and transit network and will vary by region. The times of two-way transmission of IP packets in 30–40 ms for Europe, 40–50 ms for North America and up to 90 ms for transatlantic channels are typical examples and standards of average delays.
If network operators decide to use NFV optimization using components such as DPDK instead of out-of-the-box solutions with factory settings, they should evaluate the potential impact of optimization on high-level management solutions: a clearer understanding of the parameters and settings of the underlying infrastructure will be required to ensure that VNF functions are prepared and managed according to the specified performance requirements. The experiments described in this article can be considered as a basis for a more detailed understanding of how to optimize performance, their applicability to existing networks and to promising 5G infrastructures.
Vi. Challenges for the future
Possible topics for further study include the following:
- Study of the “optimization levels” and the impact of each of them on the overall optimization: the choice of equipment (in particular, the effect of the Intel Xeon E5-2680 and Intel Xeon E5-2697 v3 processors on differences in delay times), BIOS settings (for example, you can enable P- state to enable Intel SpeedStep technology to increase power efficiency; real-time kernel configurations (for example, no hertz kernel, polling read, copy, and update operations), hypervisor settings, and VNF settings — all determine the characteristics of the architecture. Therefore, you should get a clearer picture of possible optimization measures and their impact on each level.
- Consideration should be given to conducting similar performance assessment tests for a wider set of different types of VNF, including those specialized for VoIP.
- You can improve test analytics to estimate the distribution of packet delay and jitter values depending on the profiles and frequency.
- Further analysis of NFV optimization in terms of high-level management: if the management module “knows” about the basic resources and the ability to use certain NFV infrastructure settings using features such as DPDK, the management solution will become more complex, but it will be possible to customize the delay-sensitive distribution VNF on the most appropriate NFV infrastructure.
It is obvious that in this area there are still many interesting problems and problems to be considered.
Reference materials
- J. Stradling. “Global WAN Update: Leading Players and Major Trends,” report with recommendations from the current analysis, September 2015
- “Network Functionality Virtualization Performance and Best Portability Techniques”, ETSI ISG GS NFV-PER001 specification, V1.1.1. June 2014
- "Examples of the use of network functions virtualization", specification ETSI ISG GS NFV001, V1.1.1. October 2013
- Intel Open Network Platform Server (version 1.5), Release Notes, November 2015
- NFV Performance Measurement for vCPE, Network Testing Report, Overture Networks, May 2015
- “ITU-T G114 specification - one-way transfer time”, May 2003
Source: https://habr.com/ru/post/317372/
All Articles