The study of connectivity in the brain based on electrophysiological data. Lecture in Yandex
Since the ideology of neural networks in IT was built with an eye on the real prototype, it is also sometimes useful to remember about it. We offer to see or read a lecture by Ilya Zakharov, a graduate of the Department of Psychophysiology, Faculty of Psychology, Moscow State University. Ilya explains how to analyze the networks in the brain, what data is needed for this, what pitfalls can arise in the analysis, and most importantly, what new research has allowed us to learn.
Under the cut - the decoding and most of the slides.
What I’m going to talk about is what I’m most interested in from a substantive rather than a technical point of view and not in terms of details that relate to data analysis. I will talk more about what needs to be considered meaningfully when you turn to electroencephalographic (EEG) data, but I will try to answer more technical questions as much as possible.
')
I will strive to talk about such a large and very productive, promising direction in the study of the brain, as the analysis of neural networks in it. Processes are analyzed in terms of what is happening in the brain and how what is happening is related to the characteristics of our mental processes.
Some introductory words so that we have a common context. The principal complexity of the brain lies in the connections within it. You know that there are a huge number of nerve cells inside the brain - approximately 86 billion offhand. Each is in contact with about 1 thousand other nerve cells. It turns out a significant network of links. An attempt to understand what is happening in this network, at least at the global level, is a trend of the last 15 years, something that researchers are actively engaged in.
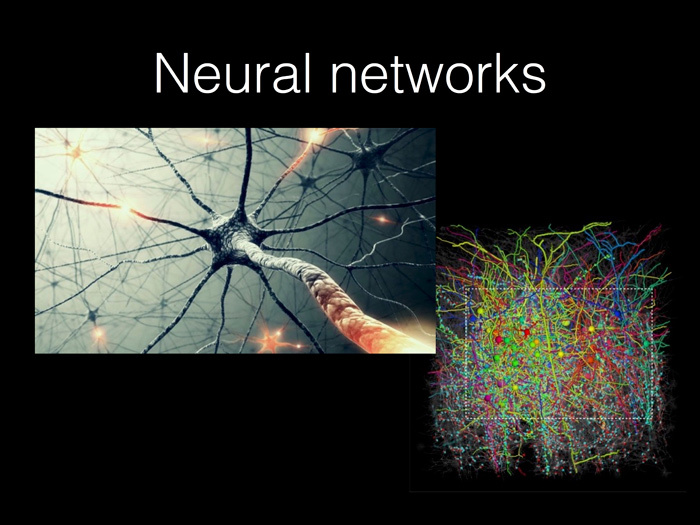
The pictures on the right - you often see them somewhere on the Internet - not very accurate. If the neurons were located so sparse as in the pictures on the right, our brain would swell to at least the size of an elephant, if not more. Everything is packed very tightly, because putting some 86 connections in the brain is a huge task.
What progress is there now in people who are trying to study the brain at such a holistic level, trying to understand what, how and with what processes is connected? For example, there is an active development with emerging tools. There are, finally, neurobiological theories of intelligence - their essence is that the smarter of you and I are the people whose nervous connections work more efficiently, through whose connections information flows better.
Or there are some differences in the types of connections within the brain between people with different types of diseases. For example, due to the differences in how networks are activated in the brain, Alzheimer's disease can be distinguished from dementia with Levi's bodies.
It is curious that an article recently appeared that showed that the pattern of work of the brain in terms of how the network is organized is, in a sense, as unique a thing as fingerprints. And you can potentially identify a person not only with the help of fingerprints, but also - with an accuracy of more than 99% - with the help of records of his brain.
People with different moral qualities differ from each other by the way their networks work in their brains. People react differently to conflicts.
Analysis of some network characteristics of the brain becomes an incredibly common area for researchers, which makes it easy to learn how to classify people. Perhaps the classification has never gone better than now. From the networks in the brain you can really pull a lot of parameters. This is also called connectivity in the brain - like tracing from English connectivity. Connectivity in the brain can be studied at very different levels.

At first connections arise in nerve cells. Nerve cells generate action potentials. The action potential is the electrical charge that occurs in the nerve cell and due to which the neurotransmitter is released from it. It enters another cell, a discharge is generated in it, and so on. Basically everything is connected by an electrochemical circuit. Below you see how these single potentials and action potentials arise. By registering the activity of a sufficiently large number of nerve cells and tracking when action potentials arise in the cells, it can be predicted when they will arise in other cells. All this is done statistically, the upper points in the left figure are the activity of having an action potential in one of the neurons of some of the brain regions. From such single neurons, more synchronized activity emerges. Just it unites the work described.
This is not like a clock in a computer, but in a sense it is a question of synchronized activity, which precisely exists in the brain and helps it process information.
Processing at the level of individual nerve cells is an incredibly interesting thing, but I don’t understand it at all. This is a rather large separate world, I will not talk about it.
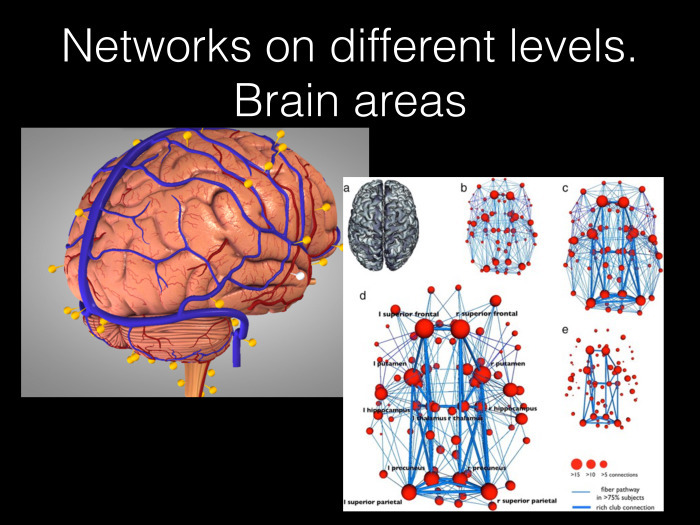
Another existing level. Surely you have seen such pictures, or this is the penultimate album of the Muse group, where different strings stretch to each other from different areas of the brain. Before you try to first assess the connections in the brain not at the level of nerve cells and even not only at the level of large anatomy, large brain areas, but also at the level of which fiber bundles go to what places and how information is transmitted through these bundles in local areas .
Researchers are doing all of the above with an MRI and have been doing it for quite some time. There is already some curious information about how the brain works. For example, we know that there are very connective hubs in the brain. This is called rich club networking. There are some nodes, large red dots, through which all information passes.
People with different pathologies and the like are most often characterized by the distribution of these nodes or a set of some changes. I will speak, again, about the other, but before you is another one of the levels of how this can be studied.
Another area seems extremely interesting to me. It has the advantages of the approach associated with the registration of individual neurons or large groups of neurons, as well as the advantages of a large approach when we look at the whole brain at once. But at the same time it is devoid of the minuses of these approaches.
What are the disadvantages of the first case, when we work only with neurons? The main disadvantage is that we cannot look at neurons all over the brain. We can not open the skull of a person and put electrodes on all neurons. Here we are in our studies are very limited to the area that we have already taken to study.
At the same time, this approach allows us to look at very fast and detailed processes related to the processing of information in the brain at a very subtle level. The minus of the second approach, when we look at the anatomical networks in the brain, is that the features of the method allow us to look only at changes occurring on a scale of 2-3 seconds, and not at rapid changes. 2-3 seconds is an awful lot for the brain, considering that the frequency of the action potential can be hundreds or even thousands of hertz.
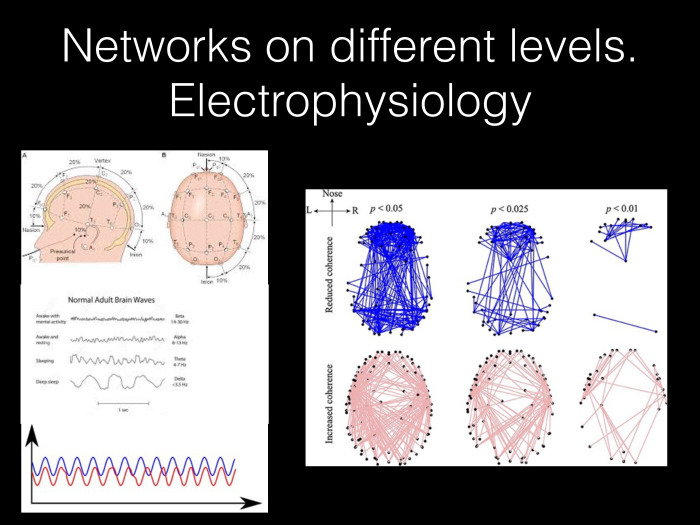
I will tell you how the nets in the brain are studied at the electrophysiological level. It is about something average between the study of individual neurons. The speed of the processes we can watch is also very high. Depending on how dreary you approach the experiment, it ranges from 0.001 Hz to about 100 Hz. These are really fast processes in the brain. And at the same time this activity is connected with the whole brain as a whole.
How is everything arranged? First of all, the methods of electroencephalogram (EEG) and magnetoencephalogram work - everything described above is also applicable to it. Surely in the clinic someone did an EEG. Some amount of electrodes are placed on your head. Now in neuroscience research they put 64 or 128 electrodes, rather coarsely covering your head with dots, separate leads, from which some total electrical activity is recorded. We do not know in detail where it comes from. We have models, but we cannot recreate the birth of this activity at the level of nerve cells. However, we know for sure that it is associated with some functional processes in the brain.
From each point we register some oscillatory activity. You have probably heard about brain rhythms - they are just the components of this activity. Rhythms are simply individual frequency ranges of a common oscillatory process. Based on the frequency characteristics, the alpha, beta, theta rhythm is distinguished.
We are talking about the analysis of networks in the brain, and we need to understand whether the oscillatory activity is connected even between two points on the head. To understand whether any areas are connected in the brain, we take a certain number of electrodes that simultaneously record activity in the brain, and try to understand how much the activity in different leads is interconnected in general. As a result, we are trying to build something like a network on the basis of information about electrode pairs. We need the same network that we build with an MRI.

The fact that the electrodes will correlate with each other is related to the transmission of information. Why do we think so? It seems logical, but when it comes to the brain, it’s better to check all these little things. Theoretical models, not confirmed by any experiments, are often not accurate enough. This is a good training for a mathematician - but it does not always have a physiological meaning. A little later, I will say what subtleties can take place in terms of physiology or technical features of receiving a signal.
In this case, we know from some more detailed cellular experiments: if we have two parts in the brain and an anatomical connection between them, then information flows between them and, in fact, the signals that we will record at neighboring points will be very similar.
If we cut the links between these two areas — we go from top to bottom — the vertical lines mean that we cut the connections — they will deteriorate first. And if we move the fibers away from each other at all, the connections will disappear. We lost rhythmic oscillatory activity in the brain. And only when we restore everything, even if not entirely, and allow at least some information to flow between the cells, then synchronized activity will be restored.
We reasonably believe that synchronization between two points is indeed an indicator of the connection between the two regions in the brain, an indicator of how actively information transfer takes place between them.
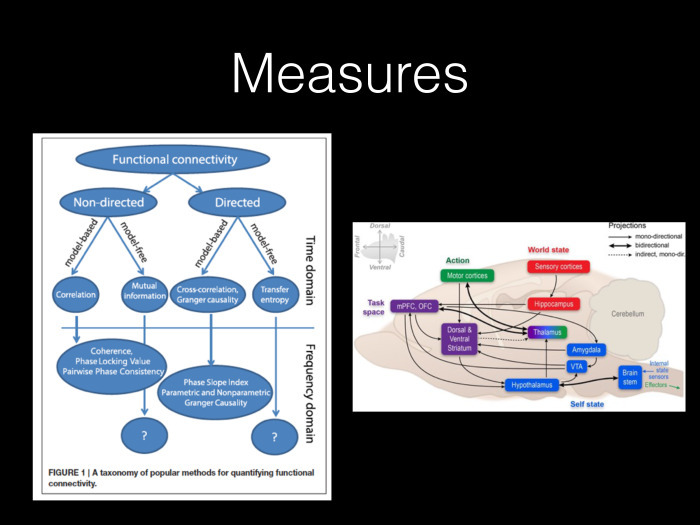
It should be borne in mind that even at this level certain physiological details arise. I will talk about some types of measurements, but I’ll warn you right away that they are basically divided into two large classes. The first class is non-directed-measurements that make no assumptions about the directionality of the connections between two points. In this case, we did not consider at all where the information flows from and where. There are such connections in the brain, about which we know that they exist both in one and in the other direction - there is simply some permanent chain of information transfer, that's all. For this type of connections, we can use methods that are in no way dependent on the direction of the connections.
At the same time, we know that in general - and this is quite logical - the brain is arranged hierarchically. So there is some information flow. Take, at a minimum, the vision: there is information from the eye through the optic nerve to the primary visual cortex, from there to the secondary visual cortex, etc. Generally speaking, in general, to say that the connections in the brain just flow in different directions - not quite right. Therefore, the following is extremely important: there must be methods that allow us to evaluate the direction of relationships.
The picture shows that there are examples where connections are located in one and in different directions. Here is a mouse brain and some basic areas of information processing. In this sense, we have all the areas that the mouse has in the brain, and the connection between them is transmitted in much the same way.
Estimated mainly two characteristics of the electroencephalographic signal. First of all, we estimate how much a common oscillatory process exists. And here, given that we are talking about the oscillatory process, it is extremely important to assess how much the phases of the signal coincide in it.
The simple coincidence of the phases for us is an extremely important indicator. In this case, you can evaluate the phase ...
If someone is interested in details, wants to see more - at the end there will be a list of references. There is a very intelligible review - very intelligible for a person, even without some prior experience.
We may have a number of variants of what is happening with the phases in the brain. It is clear that the phases between the signals may coincide and that then we will have one pattern. Relationships may have some kind of time delay - then we will have another pattern. And finally, the connection may be inverse to each other. Then as a result we will receive that there is no dependence. It is clear that this does not happen. Zero never happens, as well as units never happens, but nevertheless.
Baseline phase synchronization is estimated by decomposing the signal into complex numbers and highlighting the real and imaginary parts. First of all, it is estimated just the imaginary part. I understand this quite badly, this is just far from what I am doing. So here I rather address you to the links.
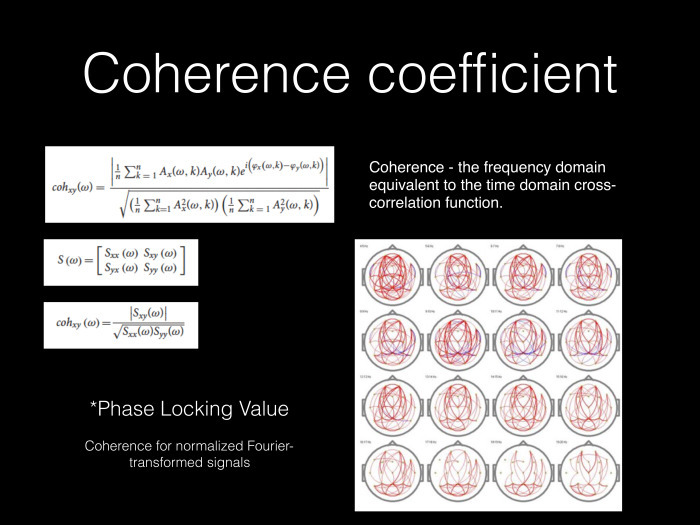
Another important thing you can do is to evaluate not so much the phase characteristics of the signal, as the amplitude or frequency characteristics regardless of the phase.
Here, first of all, there is a method for analyzing coherence. In fact, it is simply a matter of calculating the correlations between a pair of electrodes with some small correction. Well, we still need to take into account quite serious phase changes in different frequency ranges, due to the fact that our wavelength is different. Given these changes, some complications of the phase locking value procedure are formed, when we still normalize the frequency spectra to the wavelength.
Here, in the case of estimating phase synchronization, and in the case of coherence estimation, we get signals that are not really sensitive to the direction of information transfer. We just appreciate that the signals are interconnected.
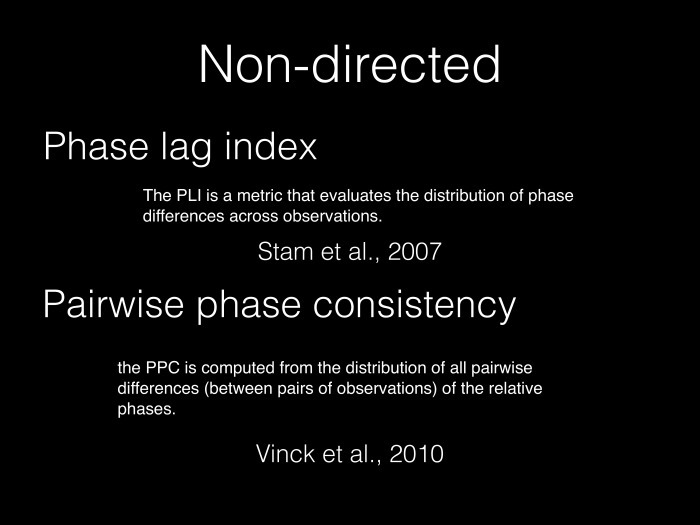
It is clear that these methods were developed back in the 60-70s, and that now there are some slightly more complicated characteristics. For example, if there is a large amount of signal, we can not just take the phase, but look at the distribution of the phases of one and the other signal and evaluate the similarity between them. This is an important comparison that helps us make a more accurate assessment, but it still does not solve the problem of the direction of relations.
The other big type is methods based on the initial assumptions that a signal flows from one side to the other. First of all, this is the granger causality method. These methods were developed for economics, but they are actively used in neuroscience. Based on the activity in one place, we are trying to predict what will happen in the other electrode, to find out how great the predictive power is to understand this. And you can make some time shift, see how much is happening in one place leads to what is happening somewhere else.
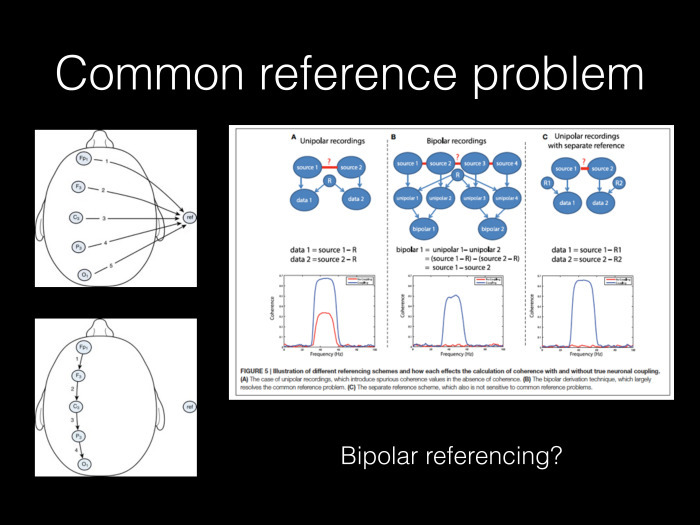
I wanted to tell more about what else needs to be considered when we analyze things of this kind. When we talk about the connection between points, you need to take into account that this connection has some technical characteristics and some features of how information from points comes to us. For example, it is extremely important to remember that when we look at some kind of electrical activity, we are always talking about the potential difference. And if there is a potential difference, then one point is already there. At the same time there is another point on the head, which is called the reference point. Regarding it, we look at the difference of the signal. In this sense, taking some common point for all the signals in the brain, we realize that we artificially increase the similarity simply due to technical characteristics. We already have something in common, where there is really no zero activity, and we use this to obtain the potential difference. I described the first problem. It can be solved by analyzing in detail and constantly choosing different points for reference and activity counting.
Another problem is connected with this: when we see the connection between two points, we do not know that this may be the result of connecting both of them with a third point.

The first thing is that we look at the activity on the surface of the skull, although the source of activity in the brain is a kind of electric dipole, a propagating field, coming in different parts of the head. There are methods that allow us to obtain the activity of sources in the brain from the activity that we see on the scalp. And then you need to try to understand the connection not between the points on the head, but between the sources in the brain.
The above methods for counting activities, in which we correctly take into account that activities come from some common sources, take into account the technical characteristics of the signal, are quite understandable. Described what to think about. Taking into account theoretical things concerning where the signal should or should not flow, we arrive at a task that may be much closer to all of you. Or not to everyone, but, speaking of this in Yandex, I think that there are more specialists here in this particular issue.

In fact, we end up with a network, a graph of connections between a pair of points. Plus, we can quantify the strength of these relationships using the methods I have already described. This is an area that has not yet been actively investigated. , , . . .

.
, , . - , . Thank.
Under the cut - the decoding and most of the slides.
What I’m going to talk about is what I’m most interested in from a substantive rather than a technical point of view and not in terms of details that relate to data analysis. I will talk more about what needs to be considered meaningfully when you turn to electroencephalographic (EEG) data, but I will try to answer more technical questions as much as possible.
')
I will strive to talk about such a large and very productive, promising direction in the study of the brain, as the analysis of neural networks in it. Processes are analyzed in terms of what is happening in the brain and how what is happening is related to the characteristics of our mental processes.
Some introductory words so that we have a common context. The principal complexity of the brain lies in the connections within it. You know that there are a huge number of nerve cells inside the brain - approximately 86 billion offhand. Each is in contact with about 1 thousand other nerve cells. It turns out a significant network of links. An attempt to understand what is happening in this network, at least at the global level, is a trend of the last 15 years, something that researchers are actively engaged in.
The pictures on the right - you often see them somewhere on the Internet - not very accurate. If the neurons were located so sparse as in the pictures on the right, our brain would swell to at least the size of an elephant, if not more. Everything is packed very tightly, because putting some 86 connections in the brain is a huge task.
What progress is there now in people who are trying to study the brain at such a holistic level, trying to understand what, how and with what processes is connected? For example, there is an active development with emerging tools. There are, finally, neurobiological theories of intelligence - their essence is that the smarter of you and I are the people whose nervous connections work more efficiently, through whose connections information flows better.
Or there are some differences in the types of connections within the brain between people with different types of diseases. For example, due to the differences in how networks are activated in the brain, Alzheimer's disease can be distinguished from dementia with Levi's bodies.
It is curious that an article recently appeared that showed that the pattern of work of the brain in terms of how the network is organized is, in a sense, as unique a thing as fingerprints. And you can potentially identify a person not only with the help of fingerprints, but also - with an accuracy of more than 99% - with the help of records of his brain.
People with different moral qualities differ from each other by the way their networks work in their brains. People react differently to conflicts.
Analysis of some network characteristics of the brain becomes an incredibly common area for researchers, which makes it easy to learn how to classify people. Perhaps the classification has never gone better than now. From the networks in the brain you can really pull a lot of parameters. This is also called connectivity in the brain - like tracing from English connectivity. Connectivity in the brain can be studied at very different levels.
At first connections arise in nerve cells. Nerve cells generate action potentials. The action potential is the electrical charge that occurs in the nerve cell and due to which the neurotransmitter is released from it. It enters another cell, a discharge is generated in it, and so on. Basically everything is connected by an electrochemical circuit. Below you see how these single potentials and action potentials arise. By registering the activity of a sufficiently large number of nerve cells and tracking when action potentials arise in the cells, it can be predicted when they will arise in other cells. All this is done statistically, the upper points in the left figure are the activity of having an action potential in one of the neurons of some of the brain regions. From such single neurons, more synchronized activity emerges. Just it unites the work described.
This is not like a clock in a computer, but in a sense it is a question of synchronized activity, which precisely exists in the brain and helps it process information.
Processing at the level of individual nerve cells is an incredibly interesting thing, but I don’t understand it at all. This is a rather large separate world, I will not talk about it.
Another existing level. Surely you have seen such pictures, or this is the penultimate album of the Muse group, where different strings stretch to each other from different areas of the brain. Before you try to first assess the connections in the brain not at the level of nerve cells and even not only at the level of large anatomy, large brain areas, but also at the level of which fiber bundles go to what places and how information is transmitted through these bundles in local areas .
Researchers are doing all of the above with an MRI and have been doing it for quite some time. There is already some curious information about how the brain works. For example, we know that there are very connective hubs in the brain. This is called rich club networking. There are some nodes, large red dots, through which all information passes.
People with different pathologies and the like are most often characterized by the distribution of these nodes or a set of some changes. I will speak, again, about the other, but before you is another one of the levels of how this can be studied.
Another area seems extremely interesting to me. It has the advantages of the approach associated with the registration of individual neurons or large groups of neurons, as well as the advantages of a large approach when we look at the whole brain at once. But at the same time it is devoid of the minuses of these approaches.
What are the disadvantages of the first case, when we work only with neurons? The main disadvantage is that we cannot look at neurons all over the brain. We can not open the skull of a person and put electrodes on all neurons. Here we are in our studies are very limited to the area that we have already taken to study.
At the same time, this approach allows us to look at very fast and detailed processes related to the processing of information in the brain at a very subtle level. The minus of the second approach, when we look at the anatomical networks in the brain, is that the features of the method allow us to look only at changes occurring on a scale of 2-3 seconds, and not at rapid changes. 2-3 seconds is an awful lot for the brain, considering that the frequency of the action potential can be hundreds or even thousands of hertz.
I will tell you how the nets in the brain are studied at the electrophysiological level. It is about something average between the study of individual neurons. The speed of the processes we can watch is also very high. Depending on how dreary you approach the experiment, it ranges from 0.001 Hz to about 100 Hz. These are really fast processes in the brain. And at the same time this activity is connected with the whole brain as a whole.
How is everything arranged? First of all, the methods of electroencephalogram (EEG) and magnetoencephalogram work - everything described above is also applicable to it. Surely in the clinic someone did an EEG. Some amount of electrodes are placed on your head. Now in neuroscience research they put 64 or 128 electrodes, rather coarsely covering your head with dots, separate leads, from which some total electrical activity is recorded. We do not know in detail where it comes from. We have models, but we cannot recreate the birth of this activity at the level of nerve cells. However, we know for sure that it is associated with some functional processes in the brain.
From each point we register some oscillatory activity. You have probably heard about brain rhythms - they are just the components of this activity. Rhythms are simply individual frequency ranges of a common oscillatory process. Based on the frequency characteristics, the alpha, beta, theta rhythm is distinguished.
We are talking about the analysis of networks in the brain, and we need to understand whether the oscillatory activity is connected even between two points on the head. To understand whether any areas are connected in the brain, we take a certain number of electrodes that simultaneously record activity in the brain, and try to understand how much the activity in different leads is interconnected in general. As a result, we are trying to build something like a network on the basis of information about electrode pairs. We need the same network that we build with an MRI.
The fact that the electrodes will correlate with each other is related to the transmission of information. Why do we think so? It seems logical, but when it comes to the brain, it’s better to check all these little things. Theoretical models, not confirmed by any experiments, are often not accurate enough. This is a good training for a mathematician - but it does not always have a physiological meaning. A little later, I will say what subtleties can take place in terms of physiology or technical features of receiving a signal.
In this case, we know from some more detailed cellular experiments: if we have two parts in the brain and an anatomical connection between them, then information flows between them and, in fact, the signals that we will record at neighboring points will be very similar.
If we cut the links between these two areas — we go from top to bottom — the vertical lines mean that we cut the connections — they will deteriorate first. And if we move the fibers away from each other at all, the connections will disappear. We lost rhythmic oscillatory activity in the brain. And only when we restore everything, even if not entirely, and allow at least some information to flow between the cells, then synchronized activity will be restored.
We reasonably believe that synchronization between two points is indeed an indicator of the connection between the two regions in the brain, an indicator of how actively information transfer takes place between them.
It should be borne in mind that even at this level certain physiological details arise. I will talk about some types of measurements, but I’ll warn you right away that they are basically divided into two large classes. The first class is non-directed-measurements that make no assumptions about the directionality of the connections between two points. In this case, we did not consider at all where the information flows from and where. There are such connections in the brain, about which we know that they exist both in one and in the other direction - there is simply some permanent chain of information transfer, that's all. For this type of connections, we can use methods that are in no way dependent on the direction of the connections.
At the same time, we know that in general - and this is quite logical - the brain is arranged hierarchically. So there is some information flow. Take, at a minimum, the vision: there is information from the eye through the optic nerve to the primary visual cortex, from there to the secondary visual cortex, etc. Generally speaking, in general, to say that the connections in the brain just flow in different directions - not quite right. Therefore, the following is extremely important: there must be methods that allow us to evaluate the direction of relationships.
The picture shows that there are examples where connections are located in one and in different directions. Here is a mouse brain and some basic areas of information processing. In this sense, we have all the areas that the mouse has in the brain, and the connection between them is transmitted in much the same way.
Estimated mainly two characteristics of the electroencephalographic signal. First of all, we estimate how much a common oscillatory process exists. And here, given that we are talking about the oscillatory process, it is extremely important to assess how much the phases of the signal coincide in it.
The simple coincidence of the phases for us is an extremely important indicator. In this case, you can evaluate the phase ...
If someone is interested in details, wants to see more - at the end there will be a list of references. There is a very intelligible review - very intelligible for a person, even without some prior experience.
We may have a number of variants of what is happening with the phases in the brain. It is clear that the phases between the signals may coincide and that then we will have one pattern. Relationships may have some kind of time delay - then we will have another pattern. And finally, the connection may be inverse to each other. Then as a result we will receive that there is no dependence. It is clear that this does not happen. Zero never happens, as well as units never happens, but nevertheless.
Baseline phase synchronization is estimated by decomposing the signal into complex numbers and highlighting the real and imaginary parts. First of all, it is estimated just the imaginary part. I understand this quite badly, this is just far from what I am doing. So here I rather address you to the links.
Another important thing you can do is to evaluate not so much the phase characteristics of the signal, as the amplitude or frequency characteristics regardless of the phase.
Here, first of all, there is a method for analyzing coherence. In fact, it is simply a matter of calculating the correlations between a pair of electrodes with some small correction. Well, we still need to take into account quite serious phase changes in different frequency ranges, due to the fact that our wavelength is different. Given these changes, some complications of the phase locking value procedure are formed, when we still normalize the frequency spectra to the wavelength.
Here, in the case of estimating phase synchronization, and in the case of coherence estimation, we get signals that are not really sensitive to the direction of information transfer. We just appreciate that the signals are interconnected.
It is clear that these methods were developed back in the 60-70s, and that now there are some slightly more complicated characteristics. For example, if there is a large amount of signal, we can not just take the phase, but look at the distribution of the phases of one and the other signal and evaluate the similarity between them. This is an important comparison that helps us make a more accurate assessment, but it still does not solve the problem of the direction of relations.
The other big type is methods based on the initial assumptions that a signal flows from one side to the other. First of all, this is the granger causality method. These methods were developed for economics, but they are actively used in neuroscience. Based on the activity in one place, we are trying to predict what will happen in the other electrode, to find out how great the predictive power is to understand this. And you can make some time shift, see how much is happening in one place leads to what is happening somewhere else.
I wanted to tell more about what else needs to be considered when we analyze things of this kind. When we talk about the connection between points, you need to take into account that this connection has some technical characteristics and some features of how information from points comes to us. For example, it is extremely important to remember that when we look at some kind of electrical activity, we are always talking about the potential difference. And if there is a potential difference, then one point is already there. At the same time there is another point on the head, which is called the reference point. Regarding it, we look at the difference of the signal. In this sense, taking some common point for all the signals in the brain, we realize that we artificially increase the similarity simply due to technical characteristics. We already have something in common, where there is really no zero activity, and we use this to obtain the potential difference. I described the first problem. It can be solved by analyzing in detail and constantly choosing different points for reference and activity counting.
Another problem is connected with this: when we see the connection between two points, we do not know that this may be the result of connecting both of them with a third point.
The first thing is that we look at the activity on the surface of the skull, although the source of activity in the brain is a kind of electric dipole, a propagating field, coming in different parts of the head. There are methods that allow us to obtain the activity of sources in the brain from the activity that we see on the scalp. And then you need to try to understand the connection not between the points on the head, but between the sources in the brain.
The above methods for counting activities, in which we correctly take into account that activities come from some common sources, take into account the technical characteristics of the signal, are quite understandable. Described what to think about. Taking into account theoretical things concerning where the signal should or should not flow, we arrive at a task that may be much closer to all of you. Or not to everyone, but, speaking of this in Yandex, I think that there are more specialists here in this particular issue.
In fact, we end up with a network, a graph of connections between a pair of points. Plus, we can quantify the strength of these relationships using the methods I have already described. This is an area that has not yet been actively investigated. , , . . .
.
, , . - , . Thank.
Source: https://habr.com/ru/post/317320/
All Articles