Overview of the Instana application monitoring system
Today I will tell you what Instana is and how this monitoring system (CMS) differs from others.
 The system consists of Instana Backend (a server with a web interface and a storage of collected data) and an Instana Agent (an agent that is installed on target hosts for monitoring applications). Cassandra is used as a database for storing data by metrics. In addition to the On-premise installation, there is a cloud version. The review is dedicated to the experience of using the first option.
Technical details and links to documentation - under the spoiler.
')
Despite the fact that the system interface is very intuitive, I advise you to read the relevant documentation , there are some unobvious moments.
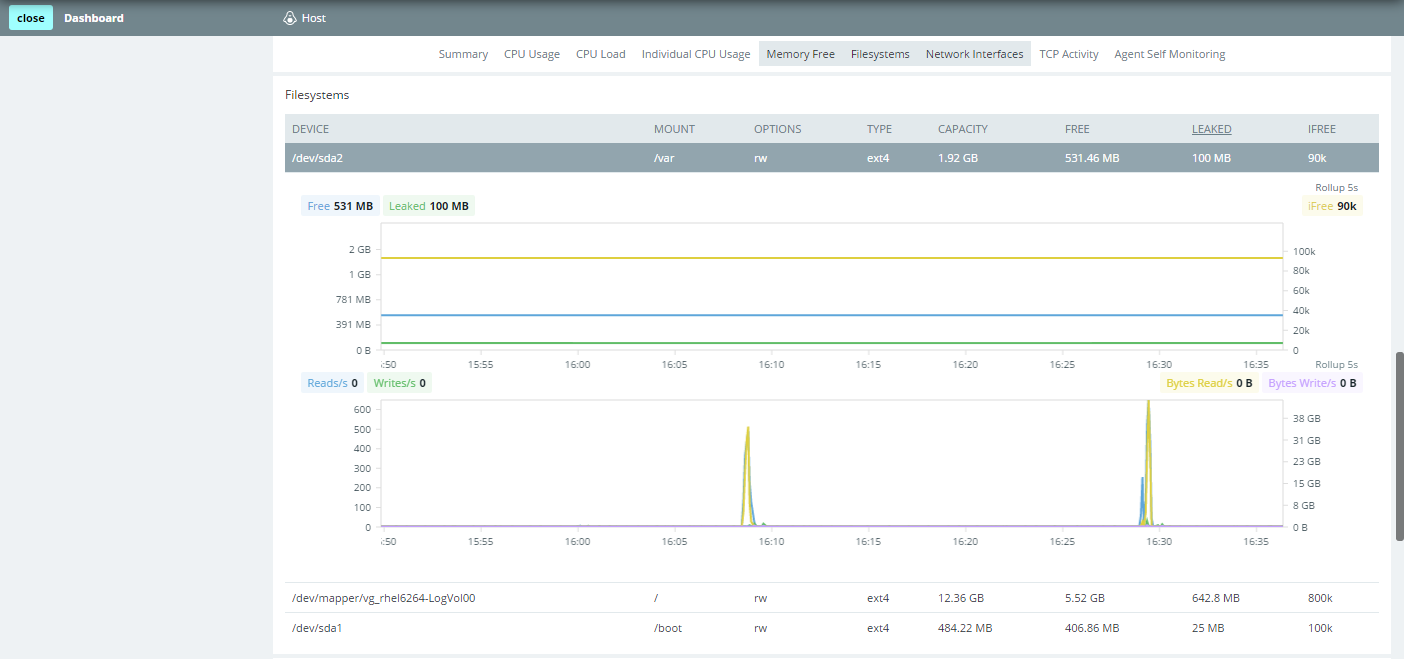
For example, to see the details of a parameter, you need to click on it (for me, the row of the table was not the obvious place for a click):
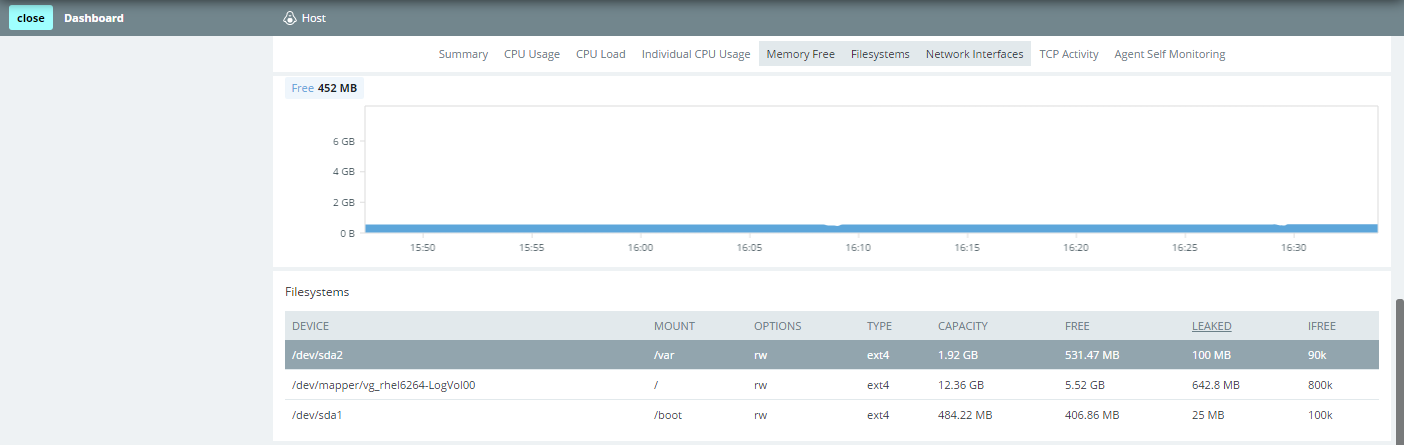
The corresponding schedule will open:
Infrastructure Map ( Infrastructure Map ):
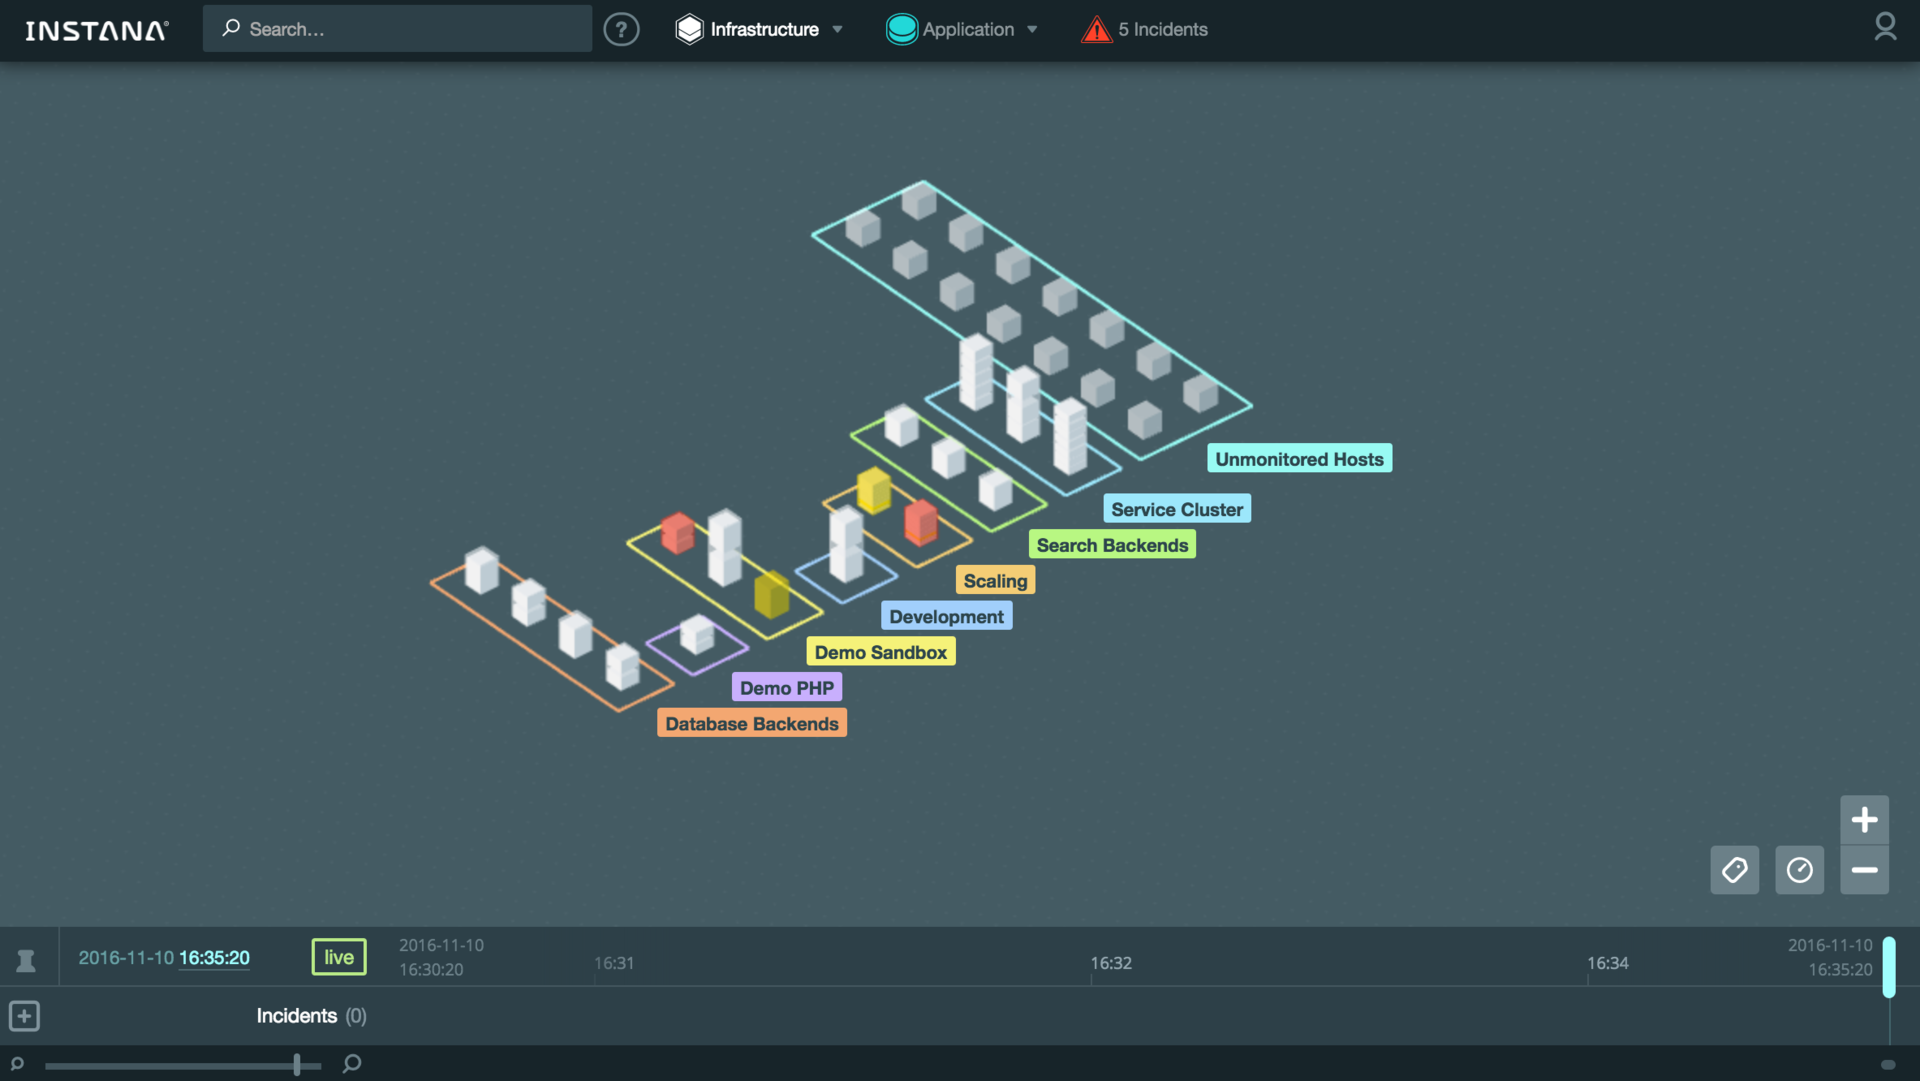
You can enable the display of system metric values (CPU, memory) directly on the map:
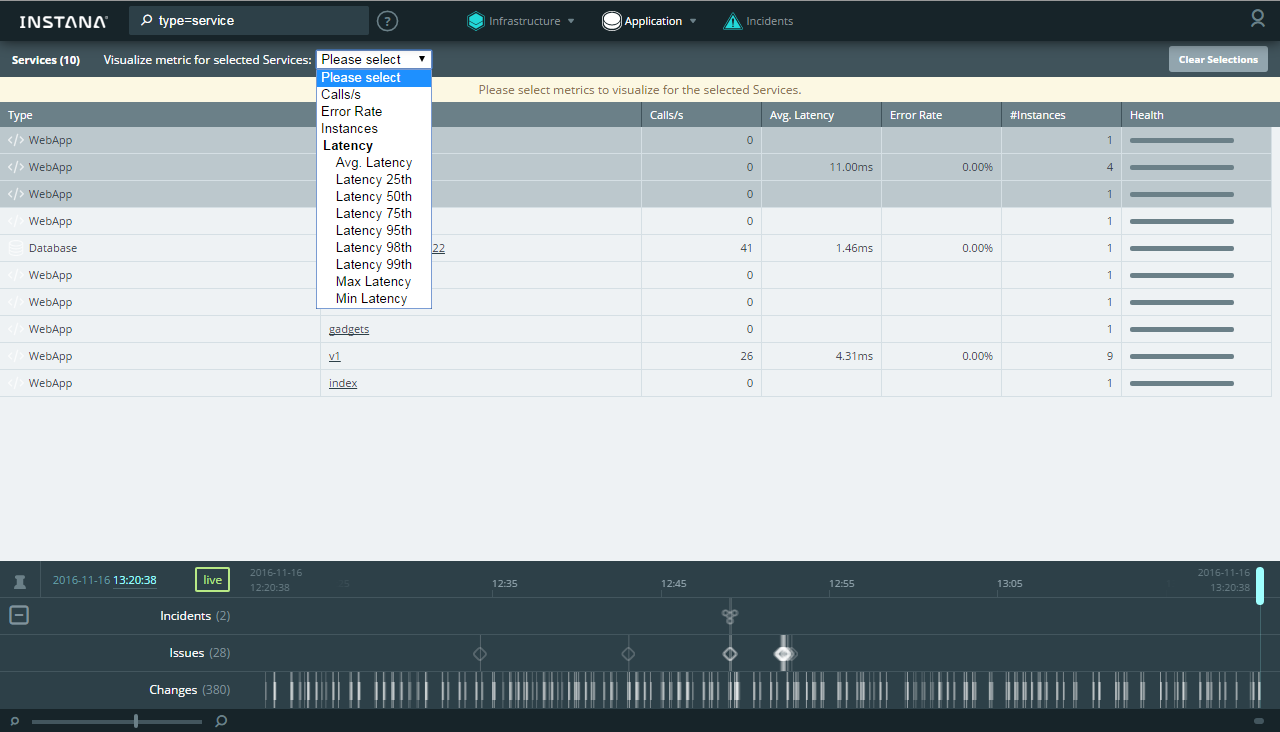
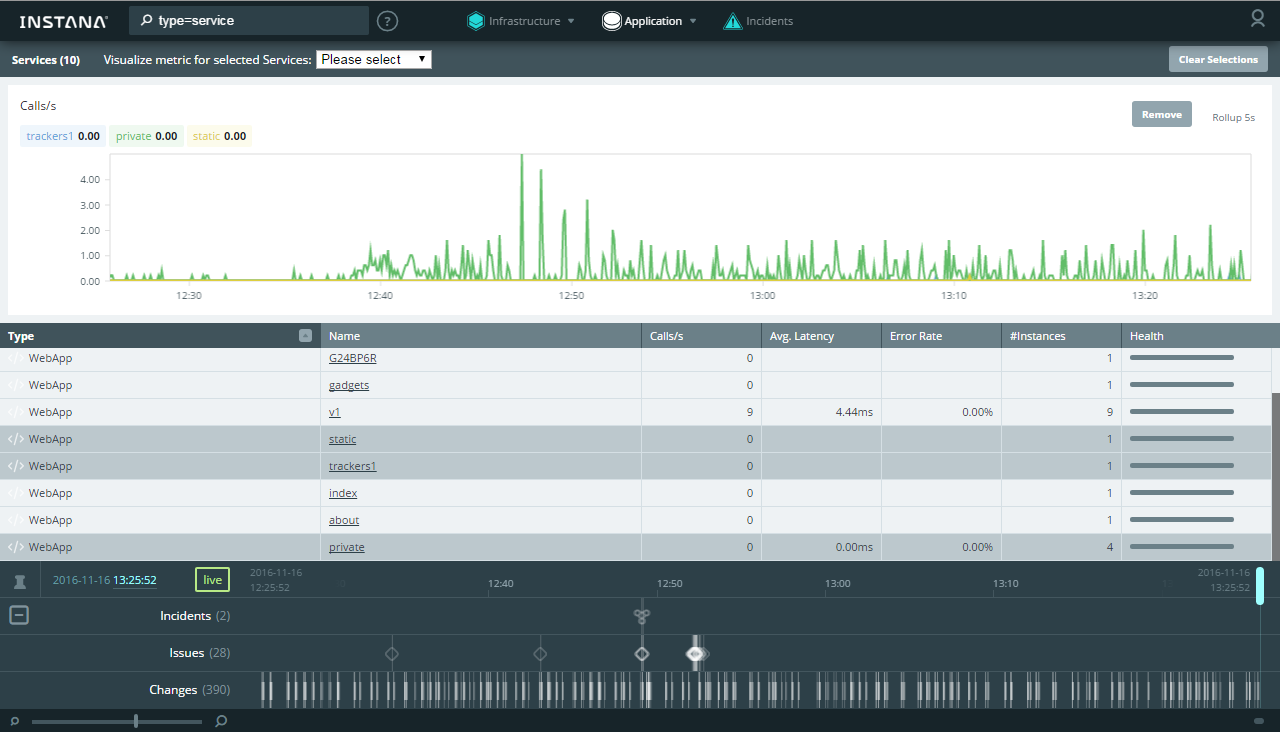
In the new version, a comparison table has been added. It allows you to immediately see the current value of the main system metrics for all hosts. In addition, you can quickly select the necessary hosts and analyze an arbitrary metric on the summary graph:
Application Map :

In the new version, a comparison table has been added for the application components, where you can also select the components and analyze them in the pivot chart:
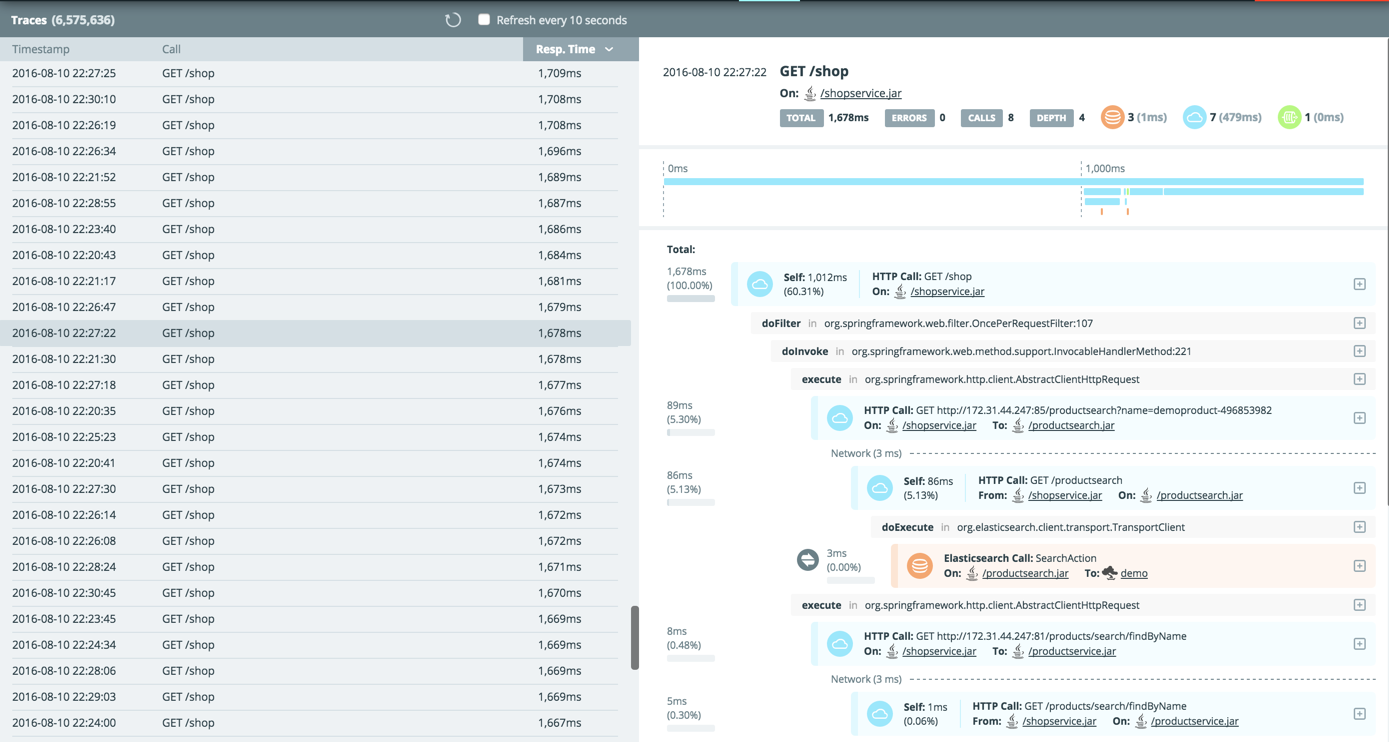
All transactions are available for analysis in the Trace view , where the table is sorted by any column (for example, you can quickly find the longest transaction):
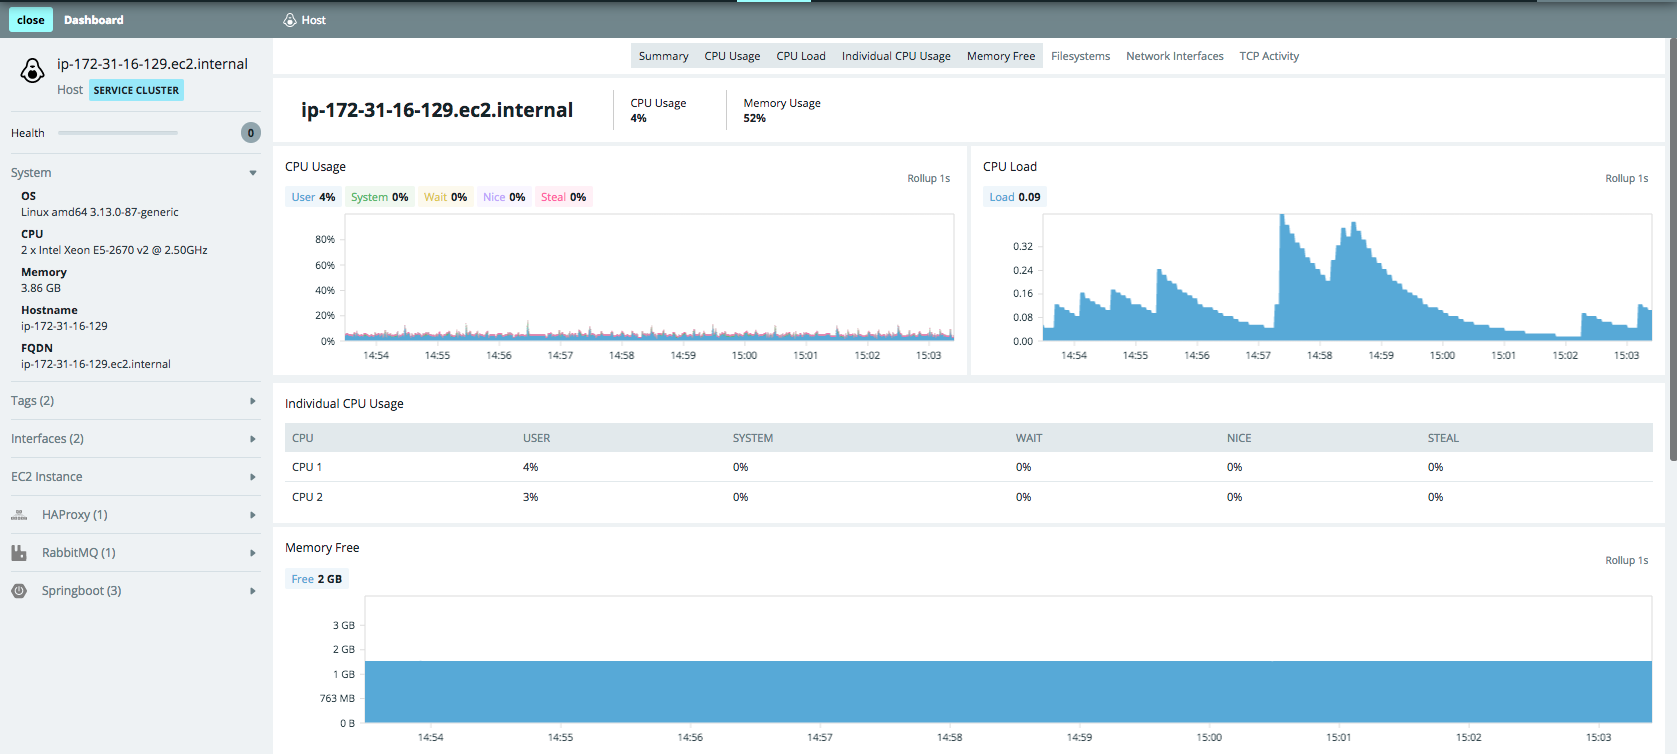
From any view, you can open a dashboard, in which you will find graphs and metric values by host and components on it:
There is a search by host names, components, tracing, tags, zones - masks (*) and unions (AND / OR) are supported:

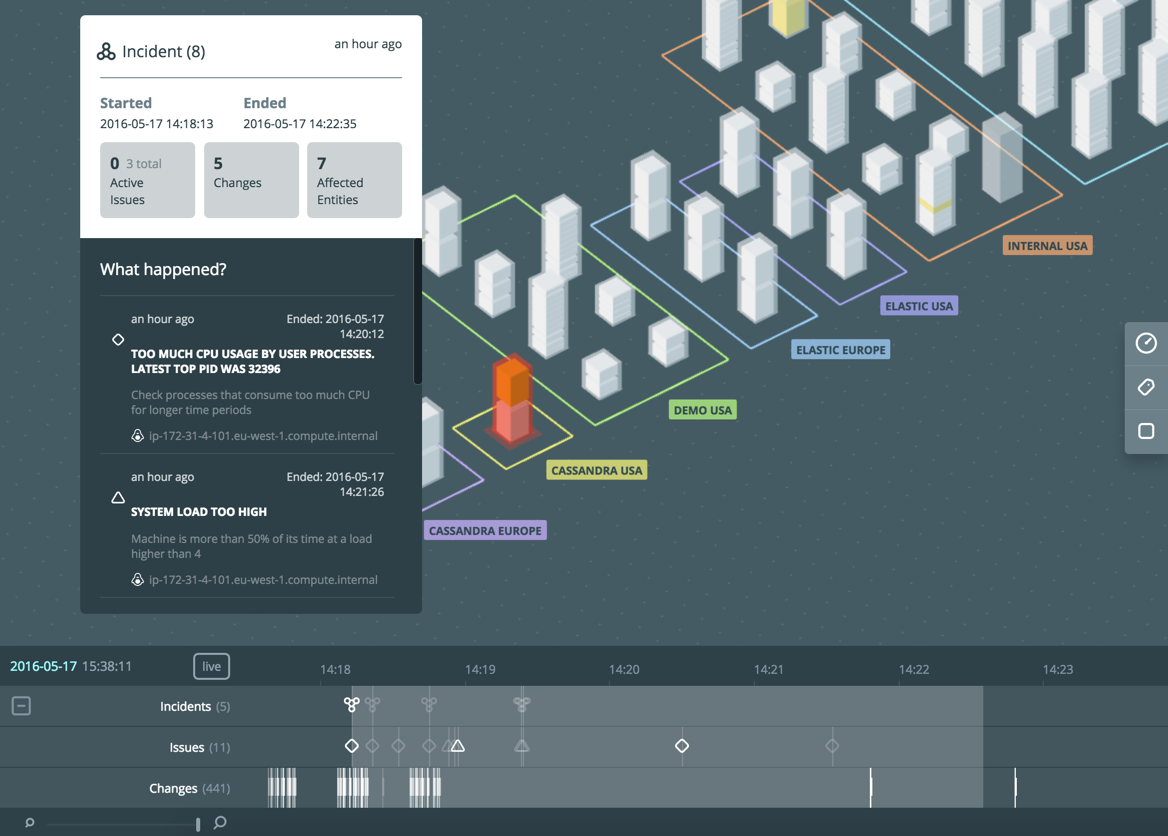
A distinctive feature that no other SM currently has is working with historical data in Timeshift mode. When scrolling the timeline (Timeline), we see not only all the events in the past tense, but also what the map (physical / logical) looked like in the past. For example, you can see that Tomcat stopped working on the server, how it affected the interaction of the application components, as the infrastructure map and the application components map used to look like. In the same way, you can watch transactions (tab Application → Trace ).
In the new version of the backend, all events are collected in a separate Incidents tab, where you can sort the table by columns and analyze the details:
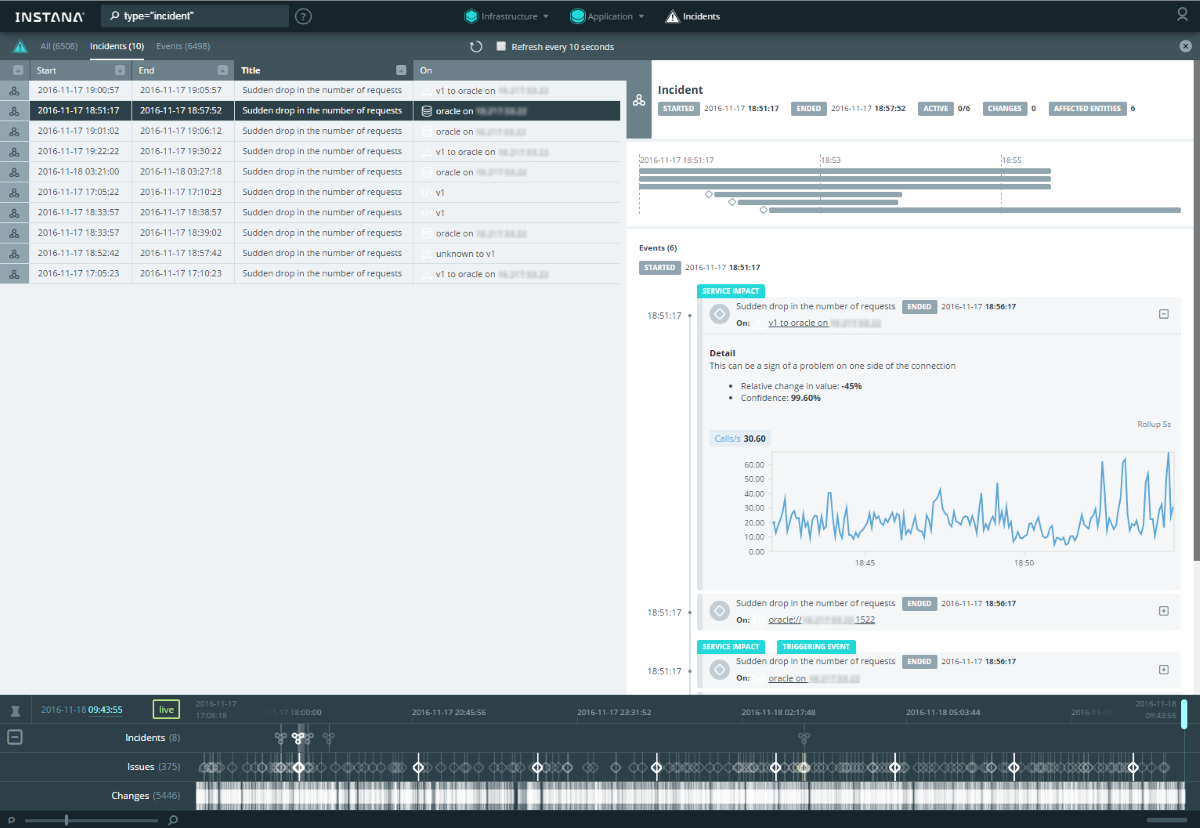
The links in the details, you can immediately go to the detailed dashboard of the corresponding component.
Unlike classical infrastructure monitoring (host availability, CPU utilization level, HTTP page accessibility, etc.), application monitoring imposes more serious requirements on the frequency and granularity of the collected data. The more often we get the value of a certain metric, the better, especially for transactional monitoring. This is due to the fact that problems with the operation of the application can be very short and the consequences are quite noticeable. To compare graphics with different granularity (1 minute vs 5 seconds):


It is immediately clear that insufficiently detailed data in some cases will not allow detecting a problem. This system allows you to collect data with a frequency of up to 1 second . To reduce the amount of historical data, they are aggregated with respect to prescription - the further, the lower the granularity: 1 second (live data is stored for 10 minutes) → 5 seconds (stored for 1 day) → 1 minute (stored for 31 day) → 5 minutes (stored for 3 months ) → 1 hour (stored for 1 year, but can be increased).
Automatic Discovering of components is very useful: if the Instana agent is installed on the host, all components and services known to it automatically appear in the CM. This is especially important when your application is built on microservices :

The list of supported technologies includes almost everything that is popular now. Naturally, you can look at the transactions and analyze the application at the level of the method call (in the documentation there are details of the trace mechanism ).
An important criterion when choosing a SM for us is Scala support, this is a rarity for SM applications. It may seem that for Java, Java support is sufficient — and deep monitoring of the application ( instrumentation ) is in your pocket. But in fact it turns out that this is not the case: without the support of Scala, the monitoring will show only a trace of one JVM call. Therefore, even the most famous players in the APM market today are lagging behind in this regard.
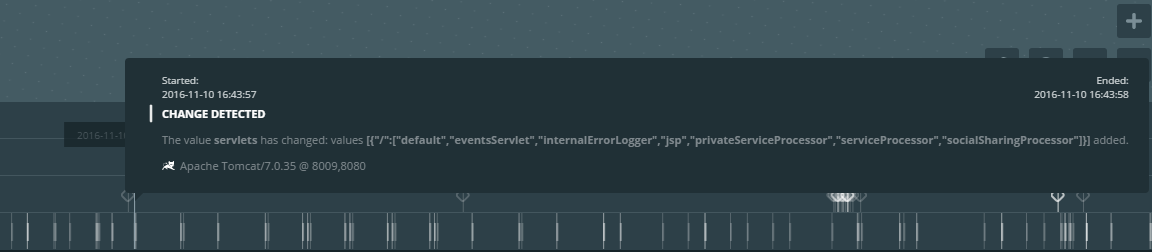
The system sees changes of components on the principle of delta :
In addition, the system is capable of online displaying the state of interaction between components (the frequency of moving points on the links indicates how fast the data is being transferred):
The following integration options are available for out-of-box notification:
The product is actively developing , but now it looks like a convenient tool for finding problems with the application both at the testing / debugging stage and for operational monitoring.
The article used materials:
Installation
Technical details and links to documentation - under the spoiler.
')
Installation details
Before starting the installation, you need to make sure that you have access to the Instana repositories , since most of the components download the necessary packages and artifacts at startup. This also applies to agent Instana. Its distribution contains only the agent core: during installation, the agent detects components on the target server and downloads the packages necessary to monitor these components. You can use your internal repository in proxy mode (for example, Sonartype Nexus ).
Select OSes - currently supported to install the backend server:
The requirements for OS versions are due to the fact that Instana software runs on Docker > = 1.10.
The software is paid, so you also need an activation key for Backend and Agent .
We use CentOS 7, the installation went well according to the instructions .
Add a repository entry (login / password assigned by vendor is used):
Then we start the package installation via yum:
After the installation is complete, do not rush to start, first you need to copy and fix the config for Instana Backend :
We needed to comment out the line in / etc / sudoers using the visudo command in order to launch as root using sudo:
Login to the Instana repository:
Add the launch of the backend to autoload:
Everything can now be run:
After that, the necessary packages from the repository will start loading, it will take time. At the end should appear joyful inscription:
The following operating systems are currently supported:
To run the agent you need to install JDK 8 (not JRE!). The JAVA_HOME environment variable must contain the correct path to the installed JDK.
Go to the Instana Backend web interface and download the distribution package for the necessary OS:

You can also download distributions directly from the vendor's website .
For example, on Linux, installing an agent consists in copying and unpacking the archive. Before launching, you need to correct the agent config and specify the data of your repository. Now you can run the agent:
After starting, you can check the status of the agent with the command:
If necessary, you can stop the agent with the command:
The current agent log is here:
In order for all the hosts on your map to be divided into zones (as in the picture below), searched by tags, you need to make changes to the agent's configuration on the host and restart the agent. All this is described in detail in the documentation . By the way, first you can install the agent on the Backend Instana server itself.
The agent can also be installed in a container .
Training
Before starting the installation, you need to make sure that you have access to the Instana repositories , since most of the components download the necessary packages and artifacts at startup. This also applies to agent Instana. Its distribution contains only the agent core: during installation, the agent detects components on the target server and downloads the packages necessary to monitor these components. You can use your internal repository in proxy mode (for example, Sonartype Nexus ).
Select OSes - currently supported to install the backend server:
- SLES:> = 12
- Ubuntu:> = 16.04
- Debian:> = 8
- RedHat Enterprise Linux> = 7.2
- CentOS> = 7
The requirements for OS versions are due to the fact that Instana software runs on Docker > = 1.10.
The software is paid, so you also need an activation key for Backend and Agent .
Install Backend
We use CentOS 7, the installation went well according to the instructions .
Add a repository entry (login / password assigned by vendor is used):
sudo tee /etc/yum.repos.d/instana.repo <<-EOF [instanarepo] name=Instana Repository baseurl=https://<user>:<password>@package-repository.instana.io/backend/rhel7 enabled=1 gpgcheck=1 gpgkey=https://<user>:<password>@package-repository.instana.io/instana.gpg EOF Then we start the package installation via yum:
yum install instana-backend After the installation is complete, do not rush to start, first you need to copy and fix the config for Instana Backend :
cd /etc/instana-backend cp instana.settings.template instana.settings We needed to comment out the line in / etc / sudoers using the visudo command in order to launch as root using sudo:
#Defaults requiretty Login to the Instana repository:
docker login -u ”$INSTANA_REPO_USER” -p “$INSTANA_REPO_PASSWORD” registry- public.instana.io Add the launch of the backend to autoload:
systemctl enable instana-backend.service Everything can now be run:
systemctl start instana-backend After that, the necessary packages from the repository will start loading, it will take time. At the end should appear joyful inscription:
All done :) Agent installation
The following operating systems are currently supported:
- Linux 32/64 bit
- Windows 32/64 bit
- Mac os 64 bit
To run the agent you need to install JDK 8 (not JRE!). The JAVA_HOME environment variable must contain the correct path to the installed JDK.
Go to the Instana Backend web interface and download the distribution package for the necessary OS:
You can also download distributions directly from the vendor's website .
For example, on Linux, installing an agent consists in copying and unpacking the archive. Before launching, you need to correct the agent config and specify the data of your repository. Now you can run the agent:
<instana-agent-install-dir>/instana-agent/bin/start After starting, you can check the status of the agent with the command:
<instana-agent-install-dir>/instana-agent/bin/status If necessary, you can stop the agent with the command:
<instana-agent-install-dir>/instana-agent/bin/stop The current agent log is here:
<instana-agent-install-dir>/instana-agent/data/log/agent.log In order for all the hosts on your map to be divided into zones (as in the picture below), searched by tags, you need to make changes to the agent's configuration on the host and restart the agent. All this is described in detail in the documentation . By the way, first you can install the agent on the Backend Instana server itself.
The agent can also be installed in a container .
Using
Despite the fact that the system interface is very intuitive, I advise you to read the relevant documentation , there are some unobvious moments.
For example, to see the details of a parameter, you need to click on it (for me, the row of the table was not the obvious place for a click):
The corresponding schedule will open:
Infrastructure Map ( Infrastructure Map ):
You can enable the display of system metric values (CPU, memory) directly on the map:
In the new version, a comparison table has been added. It allows you to immediately see the current value of the main system metrics for all hosts. In addition, you can quickly select the necessary hosts and analyze an arbitrary metric on the summary graph:
Application Map :
In the new version, a comparison table has been added for the application components, where you can also select the components and analyze them in the pivot chart:
All transactions are available for analysis in the Trace view , where the table is sorted by any column (for example, you can quickly find the longest transaction):
From any view, you can open a dashboard, in which you will find graphs and metric values by host and components on it:
There is a search by host names, components, tracing, tags, zones - masks (*) and unions (AND / OR) are supported:
A distinctive feature that no other SM currently has is working with historical data in Timeshift mode. When scrolling the timeline (Timeline), we see not only all the events in the past tense, but also what the map (physical / logical) looked like in the past. For example, you can see that Tomcat stopped working on the server, how it affected the interaction of the application components, as the infrastructure map and the application components map used to look like. In the same way, you can watch transactions (tab Application → Trace ).
In the new version of the backend, all events are collected in a separate Incidents tab, where you can sort the table by columns and analyze the details:
The links in the details, you can immediately go to the detailed dashboard of the corresponding component.
Unlike classical infrastructure monitoring (host availability, CPU utilization level, HTTP page accessibility, etc.), application monitoring imposes more serious requirements on the frequency and granularity of the collected data. The more often we get the value of a certain metric, the better, especially for transactional monitoring. This is due to the fact that problems with the operation of the application can be very short and the consequences are quite noticeable. To compare graphics with different granularity (1 minute vs 5 seconds):
It is immediately clear that insufficiently detailed data in some cases will not allow detecting a problem. This system allows you to collect data with a frequency of up to 1 second . To reduce the amount of historical data, they are aggregated with respect to prescription - the further, the lower the granularity: 1 second (live data is stored for 10 minutes) → 5 seconds (stored for 1 day) → 1 minute (stored for 31 day) → 5 minutes (stored for 3 months ) → 1 hour (stored for 1 year, but can be increased).
Automatic Discovering of components is very useful: if the Instana agent is installed on the host, all components and services known to it automatically appear in the CM. This is especially important when your application is built on microservices :
The list of supported technologies includes almost everything that is popular now. Naturally, you can look at the transactions and analyze the application at the level of the method call (in the documentation there are details of the trace mechanism ).
An important criterion when choosing a SM for us is Scala support, this is a rarity for SM applications. It may seem that for Java, Java support is sufficient — and deep monitoring of the application ( instrumentation ) is in your pocket. But in fact it turns out that this is not the case: without the support of Scala, the monitoring will show only a trace of one JVM call. Therefore, even the most famous players in the APM market today are lagging behind in this regard.
The system sees changes of components on the principle of delta :
In addition, the system is capable of online displaying the state of interaction between components (the frequency of moving points on the links indicates how fast the data is being transferred):
The following integration options are available for out-of-box notification:
- OpsGenie
- Pagerduty
- Slack
- Webhook
The product is actively developing , but now it looks like a convenient tool for finding problems with the application both at the testing / debugging stage and for operational monitoring.
Links
The article used materials:
Source: https://habr.com/ru/post/317254/
All Articles