Reporting system: how to get 50 million reports and save Zen

The more complex the software product, the more it interacts with third-party systems (often no less complex), the higher the likelihood of failures. Testing helps to find most bugs before rolling out a release, but sometimes something can slip through . And in order to quickly receive detailed information about the fact of failure and related conditions, the reporting system is widely used in our products. We want to tell about its device today.
Usually, applications fall due to bugs or unpredictable user actions. To understand the cause of the crash, you need to collect various information: in what environment the application works, what the user did. In general, the data that can help us solve the problem. To do this, use the system of sending reports on the application and on the facts of failures.
')

In addition to investigating the causes of failures, we use reports to analyze user behavior. To do this, we initiate an anonymous collection of usage statistics for our applications about once every three months. We look at which functions are used most often and in what situations, whether users experience difficulties. This helps us adjust product development plans. Take, for example, Parallels Desktop . We wonder how many users run one virtual machine, two, four, and so on. If the majority have one VM, then it is obvious that it does not make sense to strongly optimize the interface for using several virtual machines, and so on.
Implementation details
Reports are sent both automatically when the application crashes, and at the initiative of users. They include application logs, crash dumps, memory dumps, machine configuration information, sometimes some other service information. All this is packaged in a tar.gz file, the size of which ranges from a few to hundreds of megabytes, and is sent to our server. Here, the file is subjected to preprocessing, service information is added to it - the sender's IP address and a timestamp - and then the file is uploaded to MongoDB.
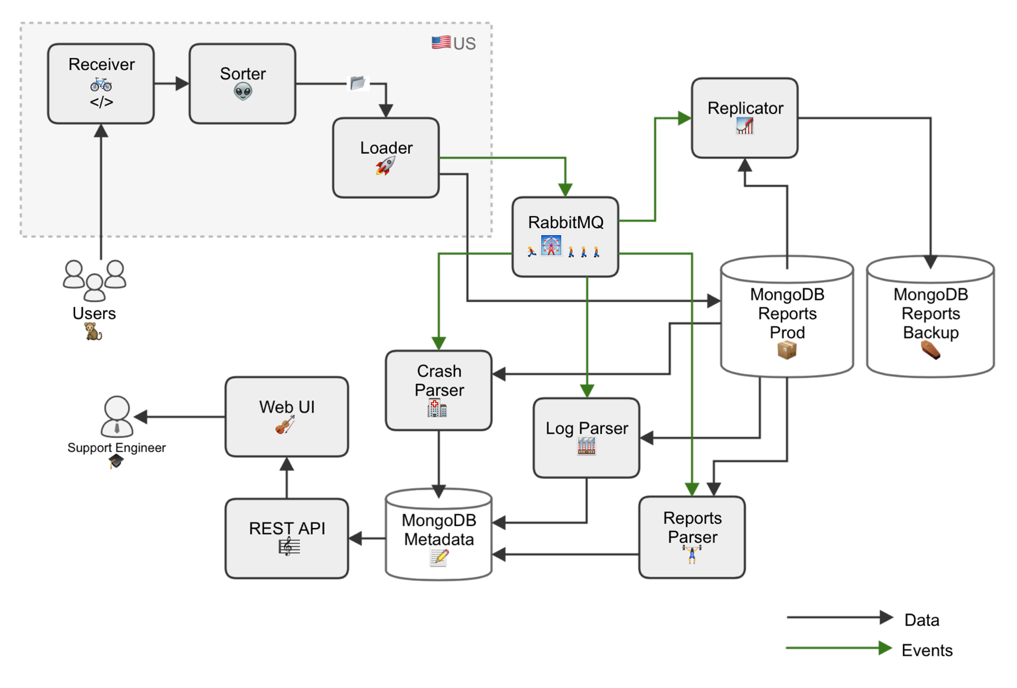
Then there are two scenarios:
• Developers can manually analyze XML files, logs, and configuration in order to understand the environment in which the application is running and what the user was doing.
• The report can be automatically classified and included in the overall statistics.
The classification is done this way: the parsers written in Python receive the reports filled in MongoDB from the RabbitMQ ID, extract the state-trace from them, and assign a text label - a signature - according to certain rules. Parsers extract the necessary data from XML files and put them in the form of separate documents with indexed fields.
We also have special parsers, each of which handles specific types of crash reports. They go through each report and see if there are any files of interest there. For example, one parser looks only for Mac reports, another only for Windows, and so on. Then they build the signature in the same way. The components of the reporting system are deployed using Chef .
General statistics on reports in real time is displayed on a special web page where you can sort data by signatures and individual fields. For example, according to Mac OS, guest OS and product version. This helps to quickly understand what problem should be solved in the first place, if the number of some signatures suddenly begins to grow dramatically, for example, after the next update.
Server park
On average, we process about 400,000 reports per month, 100 gigabytes. For 10 years, we have accumulated more than 50 million various reports. Reporting servers are located in the USA because most of our users are there. But the storage, processing and analysis of data are performed in Russia. Previously, sometimes it happened that the reports came faster than we had time to process and transmit across the ocean. Now we have already tested and started to implement a system that uses queues and microservices for parsing. The number of microservices can be changed depending on the current load, so the only limitation can be only the bandwidth of the channel.
How many servers serve our reporting system:

If necessary, any of the subsystems can be scaled, adapting to the growing load.

Reports are not only a source of detailed information on failures, but also an “early warning” system. Often, users do not immediately contact support, but only if they encounter a problem several times. But thanks to automatic reports, we will quickly see an increase in the number of failures and immediately begin to solve the problem. Often we fix a bug before a wave of appeals goes in support.
Source: https://habr.com/ru/post/317116/
All Articles